Call to Order Welcome & Introductions Disposition of the Minutes Financial Report Chairman’s Report Standing Committee Spotlight Nominating Committee Report Partnership News Old Business New Business Adjournment
Call to Order Welcome & Introductions Disposition of the Minutes Financial Report Chairman’s Report Standing Committee Spotlight Nominating Committee Report Partnership News Old Business New Business Adjournment
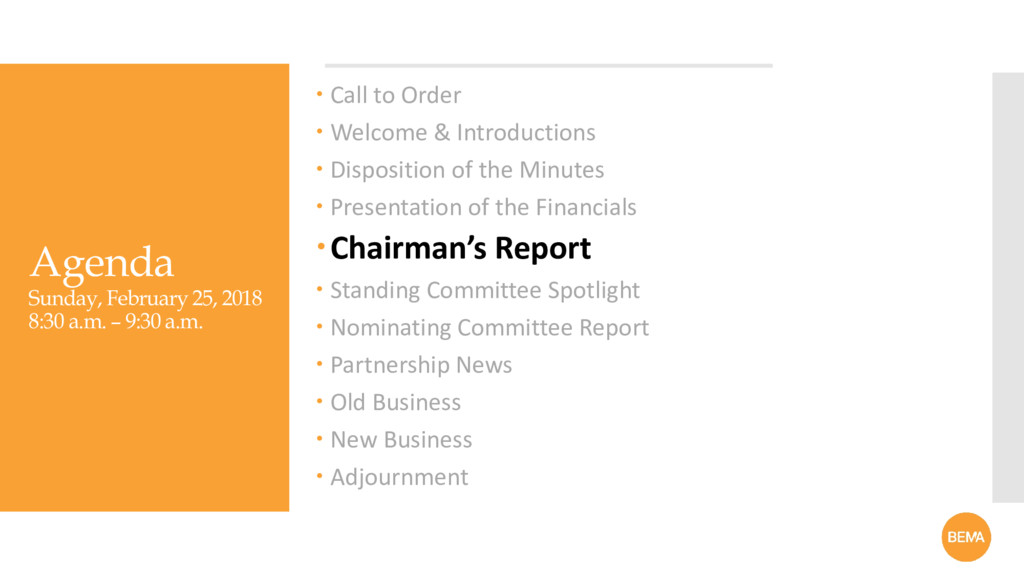
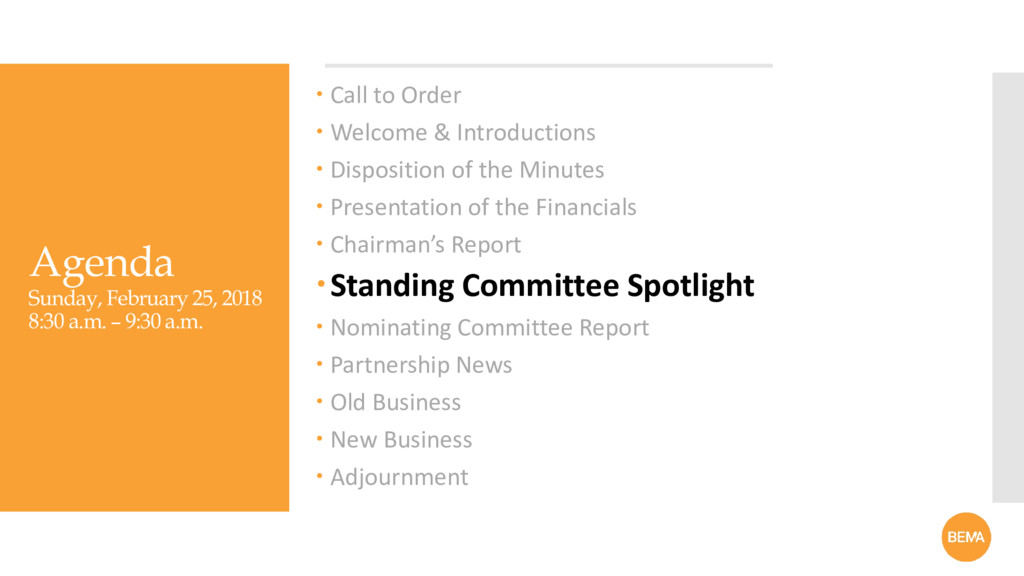
Call to Order Welcome & Introductions Disposition of the Minutes Presentation of the Financials Chairman’s Report Standing Committee Spotlight Nominating Committee Report Partnership News Old Business New Business Adjournment
and provides resources for its members and the industries they serve. Vision Statement BEMA creates an overwhelming competitive advantage for our members
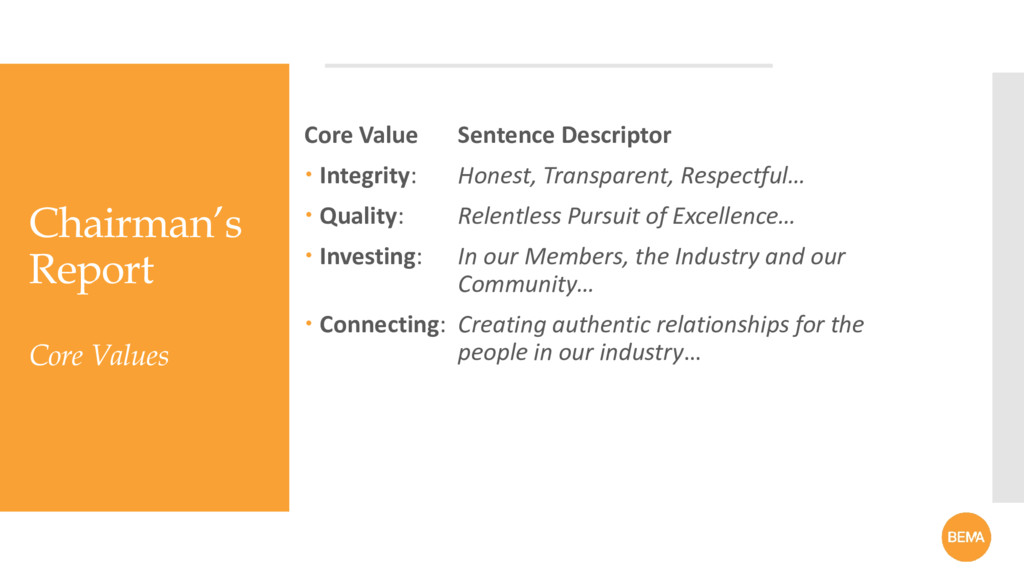
Honest, Transparent, Respectful… Quality: Relentless Pursuit of Excellence… Investing: In our Members, the Industry and our Community… Connecting: Creating authentic relationships for the people in our industry…
#1: Innovative Education Training & Professional Development Strategic Focus Area 2: Member Focused Engagement and Value Strategic Focus Area #3: Financial Strength and Sustainability Strategic Focus Area #4: Build Strategic Alliances and Partnerships
Call to Order Welcome & Introductions Disposition of the Minutes Presentation of the Financials Chairman’s Report Standing Committee Spotlight Nominating Committee Report Partnership News Old Business New Business Adjournment
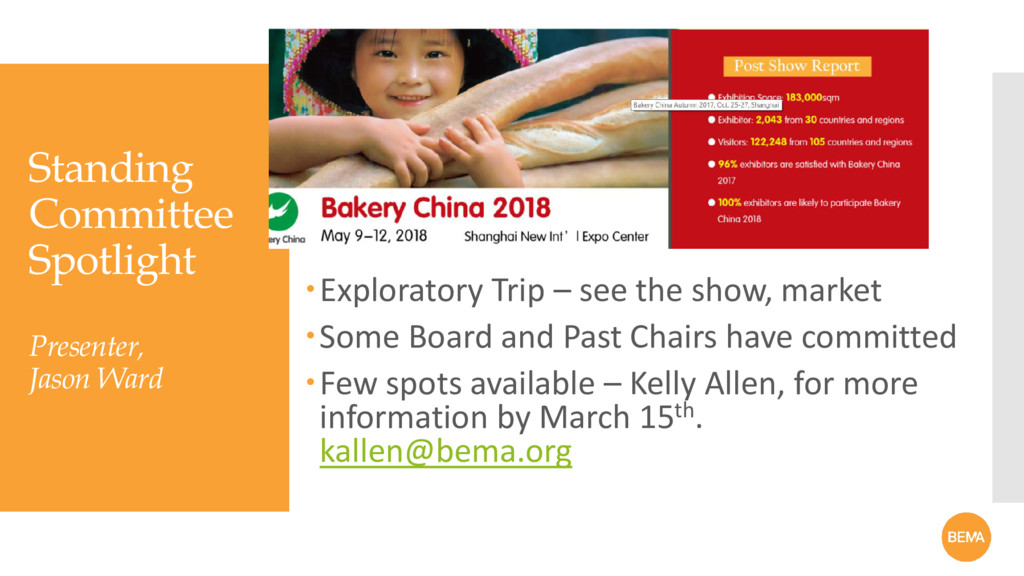
Committees/Chairs Mr. Jason Ward, International Committee Mike Day, Membership Committee Jim Warren/Jay Hardy, Convention & Program Committee Mark Podl, Scholarship Committee Patrice Painchaud/Clay Miller, Marketing Committee Mike Pierce, Safety & Sanitation Committee
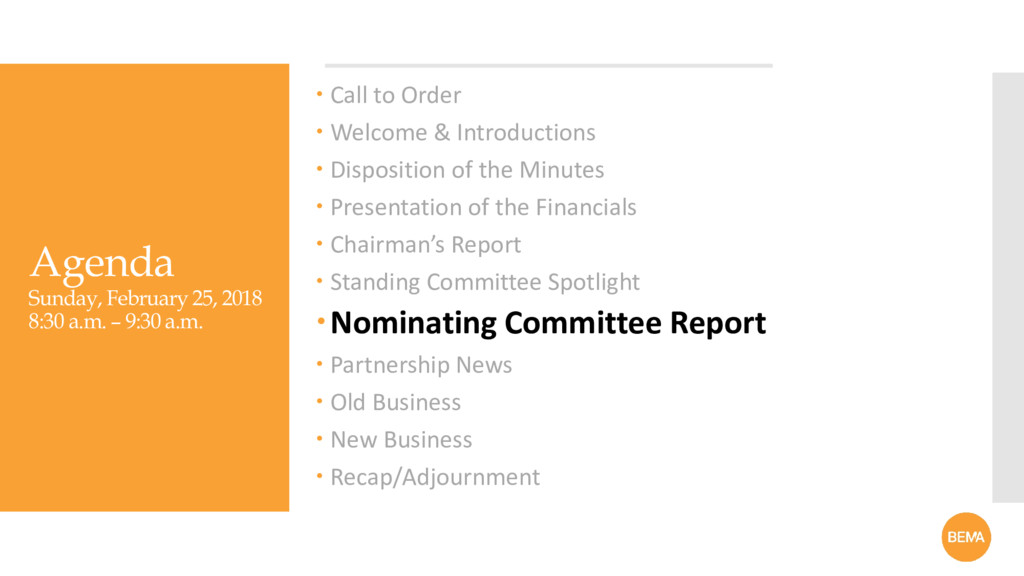
Call to Order Welcome & Introductions Disposition of the Minutes Presentation of the Financials Chairman’s Report Standing Committee Spotlight Nominating Committee Report Partnership News Old Business New Business Recap/Adjournment
Call to Order Welcome & Introductions Disposition of the Minutes Presentation of the Financials Chairman’s Report Standing Committee Spotlight Nominating Committee Report Partnership News Old Business New Business Recap/Adjournment
Capita Index 80 85 90 95 100 105 110 2011 2012 2013 2014 2015 2016 2017 2018 2019 2020 2021 2022 2023 2024 2025 2026 Unit Sales per Capita Index (2016 = 100 and in 2016 $’s) 2016 Constant Unit per Capita Sales Trend Unit per Capita Sales Forecast Source: IRI and US Census Projection based on past 5 years and US Census Population estimates -1.5% / year $12.4 Billion at risk
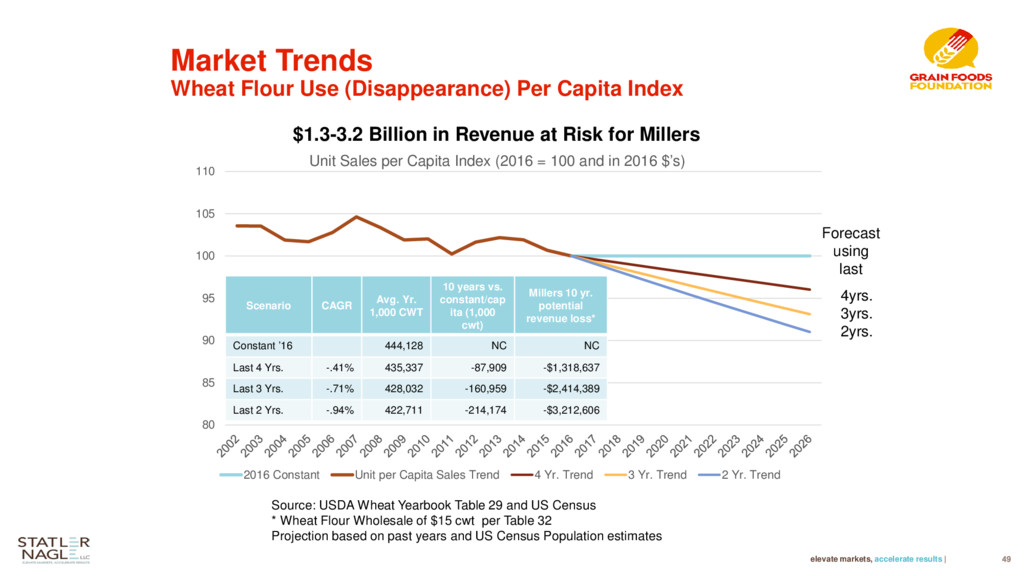
(Disappearance) Per Capita Index 80 85 90 95 100 105 110 Unit Sales per Capita Index (2016 = 100 and in 2016 $’s) 2016 Constant Unit per Capita Sales Trend 4 Yr. Trend 3 Yr. Trend 2 Yr. Trend Source: USDA Wheat Yearbook Table 29 and US Census * Wheat Flour Wholesale of $15 cwt per Table 32 Projection based on past years and US Census Population estimates $1.3-3.2 Billion in Revenue at Risk for Millers 4yrs. 3yrs. 2yrs. Forecast using last Scenario CAGR Avg. Yr. 1,000 CWT 10 years vs. constant/cap ita (1,000 cwt) Millers 10 yr. potential revenue loss* Constant ’16 444,128 NC NC Last 4 Yrs. -.41% 435,337 -87,909 -$1,318,637 Last 3 Yrs. -.71% 428,032 -160,959 -$2,414,389 Last 2 Yrs. -.94% 422,711 -214,174 -$3,212,606
and Industry Must Coalesce - The Industry is Declining with multiple causes • Bread products are foundational product in most severe decline - Creativity, Education, Innovation Lacking in Industry • GFF current program support is firm but, a recognition that it is not enough • Need Bigger Industry Commitment to Turn the Ship - We are Jockeying for Share of Shrinking Pie -- Instead of Growing the Pie Stakeholder Assessment Source: 2013 GFF interviews, and 2017 Statler Nagle interviews; combined over 65 interviews/35 organizations
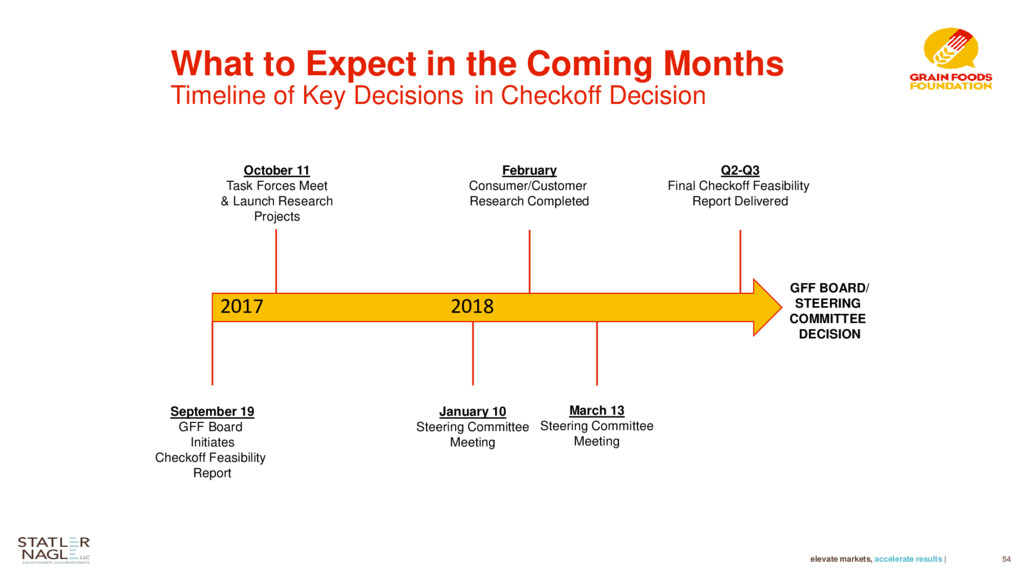
• GFF: - Restructuring activities to maintain current programming while checkoff feasibility is assessed - Staffing increases - Funding three research projects • Checkoff Feasibility Project: - Steering Committee formation - Engaging the direct funders and other stakeholders in a transparent process - Initial meeting January 10; Second meeting March 13
Coming Months A Deliberative Process • Steering Committee Will: - Integrate research and analytic findings - Construct an ROI model to help define the parameters of funding, governance, and strategy - Build the architecture of a marketing framework - Conduct innovation assessment to determine if a checkoff could substantially improve rate and quality of Industry innovation
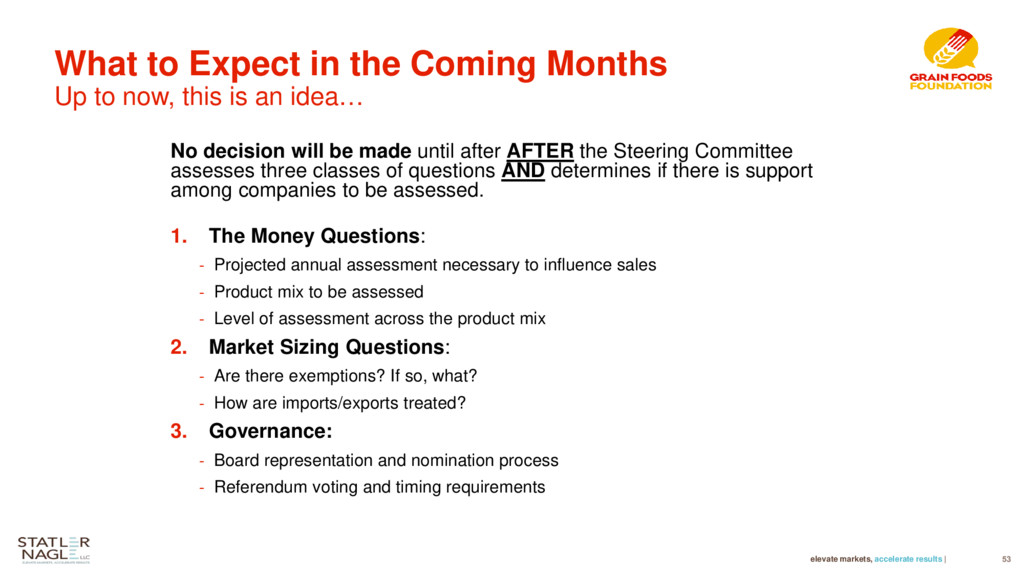
Coming Months Up to now, this is an idea… No decision will be made until after AFTER the Steering Committee assesses three classes of questions AND determines if there is support among companies to be assessed. 1. The Money Questions: - Projected annual assessment necessary to influence sales - Product mix to be assessed - Level of assessment across the product mix 2. Market Sizing Questions: - Are there exemptions? If so, what? - How are imports/exports treated? 3. Governance: - Board representation and nomination process - Referendum voting and timing requirements
Call to Order Welcome & Introductions Disposition of the Minutes Presentation of the Financials Chairman’s Report Standing Committee Spotlight Partnership News Old Business New Business Recap/Adjournment
Call to Order Welcome & Introductions Disposition of the Minutes Presentation of the Financials Chairman’s Report Standing Committee Spotlight Partnership News Old Business New Business Adjournment