Upgrade to Pro — share decks privately, control downloads, hide ads and more …

18-01-15 Pump-N-Dump

18-01-15 Pump-N-Dump

Having forced real and nominal yields, credit spreads, and volatility measures to such low levels, central banks have boxed themselves into a corner where any quickening of the CPI measures on which they so unduly focus could prove highly disruptive

Cantillon Consulting

January 14, 2018
Tweet

More Decks by Cantillon Consulting

Other Decks in Business

Transcript

  1. Insight & Support for the Managers of Wealth www.cantillon-consulting.ch “Silver

    alone is the true sinews of the circulation” Essai sur la Nature du Commerce ©2018 Cantillon Consulting January 2018 Cantillon Consulting January 2018 Pump’n’Dump Driven to extremes by central bankers’ pursuit of the chimera of 2% CPI growth, asset market inflation may well have left them trapped.
  2. ©2018 Cantillon Consulting Please see the disclaimer at the end

    of this document PAGE 2 Insight & Support for the Managers of Wealth www.cantillon-consulting.ch January 2018 Though the days when the influence of the seasons domi- nated our working routine are long past for most of us, the turn of the year still sees the traditional wave of review/ preview articles, each trying to summon some profundity out of an exercise which all too often boils down to reading out a list of the previous year’s winning lottery combina- tions and then offering finger-in-the-wind projections as to which numbers will appear most frequently in the draws to come. The first aspect – the post mortem element, if you will – need not detain us too long. Suffice it to say that it was a year in which the many critics of the US economy - wheth- er or not motivated by their political distaste for its new administration - were largely confounded. As we spent some time arguing in the first quarter of last year, all the signs were that what we called the ‘Hidden Re- cession’ of the prior two years – a retardation almost exclu- sively related to both the shale bust and the wider weakness in the extractive, metal-bashing and farming industries – was then definitively behind us, leaving the way open for a renewed period of widespread, if unspectacular, advance. Nor were we deflected from this verdict by the doom- mongers’ unrelenting croakings about the country’s swell- ing tally of debt – even if such considerations are particular- ly salient to our own, Austrian School analysis of the world. Yes, we admitted, absolute debt levels were rising and, yes again, the mute averages by which we usually categorize such measures can hide a multitude of sins – credit cycles being an inverted kind of fish which usually rot from the tails. But it was also evident, we countered, that not only had the Fed (with more than a little help from the ECB) rendered the cost of servicing that debt inordinately low, but that the aggregate income out of which it must be borne was growing faster than that same debt’s sum. With private payroll earnings growing at a seemingly un- shakeable 4.5% per annum, compounded, for getting on for the last eight years – raising the measure overall by a cumulative 40% - a simultaneous rise in household debt of less than 10% was not the most parlous of outcomes. In- deed, as the BIS numbers for credit to the private sector illustrate, US household debt has fallen 20 points from its pre-crash heights of 98% of GDP, taking it back to the levels of 15 years ago from whence – so far at least – it re- fuses to rise. If the picture is not quite so sanguine on the corporate front – where debt/EBITDA-type measures are back to (and in some cases, through) their previous peaks and, hence where RO-swollen-IC does not look anywhere near as appealing as does RO-shrunken-E - there are some ten- tative signs that the worst dilution of the balance sheet which that trend has encompassed is at last behind us. We say this, because the running four-quarter count of stock-buybacks dipped below $400 billion in Q3 with the trimester itself registering the equal lowest degree of retire- ment since 2010 (even if the S&P divisor for QIV suggests that level of parsimony was not fully maintained in the final three months of the year). It would be premature to sound the all-clear on the basis of such partial numbers, but we can at least be reassured that things are not deteriorating as rapidly as they were just a few, short quarters ago. Though many on the sell-side are salivating at the prospect that the Trump tax deal will rejuvenate such activity, we would argue the point is somewhat moot. Whatever the short-term temptations being presented to CFOs, it is hard to deny that the changes have theoretically reduced some of the incentives to use central-bank largesse to rejig the capi- tal base. In the first instance, it has obviated the practice of borrowing at home against cash piles held abroad in order to make pay-outs on which only the recipients must pay tax. Potentially, too, by limiting the interest-deductibility of new debt and so removing some of its artificial attractive- ness vis-à-vis equity, there might well be a little less Miller- Modigliani equivalencing taking place in future. Ironically, the perennial pessimists – people who, we might say, neither wish to have their cake nor eat it – have spent much of the year alternating between bemoaning such Summary One of the prevailing stories which nervous market participants whisper to each other at bedtime involves the timely appearance of the Fairy God- mother, hastening to Earth from Tir Nan Og to launch another multi-trillion round of money-printing the instant that our over-inflated asset pric- es suffer any meaningful setback. This comforting narrative, however, presupposes three key elements: firstly, that the macro-economic background will allow Her the leeway to wave Her wand sufficiently early to stop the rot; secondly, that the Evil Fairy doesn’t get there first and proceed to deliver a much-needed fright before finally ending the naughty children’s nightmares; and finally that, Good or Evil, the Fairy’s magic proves pow- erful enough to ward off a rather darker enchantment which both Fairy and frightened children might manage to cast upon each other when they meet. “Man is born Free, but is everywhere in Bonds” Jean-Jacques Rousseau II
  3. ©2018 Cantillon Consulting Please see the disclaimer at the end

    of this document PAGE 3 Insight & Support for the Managers of Wealth www.cantillon-consulting.ch January 2018 -25.0 -12.5 0.0 12.5 25.0 37.5 50.0 -16.0 -12.0 -8.0 -4.0 0.0 4.0 8.0 Dec-91 Dec-95 Dec-99 Dec-03 Dec-07 Dec-11 Dec-15 Private NFP Wages Earned & MFG/Trade Sales , 3mmaYOY: Source - BLS, Census Wages (rhs) Revenues (lhs) -$300 -$250 -$200 -$150 -$100 -$50 $0 $50 $100 $150 $200 $100 $200 $300 $400 $500 $600 Dec-98 Dec-01 Dec-04 Dec-07 Dec-10 Dec-13 Dec-16 US Equity Retirements, blns: Source -FRB YOY (rhs) 4Q Sum (lhs) Income from US employment has been running at a constant 4.5% throughout the expansion. Turnover, meanwhile, has shak- en off the shale bust & is now rising smartly. While some would see a slow- down in equity retirement as negative for stock prices, it would be much more positive in terms of the health of the under- lying business. Surely a development which is more than a little desirable in the circumstances...
  4. ©2018 Cantillon Consulting Please see the disclaimer at the end

    of this document PAGE 4 Insight & Support for the Managers of Wealth www.cantillon-consulting.ch January 2018 Though stock prices have clear- ly outgrown earnings per se (as attested by the rising multiples), if we adjust for the effect of low- er interest rates on the worth of the deferred income flows, the disparity is not nearly so great A clear illustration of the effects of the ‘Hidden Recession’ and also of the subsequent recovery Whether that of itself has been enough to justify the scale of increase in stock prices—or, more importantly, to allow us to expect more of the same—is THE burning issue Value Line Index Log scale
  5. ©2018 Cantillon Consulting Please see the disclaimer at the end

    of this document PAGE 5 Insight & Support for the Managers of Wealth www.cantillon-consulting.ch January 2018 trends and simultaneously forecasting doom on the basis of the lack of growth of Commercial & Industrial loans on bank balance sheets! Cognitive dissonance aside, the fact is that when this particular canary fell off its perch in the coalmine, it was readily replaced by a whole aviary of feath- ered friends, as the record issuance in all manner of debt markets – much of it conducted at ever lower spreads and yields and to the accompaniment of ever less onerous con- ditions – will attest. Conversely, the long-awaited accelera- tion in revenue growth, plus the abundant M1-type liquidity in the markets, would have done much to dampen demand for short-term finance. Ultimately then, on the macro front, there are few obvious signs of woe at present, though that is not to say that asset markets can anticipate further plain sailing as a result. Parachutes Make for Bad Pilots Yes, revenues of S&P500 companies are now up some 60% or more from their previous peak in 2007, while their col- lective earnings are around 40% greater (and so have roughly matched the overall increase in indebtedness), but prices have climbed almost 80% for these behemoths, while the average stock price – as measured by the Value Line index, for example, is up almost twice as much in that same time. Add the fact that the latter has risen at 30% compounded, 68% cumulative, over the past two years alone and it would be hard to see that performance being repeated – certainly not in real terms – under any conceiva- ble circumstances. Of course, the central banks’ deliberate engineering of the contemporary decline in bond yields – especially of those yields most pertinent to corporate issuers – has acted to promote this degree of price growth and multiple expan- sion, in any manner of ways. It has forced the yield-hungry and the long-term liability- driven to switch from ostensibly less risky assets. It has fostered wholesale corporate manipulation – not just the buy-backs we have touched on above, but also buy-outs, takeovers, and asset-stripping cash-outs on the part of the increasingly influential coterie of PE outfits. It has lowered the cost of leverage among those who wish to play with borrowed table stakes. It has given the stock market its own veneer of justification by lowering the discount rate one applies to one’s estimate of future earnings. Recognition of that fact is not entirely lacking among those riding the coat-tails of the ECB, the BOJ, and the SNB, people who have been known to interrupt their buying for a few fleeting moments in order to mutter something sage about what will happen when the central banks cease their headlong career to financial insupportability. Thus far, any such queasiness has been suppressed by the ultimate, morally hazardous palliative – the not entirely spe- cious expectation that, at the first signs of a recoil in the real economy, said central banks will not only halt the ten- tative restriction the more confident of them are undertak- ing but -along with their diehard, money-pumping peers - will turn on the proverbial sixpence and lift all the bids – and boats - in the market once more. Once could even rationalize the flattening trend hitherto being seen in fixed income in this manner. It is not so much a case of mounting borrower distress, compounded by rising investor risk-aversion - as seen in a classic Hay- ekian bust - which is at work. Nor is it just the deadweight of the Europeans’ ECB-led guzzling of over €50 billion a month in ROW duration (two-thirds of that seemingly not even requiring any take-up of shorter-term finance to ac- complish). No, at least in part, it is the idea that the greater the rise in the Funds rate now, the more advanced that happiest of days when the market briefly stumbles, only for the baby-step increases at the front to be reversed in great bounds and, all worry exorcised for the foreseeable future, the advance may start afresh. Sauter pour mieux reculer, as it were! Are you thinking what I’m thinking The test of this theory may not be long in coming. Though technical analysis should be an aid to the investment pro- cess, not the alpha and omega of it, by now the whole world has woken up to the fact that a series of well-defined trend-lines, stretching back at least to the spike highs traced out around the Crash of ’87 (and possibly further, depend- ing on exactly how you cast them) are undergoing a very severe test at present. Given the extreme compression of credit spreads and of volatility; the lack of much cushion in absolute yield levels all along the spectrum, plus the feedbacks of risk-parity strategies; the ever-present perils of cross-margining (aka: ‘digging up the flowers and watering the weeds’) and even that long-forgotten delight of mortgage-bond negative con- vexity hedging, one might fear the non-linear worst. Perhaps the main, if slightly perverse, comfort is that the COT footprint of bond market specs has them heavily short already, though this solace is lessened somewhat by the further realisation that the momentum chasers are also heavily committed to playing the flattening we have seen up to now and hence that they are particularly vulnerable if the long-end now takes the greatest degree of fright and un-
  6. ©2018 Cantillon Consulting Please see the disclaimer at the end

    of this document PAGE 6 Insight & Support for the Managers of Wealth www.cantillon-consulting.ch January 2018 -$200 $0 $200 $400 $600 Mar-15 Sep-15 Mar-16 Sep-16 Mar-17 Sep-17 Cumulative Net Euro Area Flows into US, blns: Source - BEA DEBT FDI OTHER EQUITY SUM Far from signalling incipient economic distress at home, the surfeit of investible funds ema- nating principally from Draghi’s Europe is what has really been depressing US long rates. Regardless of that, the Fed will be in receipt of other signals as to the desirability of continuing to raise rates, not least from its beloved 5y5y break-even rate. 30 Jan-62 Jan-67 Jan-72 Jan-77 Jan-82 Jan-87 Jan-92 Jan-97 Jan-02 Jan-07 Jan-12 Jan-17 -180 -120 -60 0 60 120 180 240 300 0 250 500 750 1000 1250 1500 Spread between UST5yrs & 5yr x 5yrs, basis points: Source - FRED QE Era Moreover the move has really constituted a mean reversion from QE-inspired extremes. Note, too, that modern-day re- cessions are usually accompa- nied by substantially negative values, not small positive ones. For some while now, the major influence on that gauge has been the crude oil price. Unfortunately for fixed income buyers, that latter also seems to be on the verge of a major breakout
  7. ©2018 Cantillon Consulting Please see the disclaimer at the end

    of this document PAGE 7 Insight & Support for the Managers of Wealth www.cantillon-consulting.ch January 2018 The charts that are keeping everyone not blindly chasing the stock market higher awake at night. 10-years on the brink... ...and 5-years—the perennial ’dog with fleas’ in a bear mar- ket—is even more threatening. But then, these are the only long-term downtrends break- ing to the upside. No more ‘irrational’ than an investor following the above chart has been the behaviour of our technocrat CB masters following the progress of the plot to the left. It, too, is in a secular sort of jeopardy.
  8. ©2018 Cantillon Consulting Please see the disclaimer at the end

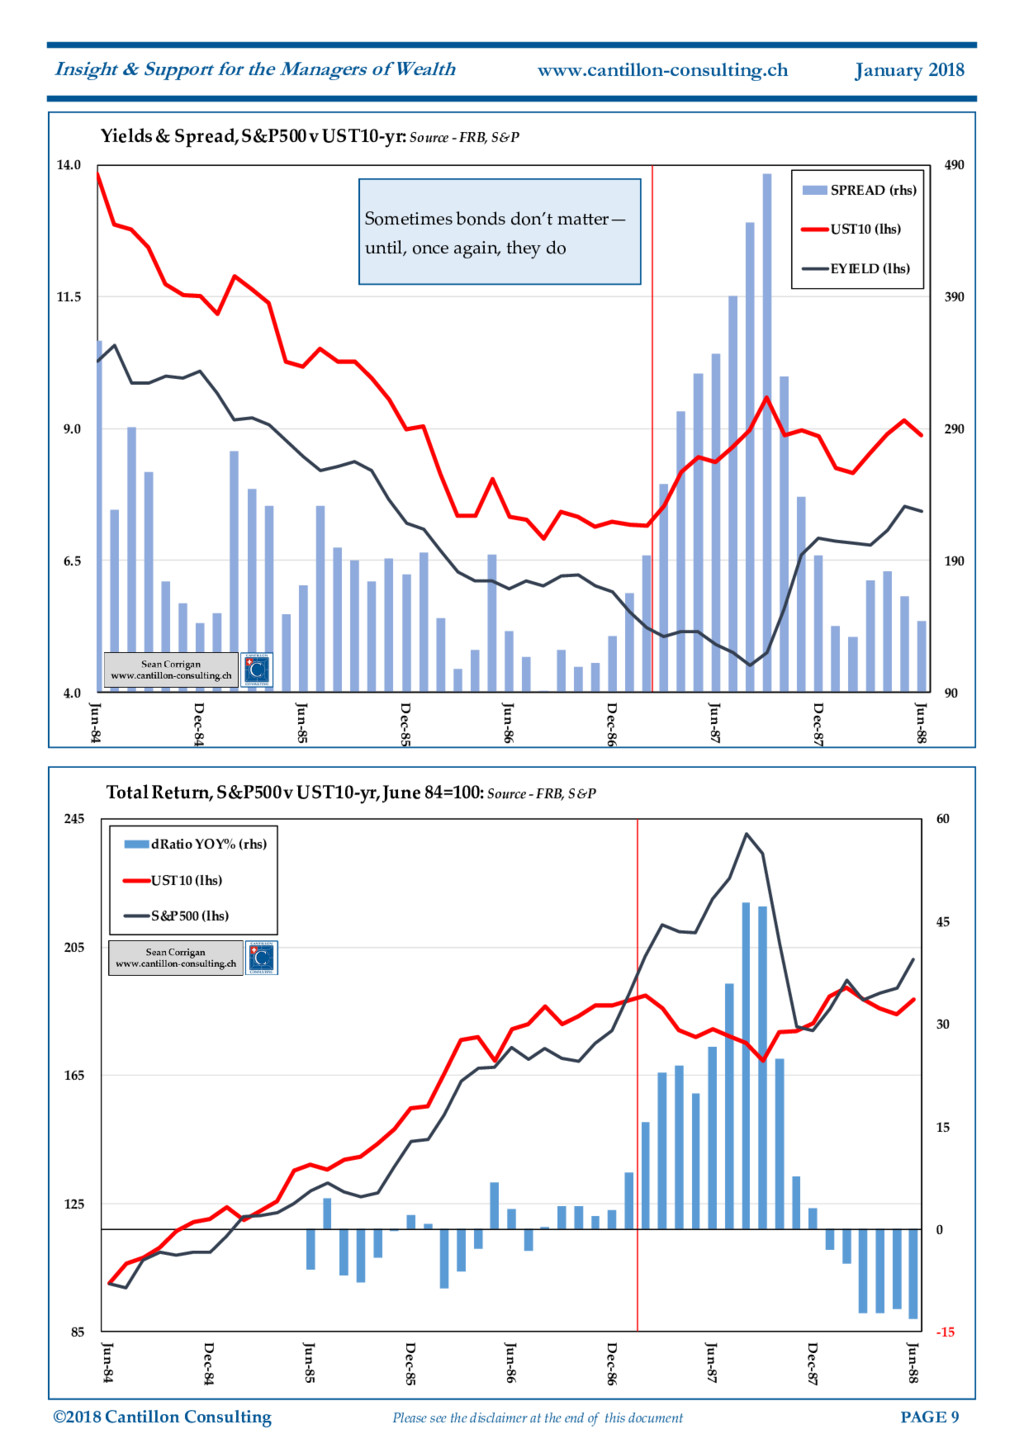
    of this document PAGE 8 Insight & Support for the Managers of Wealth www.cantillon-consulting.ch January 2018 leashes a mass-liquidation of such positions. Where things would get really interesting is if the current back-up in bond yields begins to persuade the central bank to ‘read’ this as implying that higher, real world inflation expectations are being expressed and therefore as a signal that they should begin to temper their still elevated degree of accommodation. Adding to this, there is every possibility that the inherently flawed but highly influential gauge of 5- year forward inflation break-evens, so beloved of the We’re -Watching-You-Watching-Us-Watching-You crowd, will be propelled up through its own trigger point at 2.2% by, among other things, the resurgent oil price which exercises an inordinate influence upon it. That, in turn, would spook the horses in a bond market long since populated by whatever the antonym is of ‘vigilantes’ (‘desperadoes’?). With they and the Fed cueing hopelessly off each other, that would set us up perfectly for a frantic tail-chase and, inevitably, to a subsequent knock- on into most other asset classes - with the possible excep- tion of that most reliable of fixed-income antitheses, the commodity market. Bonds Bite Back Those who are as long in the tooth as are we might just recall that, much like in recent times, the combination of a commodity price collapse amid a temporary oil glut in 1986, coupled with heavy-handed, official attempts to re- order market prices (in that case the external value of the US dollar), encouraged policy-makers to run too loose for too long and to ignore both the dramatic increase in equity prices which ensued and their developing disconnect with bond yields. Stocks already having rallied 25% from the cyclical lows set in mid-1984, further impetus was received once the dollar- suppressing Plaza Accord was signed in the autumn of 1985. Then, a few months later, Saudi began an attempt to teach OPEC (read: Venezuela) some manners, a move which saw the oil price collapse from circa $30/bbl to around $10. Forex intervention flooded the world with US dollars, while cheaper energy encouraged the Fed to cut the rates payable on them to 9-year lows of just under 6% (sic) by the end of 1986. Equities responded gratefully, adding a further 25%. A few months later still, with the decline in the dollar hav- ing changed in the interim from a cause for delight to a source of alarm, the Louvre Accord declared the major powers’ intent to arrest it. At first, the combination of a promise of modest supply-side reforms (lower government spending matched by reductions in taxation) with easy money policies worked its magic and the stock market em- barked on what would be another, culminative 35% ad- vance. However, as the basis effect of cheap oil dropped out of the calculations and as the previous years’ FX-inspired monetary infusions worked their way through the system, CPI hit bottom – at a two-decade low of just over 1% - and, as it climbed once more, the Fed and the Bundesbank began to tighten (yes, children, even with CPI well below the magical 2%!), the former hiking by 1.4375% in just nine months. Notwithstanding this, the dollar continued to slide, drop- ping another 13.5% over the year before finally finding a measure of stability. Spooked by the combination of rising rates, quickening price rises, and the currency’s ongoing depreciation, 10-year Treasury yields soared from 10-year lows of 7% to a peak of 10.25%, costing domestics around 20% of principal to which the twin-deficit nation’s principal foreign sponsors added their hefty forex losses. Stocks first began to wobble that summer, hitting a peak valuation which constituted a 118% rise from the mid-84 lows and topping off a move which had seen P/E ratios more than double from that earlier nadir’s 9.5 to a peak which was something in excess of 22 – a level unrivalled since 1961 and materially unsurpassed since the bottom of the Great Depression itself. In 1987 alone, the multiple expansion, by running counter to the bloodbath underway in the bond market, saw the gap between earnings yields and those accruing to Treasur- ies explode from a modest enough 1.1% in favour of bonds to a hefty 5.75%. This dichotomy was soon to prove all too much to bear. Finally losing momentum in the last week of August, the market traded nervously sideways to lower into mid- October, shedding a modest 6% to erode most of that swansong summer’s climactic gains. Then, in the third week of the month, sentiment suddenly darkened and a slide of almost 10% occurred. Finally, after a long week- end of worry, aggravated by the liquidity-sapping effects of the UK hurricane and a number of unfortunate political comments from US officials, on Monday 16th, the bottom dropped out of the market. The Dow registered a record- breaking 22.6% single-day decline ahead of a series of less dramatic (if no less worrying) aftershocks which lopped another 10% off the price by the time it set its lows on Oc- tober 28th.
  9. ©2018 Cantillon Consulting Please see the disclaimer at the end

    of this document PAGE 9 Insight & Support for the Managers of Wealth www.cantillon-consulting.ch January 2018 90 190 290 390 490 4.0 6.5 9.0 11.5 14.0 Jun-84 Dec-84 Jun-85 Dec-85 Jun-86 Dec-86 Jun-87 Dec-87 Jun-88 Yields & Spread, S&P500 v UST10-yr: Source - FRB, S&P SPREAD (rhs) UST10 (lhs) EYIELD (lhs) -15 0 15 30 45 60 85 125 165 205 245 Jun-84 Dec-84 Jun-85 Dec-85 Jun-86 Dec-86 Jun-87 Dec-87 Jun-88 Total Return, S&P500 v UST10-yr, June 84=100: Source - FRB, S&P dRatio YOY% (rhs) UST10 (lhs) S&P500 (lhs) Sometimes bonds don’t matter— until, once again, they do
  10. ©2018 Cantillon Consulting Please see the disclaimer at the end

    of this document PAGE 10 Insight & Support for the Managers of Wealth www.cantillon-consulting.ch January 2018 ABOUT THE FIRM The fruits of a lengthy exercise of full intellectual independence trading in, commenting upon, and analysing markets placed fully at your disposal to help enhance your investment process. Dedicated personal interaction, as well as written assessments, to enliven the debate and to mitigate risks by broadening the circle of opinion. Detailed macro/market research with the possibility of undertaking special commissions upon request. Ideas and arguments to incorporate into your existing framework of client communication on a ‘white label’ basis or to present as the stand-alone opinion of one of your firm’s expert counsellors. Assistance with content for reporting, proposals, marketing, etc. Education and training. Public speaking to entertain and inform you and your in- vited guests. For more information and to discuss the specifics of what we can offer, please write to info[at]cantillon-consulting.ch
  11. ©2018 Cantillon Consulting Please see the disclaimer at the end

    of this document PAGE 11 Insight & Support for the Managers of Wealth www.cantillon-consulting.ch January 2018 R² = 0.5874 -45.0 -30.0 -15.0 0.0 15.0 30.0 45.0 60.0 -22.0 -17.0 -12.0 -7.0 -2.0 3.0 8.0 13.0 18.0 23.0 28.0 Commodity Prices Fitted Macro Variables 1989-2017 Commodity Prices v World Trade, IP, CPI & M1, 3mmaYOY R² = 0.7825 -50.0 -25.0 0.0 25.0 50.0 75.0 -40.0 -30.0 -20.0 -10.0 0.0 10.0 20.0 30.0 40.0 50.0 Commodity Prices Fitted Macro Variables 1989-2017 Commodity Prices v World Trade, IP, CPI & M1, d2[3mmaYOY] Time for a reminder that the perfect anti-correlated asset where fixed income is con- cerned is commodities Commodity strength usually coincides with a quickening of world output and that has clear- ly been the case this past 18 months. Both growth—and, even better, accelerations—in prices, output, and money—are reliably reflect- ed in commodity prices as the simple linear regressions below reveal
  12. ©2018 Cantillon Consulting Please see the disclaimer at the end

    of this document PAGE 12 Insight & Support for the Managers of Wealth www.cantillon-consulting.ch January 2018 The upswing in Germany—one increasingly being felt across the Eurozone—is hardly compatible with present ECB policy. Might we expect the balance on the Council to shift before long? Even before that happens, bond returns have been dismal. Just wait until the market has to ab- sorb supply all by itself, once more... While all the focus has been on the US stock market, the Ger- man variety has hardly been subdued in its behaviour. Mar- ket cap has tripled from the 2009 lows while GDP has risen 35%, whole-economy property income, 40% and book value 65% STRETCHED!
  13. ©2018 Cantillon Consulting Please see the disclaimer at the end

    of this document PAGE 13 Insight & Support for the Managers of Wealth www.cantillon-consulting.ch January 2018 JUST SO So much for the history lesson. But are we really suggesting a similar confluence of events could be taking shape today? Like all broad historical parallels, there are as many salient differences of detail as there are similarities but, neverthe- less, there might just be enough in this to illustrate the kind of process by which the current bull market might meet its end. Take the case of the main easy-money offender. Europe has its own stock bubble; its own egregiously compressed bond yields and credit spreads; its own rapidly mounting property prices and falling commercial RE capitalisation rates; its long-awaited macro-upswing and a sufficient de- crease in the unemployment register to ease the most press- ing political pressures. With commodity prices – quintes- sentially, but not exclusively, those of the energy complex – rising, too, conditions are perhaps only a few inconvenient- ly elevated CPI prints away from sparking a palace revolu- tion. It is certainly no secret that, amid the gleaming glass- work of the ECB’s Frankfurt headquarters, several of the functionaries at the court of King Mario are already becom- ing restive, as the latest monthly minutes further confirm. With some tantalising hints that perhaps the BOJ has also decided that it should tacitly de-emphasize its own fatuous CPI targets amid an undeniable upswing in real-side activity and a powerful, concomitant rise in stock prices, another source of support for bonds might be similarly lessened in its effect. Finally, in the US - where sales are rising at the fastest pace in 5 ½ years, leading their relation to visible inventories to a smart improvement; where capital goods spending is on the rise; and where all the reputable survey responses (e.g., those from the NFIB, the ISM, and Duke-CFO) continue to strike an upbeat note – the Fed’s new Chairman is going to have to work hard to find reasons not to continue to tighten, especially against a backdrop where much is being made of the added fiscal laxity which Donald Trump’s newly-ratified tax package supposedly entails. In such an environment, it might be that the further stock prices now rally, by appearing to demonstrate both confi- dence in underlying economic strength and continued spec- ulative appetite, the more violent will be the reckoning when the bond market moves from muted protest to out- right revolt in the weeks and months ahead. As with all such considerations, not all of such elements need actually come to pass for the present asset-acquisition fever to be broken. All that is required is for just enough corroboration to be given – much of it endogenously gen- erated by market action itself – for the narrative to become dominant among traders and policy-makers alike and so to further reinforce their interpretations of events and lend their prophesies an air of self-fulfilment. And that, children, concludes our story of How the Bull Lost His Horns and the Bear Resharpened His Claws. Sean Corrigan