Upgrade to Pro — share decks privately, control downloads, hide ads and more …

AAGW3 - An Notenbaert - Prioritizing Rainwater Management Strategies and Other Recent Applications of RS and GIS in ILRI

CGIAR-CSI
March 25, 2013

AAGW3 - An Notenbaert - Prioritizing Rainwater Management Strategies and Other Recent Applications of RS and GIS in ILRI

CGIAR-CSI

March 25, 2013
Tweet

More Decks by CGIAR-CSI

Other Decks in Research

Transcript

  1. Prioritising rainwater management strategies and other recent applications of Remote

    Sensing and GIS @ILRI An Notenbaert African Agriculture GIS Week March 2013, Addis Ababa, Ethiopia
  2. Prioritizing rainwater management strategies in the Blue Nile basin… Funded

    by CPWF - in collaboration with IWMI, OARI, ARARI, ERHA
  3. Prioritizing rainwater management strategies in the Blue Nile basin… Multi-stage

    process Diagnosis Alternative options Characterisation of the options Targeting / out-scaling (ex-ante) Impact assessment
  4. A multitude of challenges • Food insecurity • High poverty

    levels • Declining soil fertility • Low and variable yields • Land degradation • Water logging • ….
  5. Characterisation of the rainwater management practices (RMPs) • Many different

    practices aimed at addressing one/several of these challenges • Suitable in different contexts • Bio-physical, socio-economic and institutional conditions that influence their suitability, adoption and success. RMP database
  6. “Suitability maps” - Matching conditions favoring the successful implementation of

    an option to a spatially referenced database: - Delineation of geographical areas where this specific strategy is likely to have a positive impact.  transforming the previously identified characteristics for a technology into variables for which spatial data exist or can be collected  GIS overlays
  7. Adoption of RMPs Variable at farm level (farm household survey)

    Orchard SWC Irrigation from the river Variable at woreda level Landholding size -0.3633014 (0.002) -0.32609 (0) 0.8432849 (0.001) Average landholding size* Landholding size square 0.0098738 (0.469) 0.025805 (0.031) -0.1226992 (0.006) average plot size 2.875819 (0) -1.460356 (0.01) Average plot size* number of plots 0.077025 (0) 0.0933675 (0.001) Land fragmentation* Household size/landholding size 0.0124864 (0.018) Population density* female headed HH (binary) -0.9771629 (0.001) Proportion of female headed household* Has off-farm income (binary) 0.324617 (0.027) Proportion of households not solely dependent on agriculture* Has hired labor (binary) 0.0038905 (0) Proportion on household who hired labor* Access to advise from the extension service (binary) 0.0038905 (0) 0.390598 (0) Proportion of household with access to extension service* access to credit (binary) 0.3168265 (0.008) Proportion of households with access to credit services* time to market -0.108154 (0.01) Travel time** time to market sq 0.0017995 (0.041) distance to market 0.723262 (0.001) Distance to town with more 10 000 inhabitant ** distance to market squared -0.0015395 (0.023) Constant 0.5559211 (0.036) 0.088009 (0.586) -4.648007 (0) Observations 683 724 814 R-squared 0.1073 0.096 0.1111 Condition slope>0 erosion>0 at least one flat plot
  8. Rainwater management strategies • Rainwater management practices to be combined

    into Rainwater Management Strategies at landscape scale Overall aim: sustainably increase the system’s productivity Trade-offs / synergies At different spatial and temporal scale
  9. Blue Nile strategies On the basis of the experiences from

    the GIZ/SLM program, we identified a number of “best-bet” practices; currently being promoted Zone\Land use Main objective (examples) Cropland Grassland Degraded land Uplands Increase infiltration (Agro-forestry, orchards and multipurpose trees) Increase the quantity and quality of fodder for livestock (Over-sowing, limiting animal movements) Rehabilitate degraded land (Forestry, gully rehabilitation) Midlands Control erosion, maintain soil moisture (Soil and water conservation, Conservation agriculture) Lowlands More efficient use of surface or shallow groundwater (Wells, river diversion)
  10. Blue Nile strategies Strategy quantification (C) Suitability / feasibility map

    practice I Suitability / feasibility map practice II Suitability / feasibility map practice III Rainwater management strategy map (D) Landscape delineation layer (A) Targets practice I Zonal statistics (B) Targets practice II Targets practice III Nile Tool  per watershed: “most likely to be adopted” strategy
  11. Impact Assessment Assess the impacts: - For different stakeholders -

    At different spatial and temporal scales (e.g. downstream effects) - In terms of different metrics: yield increases, economic returns, food security and income, environmental sustainability, social and cultural acceptability.
  12. Prioritizing rainwater management strategies in the Blue Nile basin… Multi-stage

    process Diagnosis Alternative options Characterisation of the options Targeting / out-scaling (ex-ante) Impact assessment
  13. Mapping Maasai bomas… • Uses eCognition software to identify settlements

    from 2.5m resolution SPOT 5 satellite images taken in the Mara. • Uses object based image analysis, following a two step process: – 1) Identifying livestock enclosure (boma) through presence of dung – 2) Identifying iron-roofed surrounding houses Settlement as seen from 2.5m SPOT 5 image Zipporah Musyimi, Claire Bedelian, Jan de Leeuw - ILRI/ICRAF Illustration of how the image is segmented for the extraction of settlements 748000 748000 748500 748500 9865250 9865250 9865500 9865500 9865750 9865750 748000 748500 749000 9865250 9865250 9865500 9865500 (a) (b) (c) A subsect of the classific Le Livestock bomas are identified in red and surrounding houses in blue. Those circled show no surrounding houses
  14. Application: • To assess how conservation interventions in the Mara

    are impacting the distribution and density of Maasai bomas. • Potential to develop more reliable population estimates for both human and livestock populations in pastoral areas. • Potential of higher resolution images to discern increasing social and ecological data concerning pastoral settlements. – E.g. Comparison of the same settlement as seen in a) GeoEye 0.5m image and b) SPOT 2.5m image (a) (b) Mapping Maasai settlements inside and outside of ‘wildlife conservancies’ in the Mara Mapping Maasai bomas…
  15. Ecology of pigs • Movement patterns of free ranging livestock

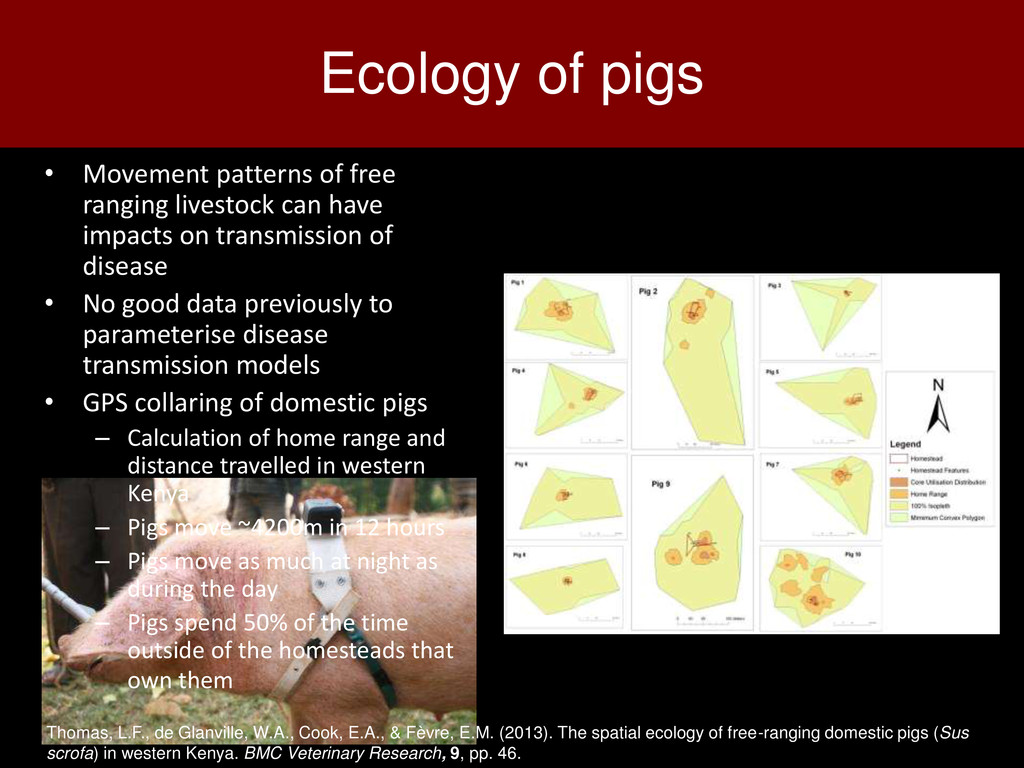
    can have impacts on transmission of disease • No good data previously to parameterise disease transmission models • GPS collaring of domestic pigs – Calculation of home range and distance travelled in western Kenya – Pigs move ~4200m in 12 hours – Pigs move as much at night as during the day – Pigs spend 50% of the time outside of the homesteads that own them Thomas, L.F., de Glanville, W.A., Cook, E.A., & Fèvre, E.M. (2013). The spatial ecology of free-ranging domestic pigs (Sus scrofa) in western Kenya. BMC Veterinary Research, 9, pp. 46.
  16. Mapping of Poverty and Likely Zoonoses Hotspots • A new

    global study mapping human-animal diseases like tuberculosis (TB) and Rift Valley fever finds that an “unlucky” 13 zoonoses are responsible for 2.4 billion cases of human illness and 2.2 million deaths per year. The vast majority occur in low- and middle-income countries. • Study was based on analysis of 1,000 surveys covering more than 10 million people, 6 million animals and 6,000 food or environment samples. • Resulted in maps showing prevalence based on serology and locations of occurrence against a background of farming systems. • The study received wide media coverage and opportunities for collaboration with other institutions.