Upgrade to Pro — share decks privately, control downloads, hide ads and more …

End to End Observability for Fun and Profit

End to End Observability for Fun and Profit

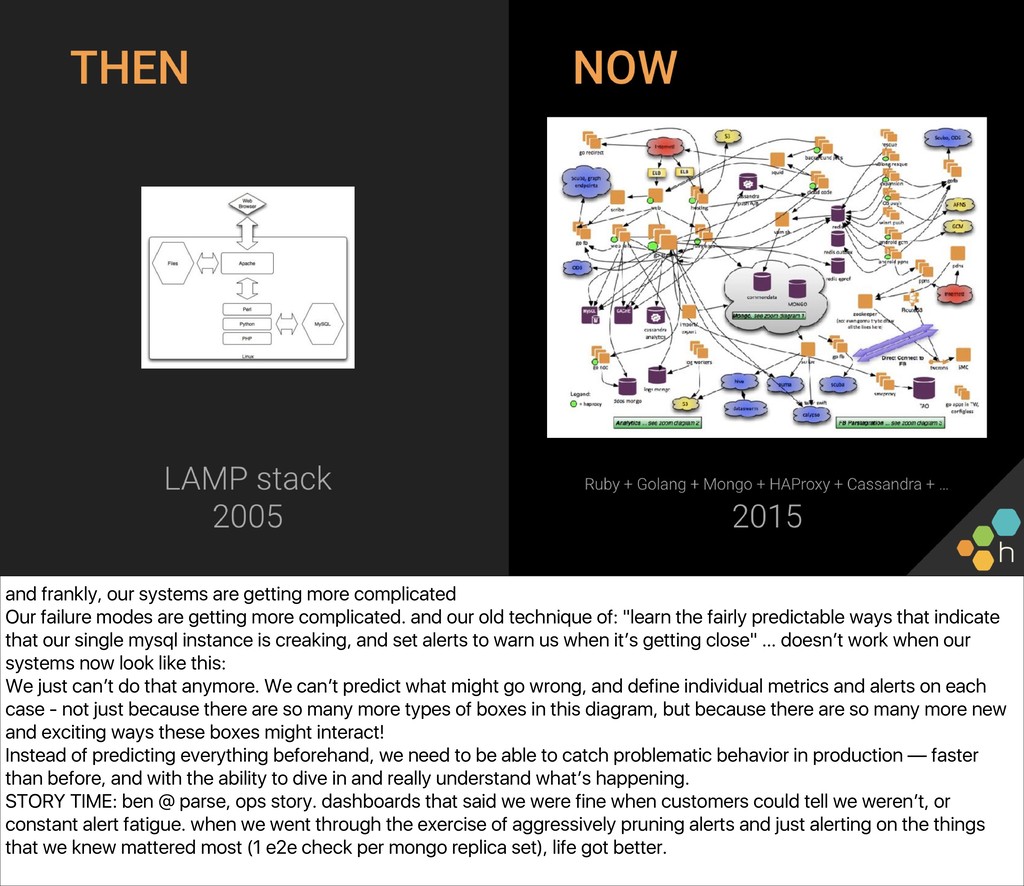
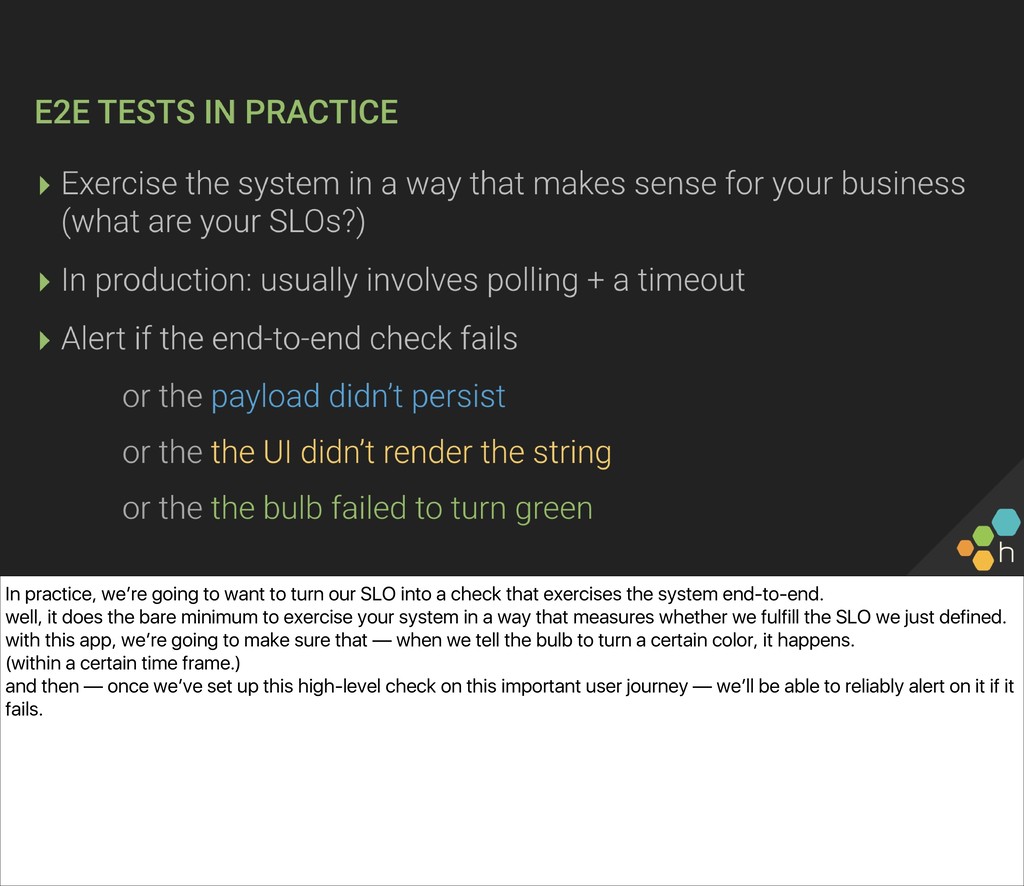
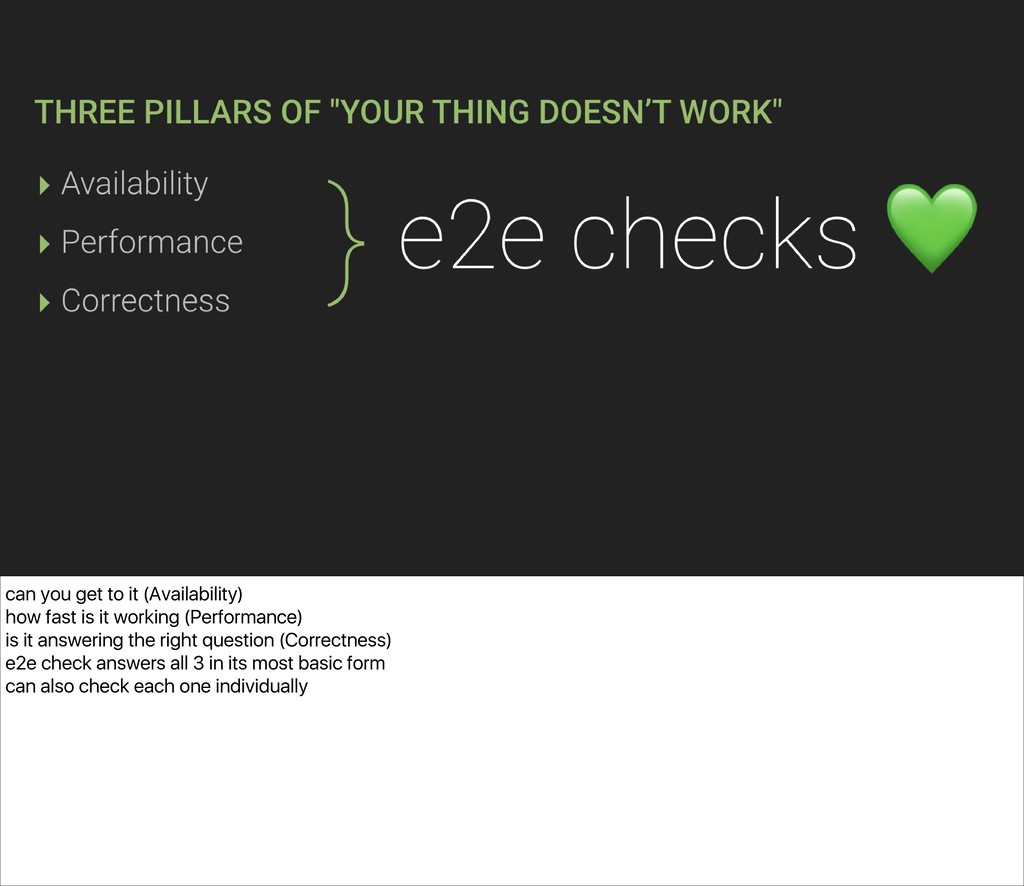
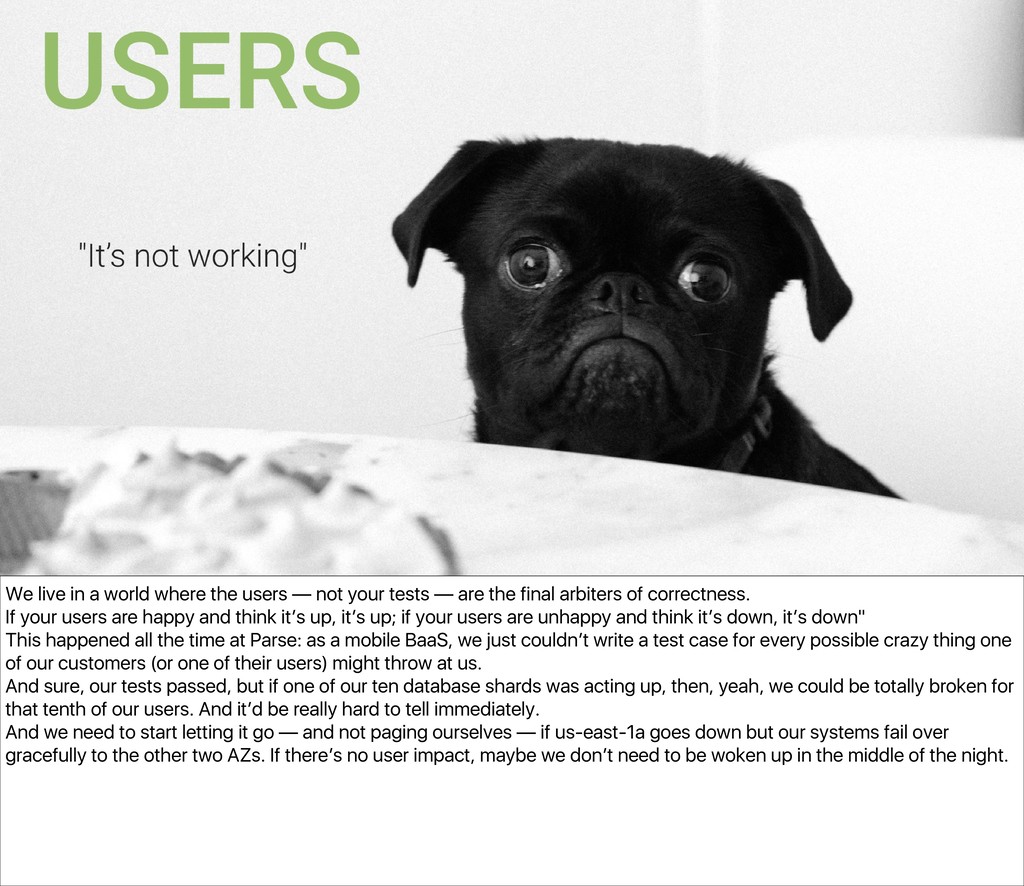
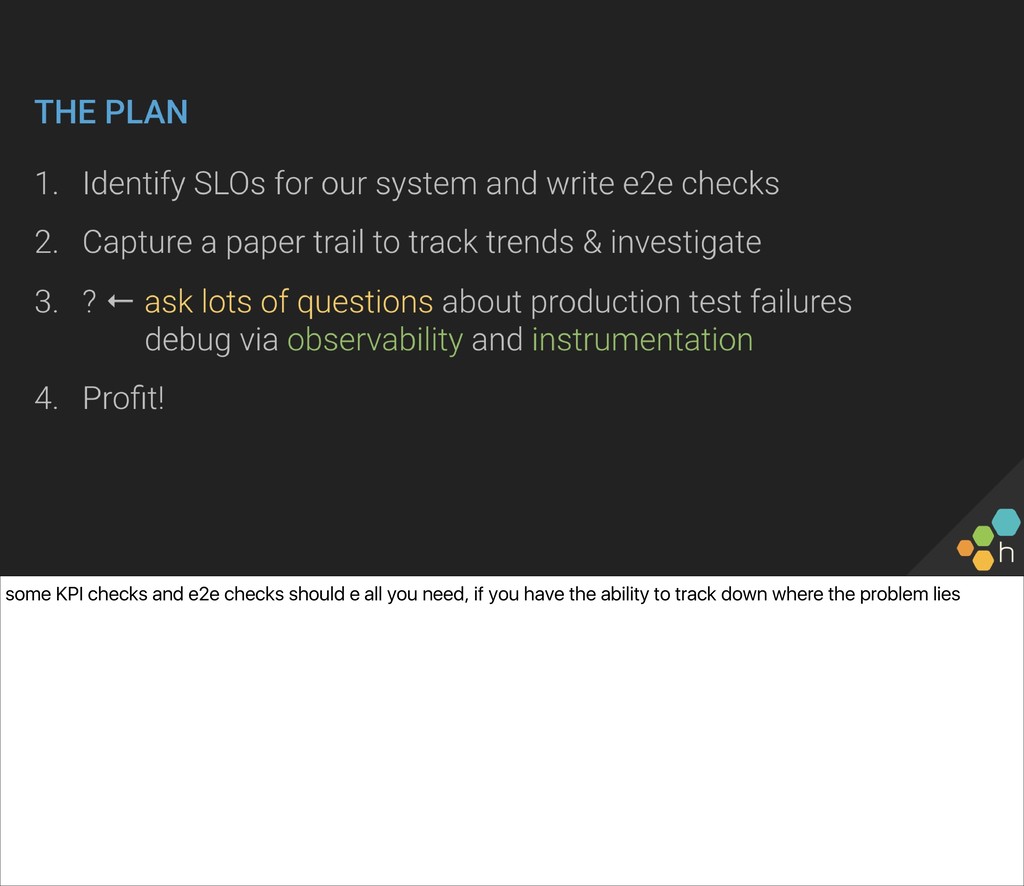
What does “uptime” really mean for your system? An end-to-end (e2e) check is where the rubber hits the road for your user experience and is the operator’s best tool for measuring uptime as experienced by your users. Creating and evolving e2e checks also establishes a basis for defining the SLOs and SLIs that we are willing to support.

Ben Hartshorne and Christine Yen explore what it means for a system to be “up” by explaining what makes a good end-to-end (e2e) check and what techniques are valuable when thinking about them. Along the way, you’ll learn how to write and evolve an e2e check against a common API.

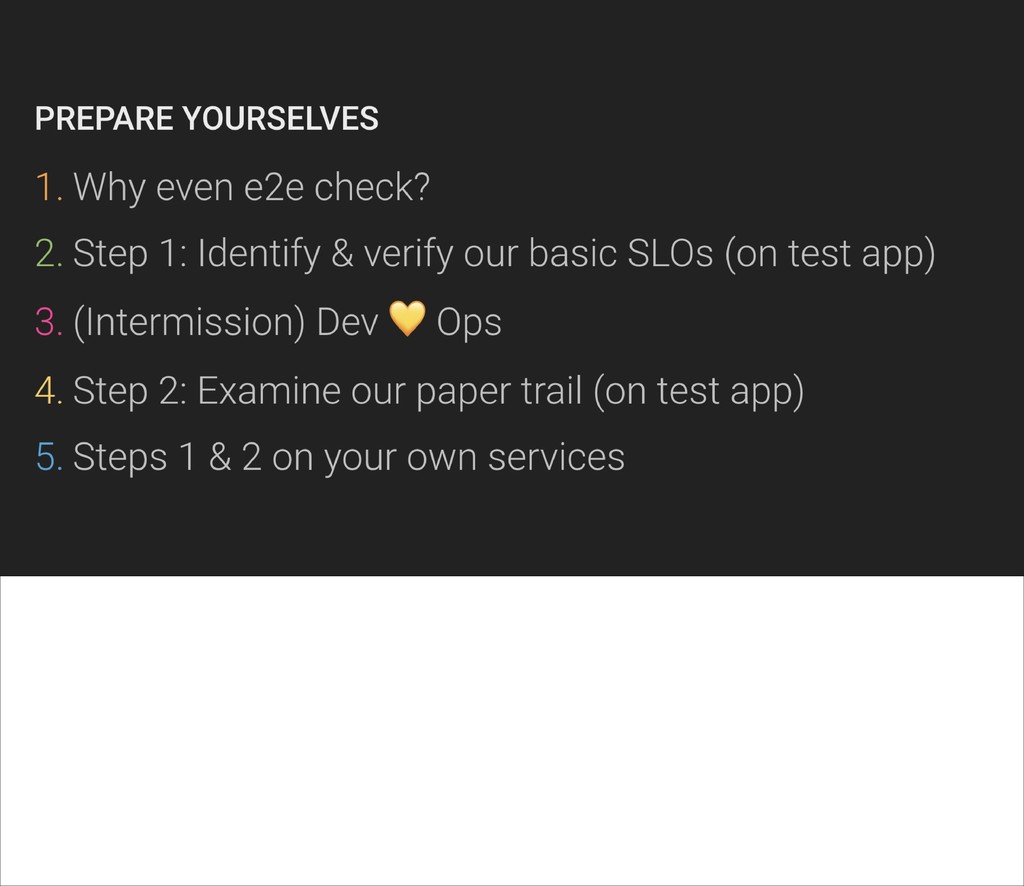
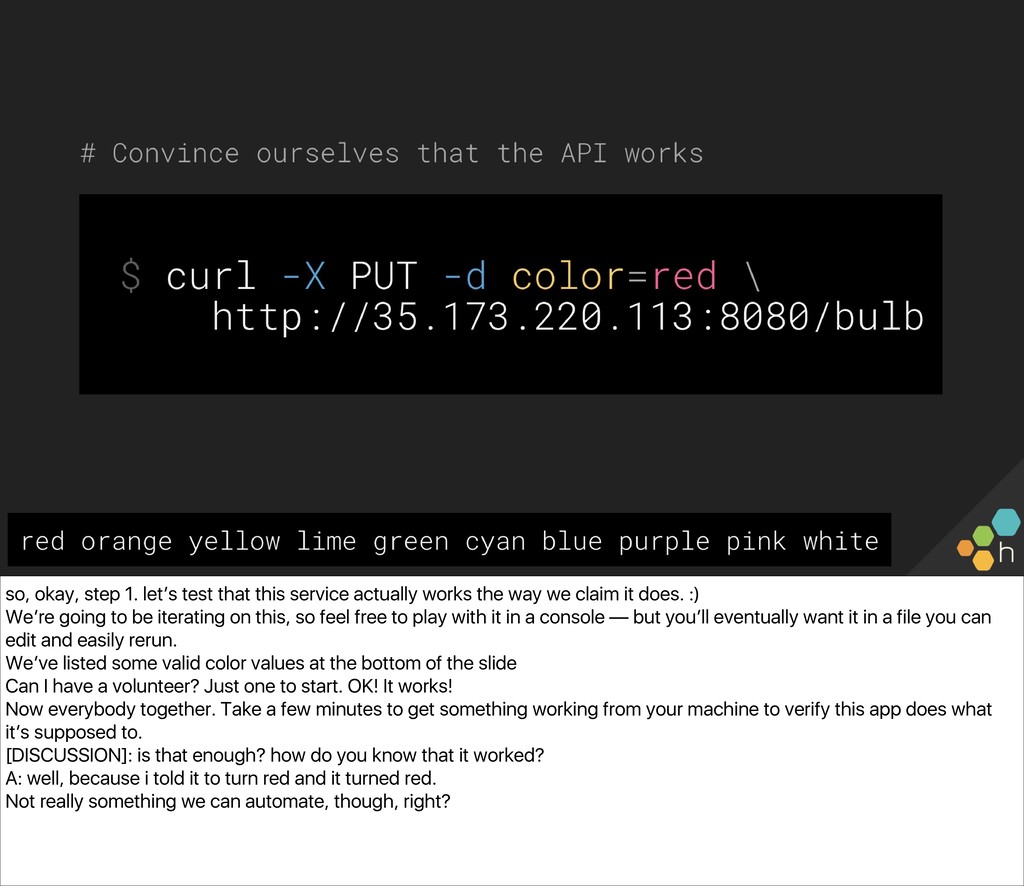
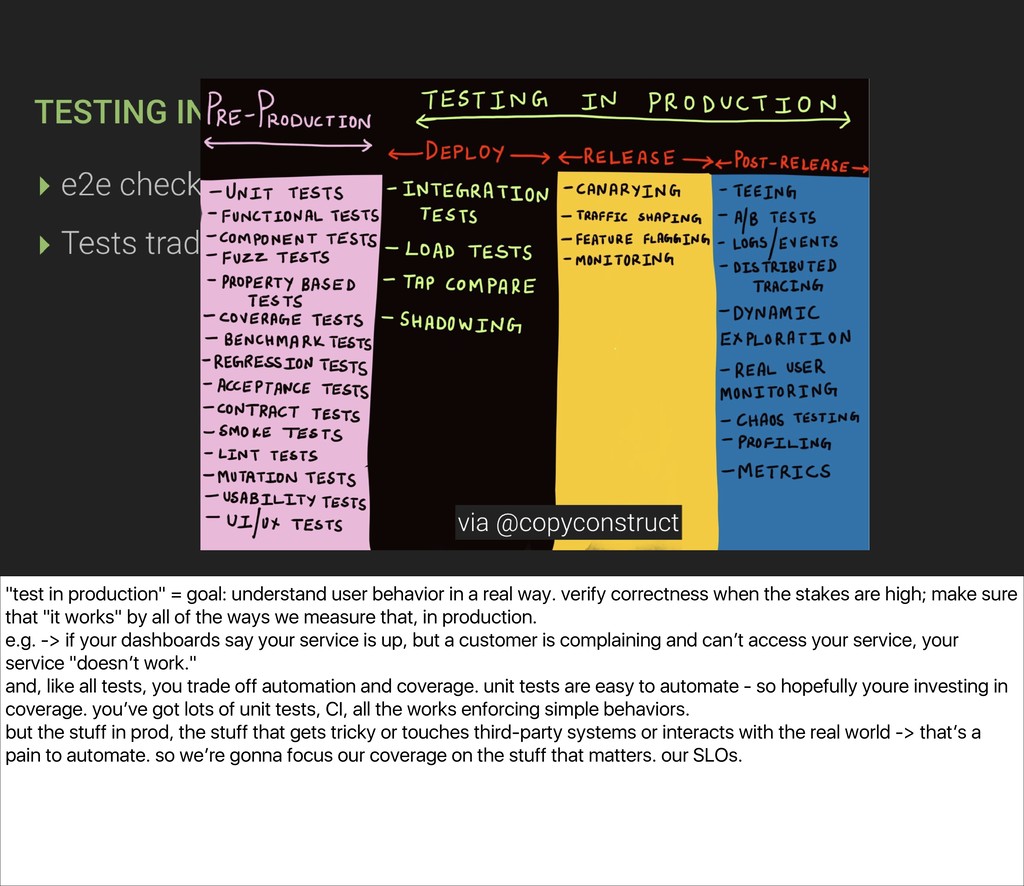
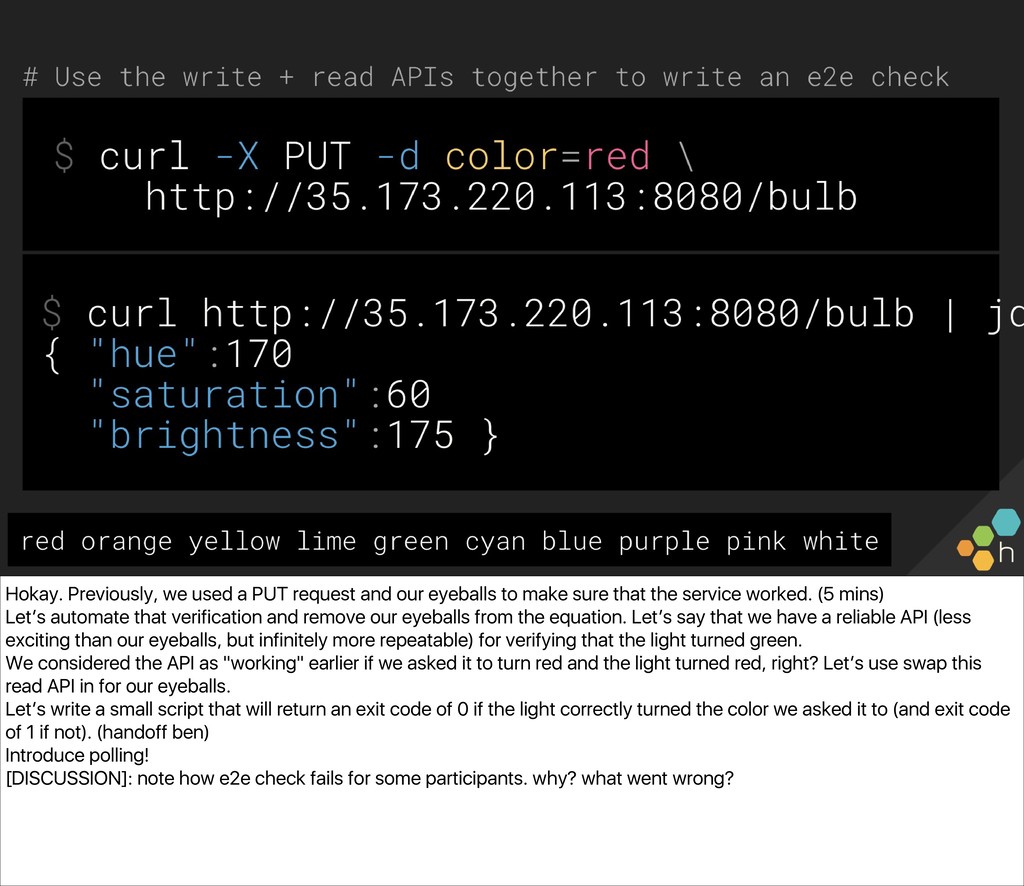
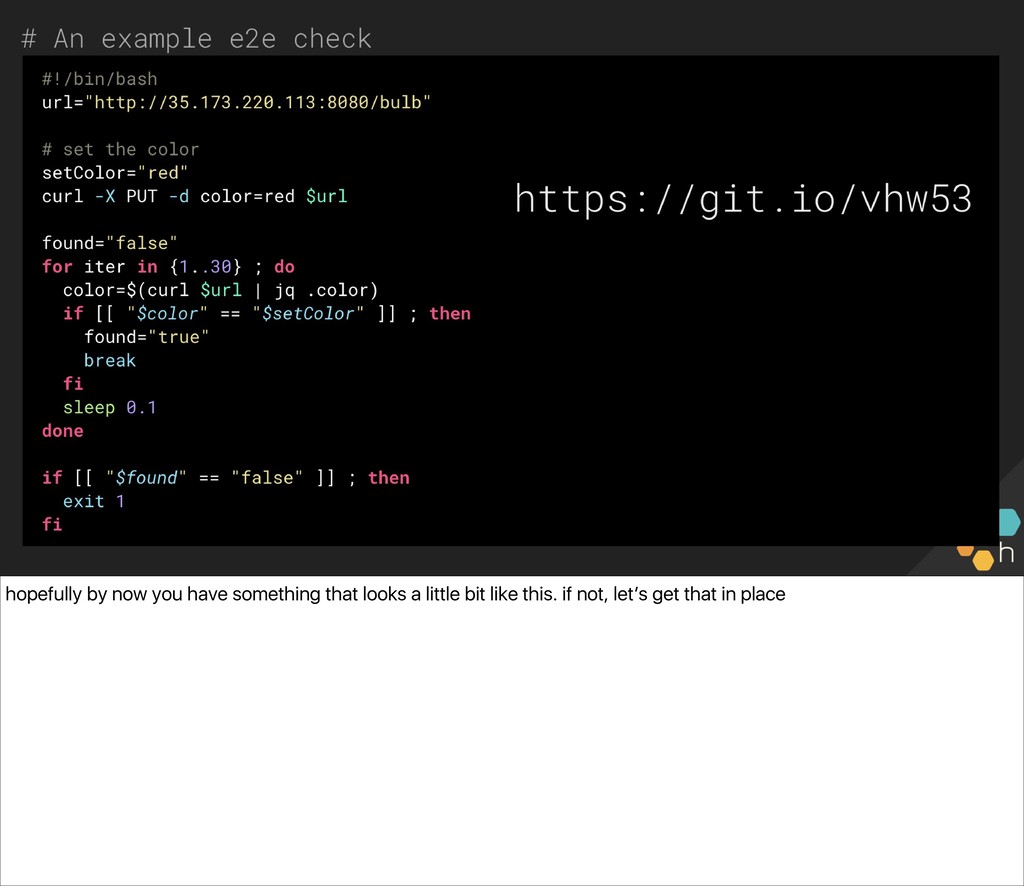
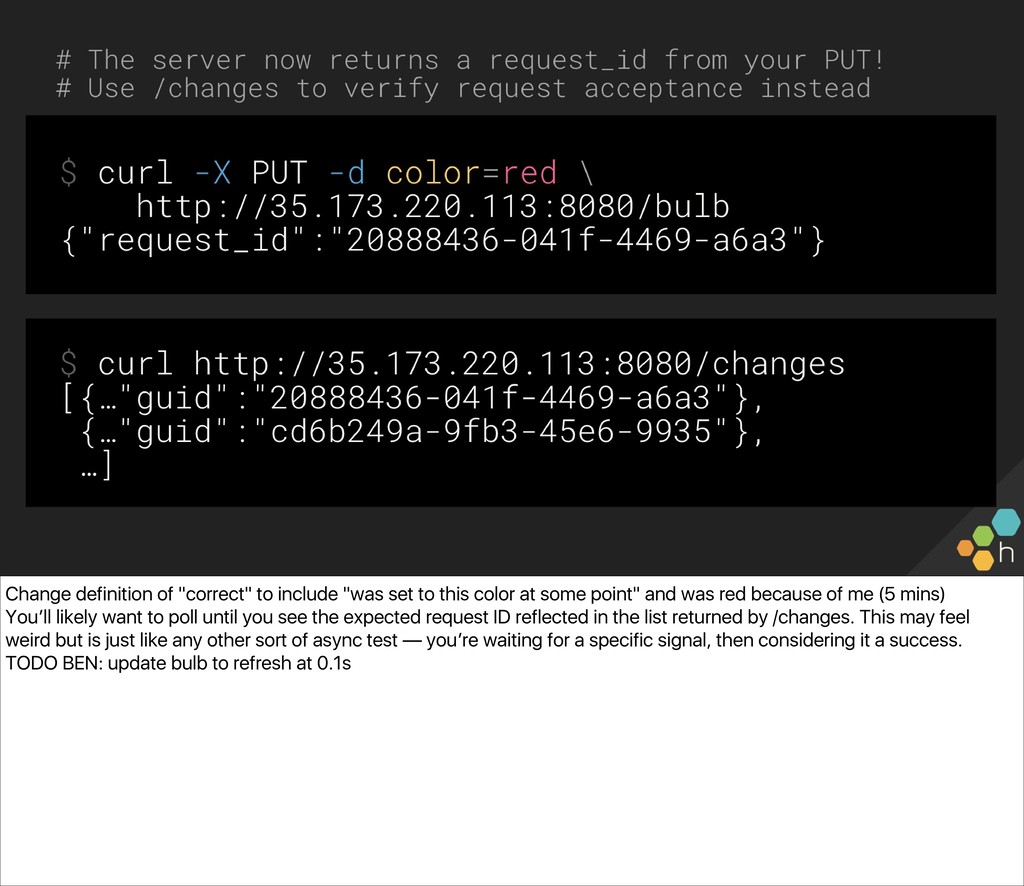
The class will write one together against a common API we can all access (a small server driving a Philips Hue bulb in the front of the room), and use the simple lightbulb server as a touchpoint from which to gauge the “correctness” of the system. You’ll also write an e2e check for the server, in whichever language and environment you prefer. Ben and Christine then explore capturing, visualizing, and alerting on results (e.g., What’s useful to capture? What metadata should we have along the way? What existing paging alerts are obsoleted by an effective e2e check?) and unveil a new, extended version of the lightbulb server, with multiple light bulbs representing a sharded backend. You’ll update your e2e checks for the more complicated architecture before exploring some real-world trade-offs of e2e checks.

Christine Yen

June 12, 2018
Tweet

More Decks by Christine Yen

Other Decks in Technology

Transcript

  1. Today we're going to be talking about the next step

    past unit tests, functional tests, and integration tests: instead of just making sure that your code works on your own machine or on CI, making sure that your code works (and keeps working!) in production. We'll write a simple production test against an app that we all have access to, then alternately introduce more complexity along the way and talk through the whys and hows our tests have to change to check this more complex behavior.
  2. and we’ll do that from two different perspectives. ben intro

    - ops turned eng christine intro - dev turned owner we’ve worked together at a couple places now: right now, we’re both at Honeycomb, an observability platform for debugging production systems; previously, we worked together at Parse, a mobile backend-as-a-service bought by Facebook.
  3. ok, we’re going to do an exercise. who… got paged

    at least once the last time they were on call? who… got paged twice? five times? ten? As an industry, we’re all paging ourselves too much. our various metrics/monitoring tools are getting better and better at… sending us more alerts, faster and more realtime!, on more symptoms — which means we often have none or 90 alerts telling us that us-east-1 is unreachable for a few minutes.
  4. and frankly, our systems are getting more complicated Our failure

    modes are getting more complicated. and our old technique of: "learn the fairly predictable ways that indicate that our single mysql instance is creaking, and set alerts to warn us when it’s getting close" … doesn’t work when our systems now look like this: We just can’t do that anymore. We can’t predict what might go wrong, and define individual metrics and alerts on each case - not just because there are so many more types of boxes in this diagram, but because there are so many more new and exciting ways these boxes might interact! Instead of predicting everything beforehand, we need to be able to catch problematic behavior in production — faster than before, and with the ability to dive in and really understand what’s happening. STORY TIME: ben @ parse, ops story. dashboards that said we were fine when customers could tell we weren’t, or constant alert fatigue. when we went through the exercise of aggressively pruning alerts and just alerting on the things that we knew mattered most (1 e2e check per mongo replica set), life got better.
  5. Essentially, we went through the process of figuring out our

    core SLO (Service-Level Objective: what should the user absolutely be able to do?) added end-to-end checks that exercised that. What is an SLO? An Objective, or a goal, involving a measurement indicating the health of your service. Parse: was writing + reading back an object within a certain amount of time. Honeycomb, writing + reading back an event. What’s yours? What is a user journey that is common enough and high-value enough to be worth getting out of bed for? Think about this. we’ll come back to it.
  6. In this workshop, as our subject, we're going to work

    with an app that controls this Hue light. The app serves a single purpose: letting its users change the color of the light. We’ll start off by defining the SLO as… when i tell the light to turn a certain color, it turns that color.
  7. In practice, we’re going to want to turn our SLO

    into a check that exercises the system end-to-end. well, it does the bare minimum to exercise your system in a way that measures whether we fulfill the SLO we just defined. with this app, we’re going to make sure that — when we tell the bulb to turn a certain color, it happens. (within a certain time frame.) and then — once we’ve set up this high-level check on this important user journey — we’ll be able to reliably alert on it if it fails.
  8. so, okay, step 1. let’s test that this service actually

    works the way we claim it does. :) We’re going to be iterating on this, so feel free to play with it in a console — but you’ll eventually want it in a file you can edit and easily rerun. We’ve listed some valid color values at the bottom of the slide Can I have a volunteer? Just one to start. OK! It works! Now everybody together. Take a few minutes to get something working from your machine to verify this app does what it’s supposed to. [DISCUSSION]: is that enough? how do you know that it worked? A: well, because i told it to turn red and it turned red. Not really something we can automate, though, right?
  9. can you get to it (Availability) how fast is it

    working (Performance) is it answering the right question (Correctness) e2e check answers all 3 in its most basic form can also check each one individually
  10. "test in production" = goal: understand user behavior in a

    real way. verify correctness when the stakes are high; make sure that "it works" by all of the ways we measure that, in production. e.g. -> if your dashboards say your service is up, but a customer is complaining and can’t access your service, your service "doesn’t work." and, like all tests, you trade off automation and coverage. unit tests are easy to automate - so hopefully youre investing in coverage. you’ve got lots of unit tests, CI, all the works enforcing simple behaviors. but the stuff in prod, the stuff that gets tricky or touches third-party systems or interacts with the real world -> that’s a pain to automate. so we’re gonna focus our coverage on the stuff that matters. our SLOs.
  11. We live in a world where the users — not

    your tests — are the final arbiters of correctness. If your users are happy and think it’s up, it’s up; if your users are unhappy and think it’s down, it’s down" This happened all the time at Parse: as a mobile BaaS, we just couldn’t write a test case for every possible crazy thing one of our customers (or one of their users) might throw at us. And sure, our tests passed, but if one of our ten database shards was acting up, then, yeah, we could be totally broken for that tenth of our users. And it’d be really hard to tell immediately. And we need to start letting it go — and not paging ourselves — if us-east-1a goes down but our systems fail over gracefully to the other two AZs. If there’s no user impact, maybe we don’t need to be woken up in the middle of the night.
  12. Hokay. Previously, we used a PUT request and our eyeballs

    to make sure that the service worked. (5 mins) Let’s automate that verification and remove our eyeballs from the equation. Let’s say that we have a reliable API (less exciting than our eyeballs, but infinitely more repeatable) for verifying that the light turned green. We considered the API as "working" earlier if we asked it to turn red and the light turned red, right? Let’s use swap this read API in for our eyeballs. Let’s write a small script that will return an exit code of 0 if the light correctly turned the color we asked it to (and exit code of 1 if not). (handoff ben) Introduce polling! [DISCUSSION]: note how e2e check fails for some participants. why? what went wrong?
  13. hopefully by now you have something that looks a little

    bit like this. if not, let’s get that in place
  14. so… who still doesn’t quite believe that the service is

    correct? why? so let’s add two things: request_id, and a read API that matches the asynchronicity of this app.
  15. Change definition of "correct" to include "was set to this

    color at some point" and was red because of me (5 mins) You’ll likely want to poll until you see the expected request ID reflected in the list returned by /changes. This may feel weird but is just like any other sort of async test — you’re waiting for a specific signal, then considering it a success. TODO BEN: update bulb to refresh at 0.1s
  16. Verifying correctness from your users’ perspective. Not on symptoms. Define

    your SLOs to be the sorts of things that actually matter, and are worth getting out of bed for. And capturing these tests in some sort of automated e2e environment means that you experience what the user experiences, without having to wait for someone to be unhappy and write in. Remember these three things that impact a user complaining that "your service doesn’t work"? Align the incentives correctly and make the alerts match the thing worth complaining about.
  17. Relying on developer tests to ensure behavior at individual, isolated

    points within your system can miss connections between components. End to end checks are the gold standard for that reason
  18. There’s a certain class of problem that just can’t be

    replicated in a test environment: You can’t spin up a version of the national power grid; Facebook can’t duplicate production scale, chaos, and complexity in some testing cluster — so we all need to learn the skills necessary to triage and debug in the wild, rather than just in a controlled environment.
  19. So - we’ve changed the API pretty significantly here. the

    APIs that we have... we can't actually always guarantee correctness. They’re often written to get a job done, and often obfuscate the very things that we need to convince ourselves, as in our other tests, that really works. ben: "my version of an e2e check always relies on some involvement by the devs" this level of cooperation between the folks writing the e2e checks and the folks writing the application? this is awesome. this is ideal. this is something we’re doing to verify correctness for our users sometimes an understanding of how the code works is necessary to verify that it's working correctly the same way we rely on mocks and stubs to capture arguments rather than just looking at the HTTP return code and assuming everything worked so. you’re in control. how can we make this application more testable by our e2e checks?
  20. …. what’s better than just your e2e check failing? seeing

    trends and understanding what "not failing" looks like! instrumenting your e2e check and being able to visualize a bit more about what was happening when the e2e checks started failing! (show graphs — live! and if we don’t reach some cascading failure, have one in your back pocket from the past to show) E2e view of everything being normal then failing for a bit then coming back https://ui.honeycomb.io/kiwi/datasets/enhuify_e2e/result/sWvoEaBVZDG And at the same time Server side, one user slamming the system and causing everything to slow down https://ui.honeycomb.io/kiwi/datasets/enhuify/result/jZYzidpWMJH
  21. having a high-level, automated check on "is a user likely

    to see a problem" means you can alert on what matters and what’s visible to users, not… a potential, past, cause. ("observability" detour): in the monitoring world, it has been pretty common to identify a root cause associated once with a problem — oh, our MySQL master ran low on connections — and set an alert on it to warn us anytime that potential root cause is an issue again. monitoring is great for taking these potential problem spots, and watching them obsessively, just in case they recur. "known unknowns" but as our systems are getting more complicated, and as there are more and more things that could go wrong, we’ll go crazy chasing down and watching each potential cause. this is the time that it’s impt to remember to zoom out and think about the user’s perspective. there are a million things that could go wrong, we don’t know what they are. instead, we’re going to alert on what matters — what the user might see — and make sure we’re set up to dig into new problems that arise. "unknown unknowns"
  22. Observability is all about answering questions about your system using

    data, and that ability is as valuable for developers as it is for operators. We’re all in this great battle together against the unknown chaos of… real-world users, and concurrent requests, and unfortunate combinations of all sorts of things … and the only thing that matters, in the end, is whether — when you issue a request telling the light to turn green, that it turns green.
  23. Turns out we’ve instrumented our server this whole time, too.

    Let’s see what we can learn about what’s been going on with our system. (show graphs — live!)
  24. Hokay. We said evolves, right? Let’s take another look at

    this system. Let’s say we’ve grown to a point — our users are so active — that we need to scale horizontally as well as scaling up. Let’s introduce a sharded backend. Something that drives not one but two different bulbs, distributing the load based on the IP address of the request. Can you see how our e2e check and our instrumentation will have to evolve, again?
  25. The /changes endpoint works the same :) But supplying an

    override means that we can exercise specific paths. (5 mins) BEN STORY TIME: why is this valuable?
  26. If "observability" is the goal/strategy, then "instrumentation" is the tactic

    we use to get there. "Is my app doing the right work? Are all of the requests even going through?" Let’s get some visibility into the app. For this app, we know there’s something interesting around how requests are handled and these light-changes are processed — so let’s focus there. We’ll add some instrumentation around the queue processor (aka the place it’s doing the work.) And we’ll start off by capturing a few basic attributes about each request. Note that we’re very intentionally capturing metadata that is relevant to our business. I’m going to want to be able to pull graphs that show me things in terms of the attributes I care about!
  27. This "testing in production" concept - it’s part: literally, what

    are the tests we’re writing? How should they be written, what sort of behavior should be asserted on in this way? But it’s also going to be this ongoing, evolving thing that works hand-in-hand with the development and instrumentation of an application
  28. As systems change underneath us, the sorts of things we

    want to track to observe it… also change End-to-end checks provide us this way to assert on behavior from the user’s perspective And observability (as a strategy), and instrumentation (as a tactic), let us see into the application itself. Take as an example, Honeycomb’s API server. When we first wrote it, we threw in some basic high-level HTTP attributes as instrumentation on each request. Then, added a bunch of custom timers, then things about the go runtime, then a bunch of other custom attributes that just might come in handy later.
  29. i’m sorry for the terrible meme, i couldn’t help it.

    you remember the basic e2e graph we pulled earlier? we talked about contextual alerts, carrying enough info to tell you where to look. what if… your e2e check could not just report whether the check succeeded or failed, it could also capture and report things like -> this read request took this long to access the database, or this long to access the fraud service? STORY TIME: this is something we took advantage of when ingesting nginx logs at parse. turns out, nginx has a whole bunch of nifty tricks that let you enrich the logs with headers that are set in the application — headers tracking things like, time spent in the database, metadata server hit, etc. and these are great things to correlate.
  30. The /changes endpoint works the same :) But supplying an

    override means that we can exercise specific paths. (5 mins)
  31. let’s take that lovely working e2e check we had from

    earlier… and add some instrumentation along the way. (the gist contains a curl you can copy/paste without having to download a new binary.)
  32. These sorts of shard_override bits — think of them as

    code coverage for your production deployment. Let you ensure coverage of system internals that are intended to be load balanced and invisible to the user Real-world examples of this: Setting up e2e checks per Mongo replica set at Parse Setting up a check per Kafka partition at Honeycomb As a rule of thumb check each shard of a stateful service Treat stateless clusters as single entities (but record which one handled the request)
  33. This developer involvement in testing production — this empowering of

    anyone to answer questions about their systems using data — this is the future. We’re here today because this wall that folks think of, between "works on my machine" and "it’s over the wall now and in production," has to come down. We’re entering a world with containers and microservices and serverless systems, and there’s too much code in production for developers to not take ownership of what gets deployed. And this pattern of: write production tests for the things that matter, then use some observability tool to dig in to problems, is the only sustainable way through this period of evolution and mobility.
  34. some KPI checks and e2e checks should e all you

    need, if you have the ability to track down where the problem lies
  35. Devops https://unsplash.com/photos/9gz3wfHr65U "Users" Pug https://unsplash.com/photos/D44HIk-qsvI "Observe" Pit https://unsplash.com/photos/O5s_LF_sCPQ Tired Beagle

    https://unsplash.com/photos/25XAEbCCkJY "Inspect" Terrier https://unsplash.com/photos/B3Ua_38CwHk Scale https://unsplash.com/photos/jd0hS7Vhn_A Tell us about you https://unsplash.com/photos/qki7k8SxvtA TODO when the talk is over: disable the write key :) https://twitter.com/copyconstruct/status/961787530734534656