Upgrade to Pro — share decks privately, control downloads, hide ads and more …

Observability & the Development Process

Observability & the Development Process

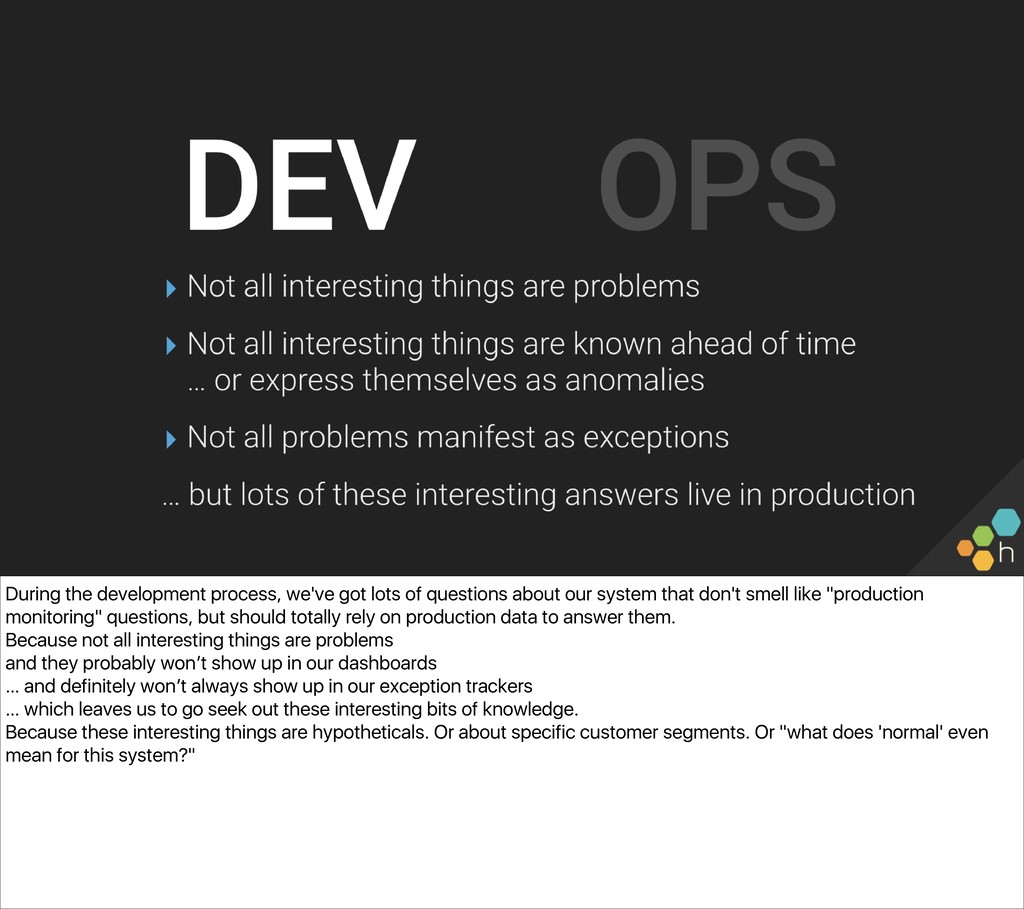
There’s been a lot of talk about software ownership—but what does “owning code in production” really mean for developers, day to day? Many development teams still reach for logs in production as the most familiar way to bridge the development environment with production.

This talk will make the case that observability—and the skills to craft the right graphs and read them—benefits developers more than it does operators by examining several instances where well-informed devs can supercharge their development process:

- Data-driven product decisions (or how to know more about what needs to be done than your PM)
- Rewrites and migrations
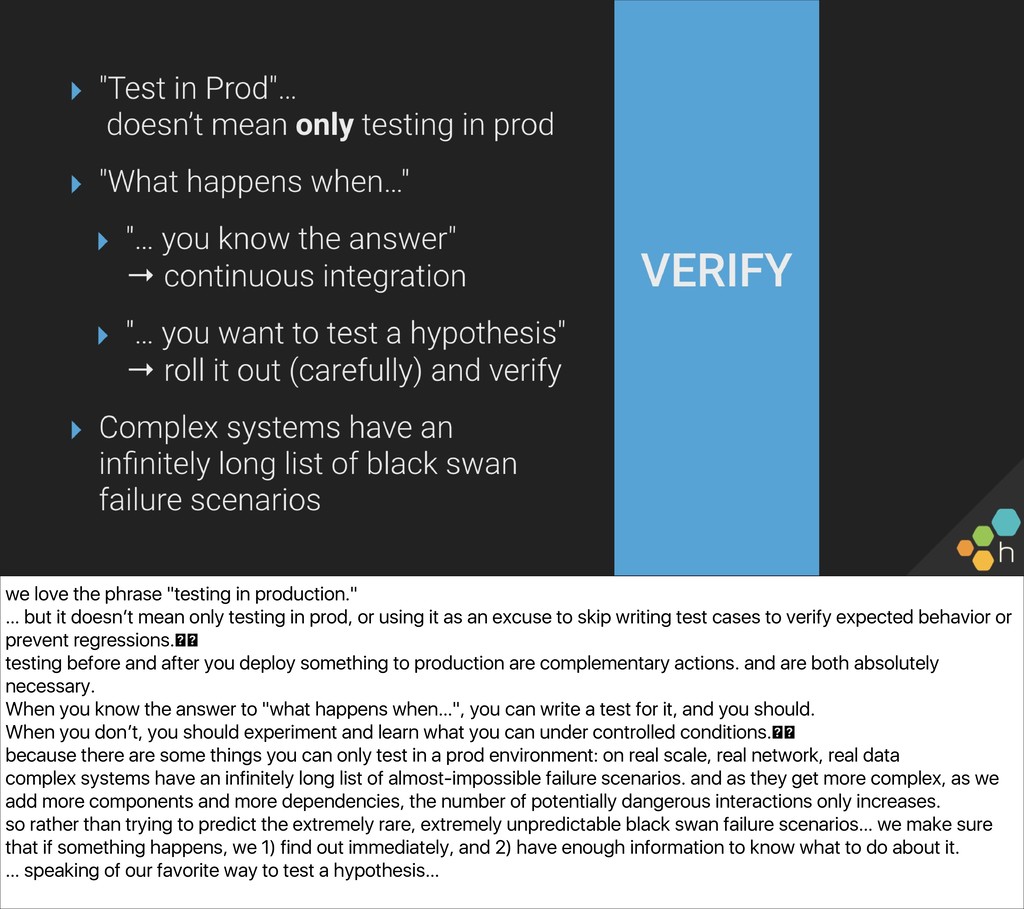
- Feature flags and “testing in production”
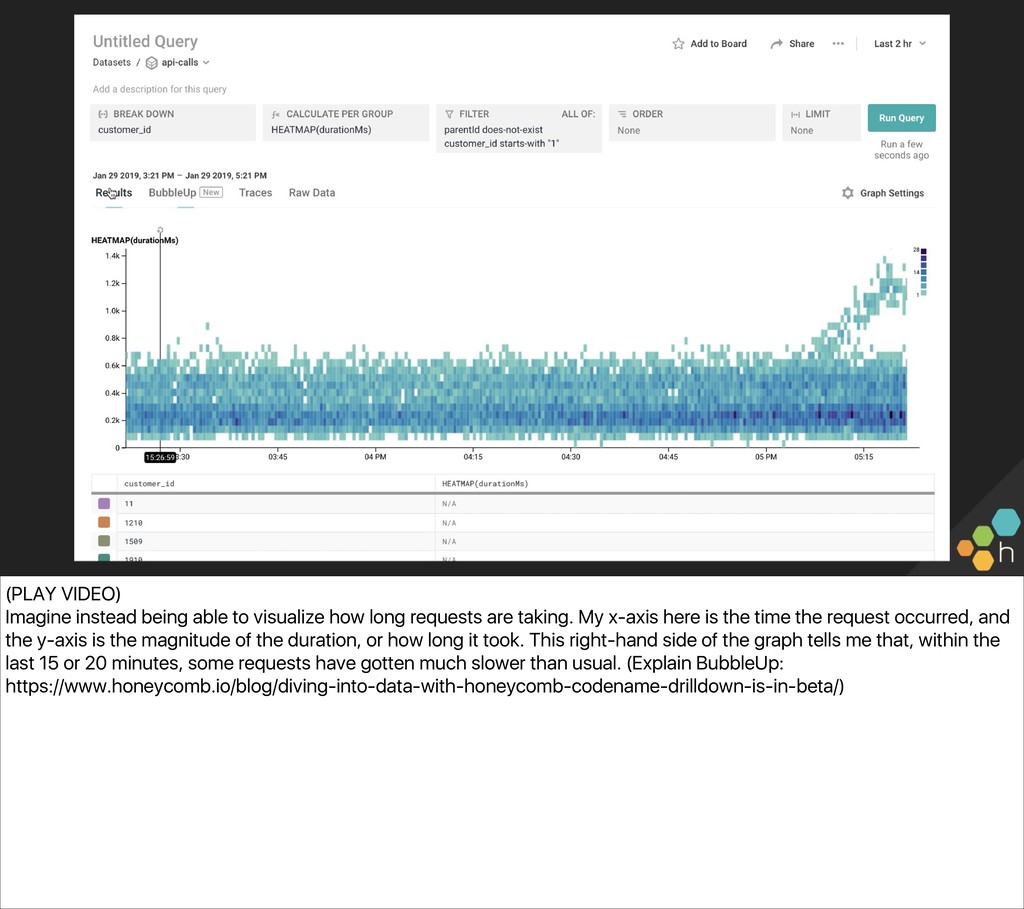
- Fine-grained performance analysis

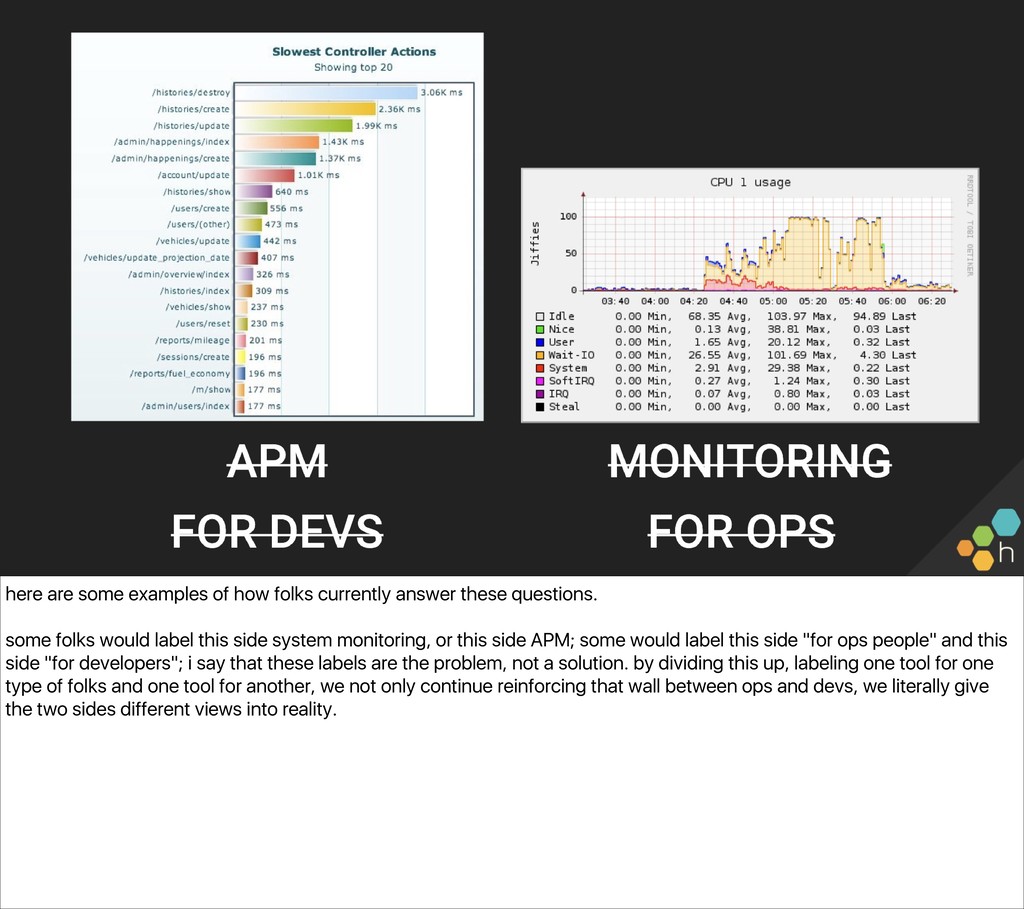
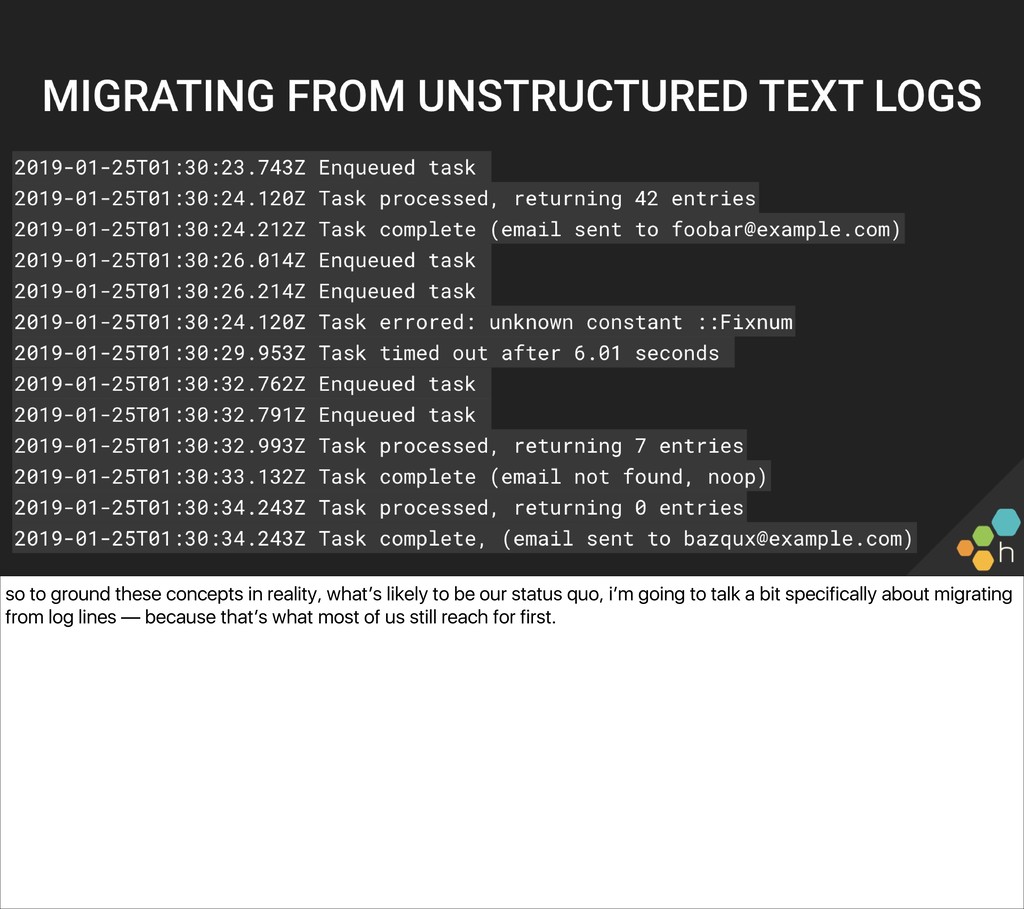
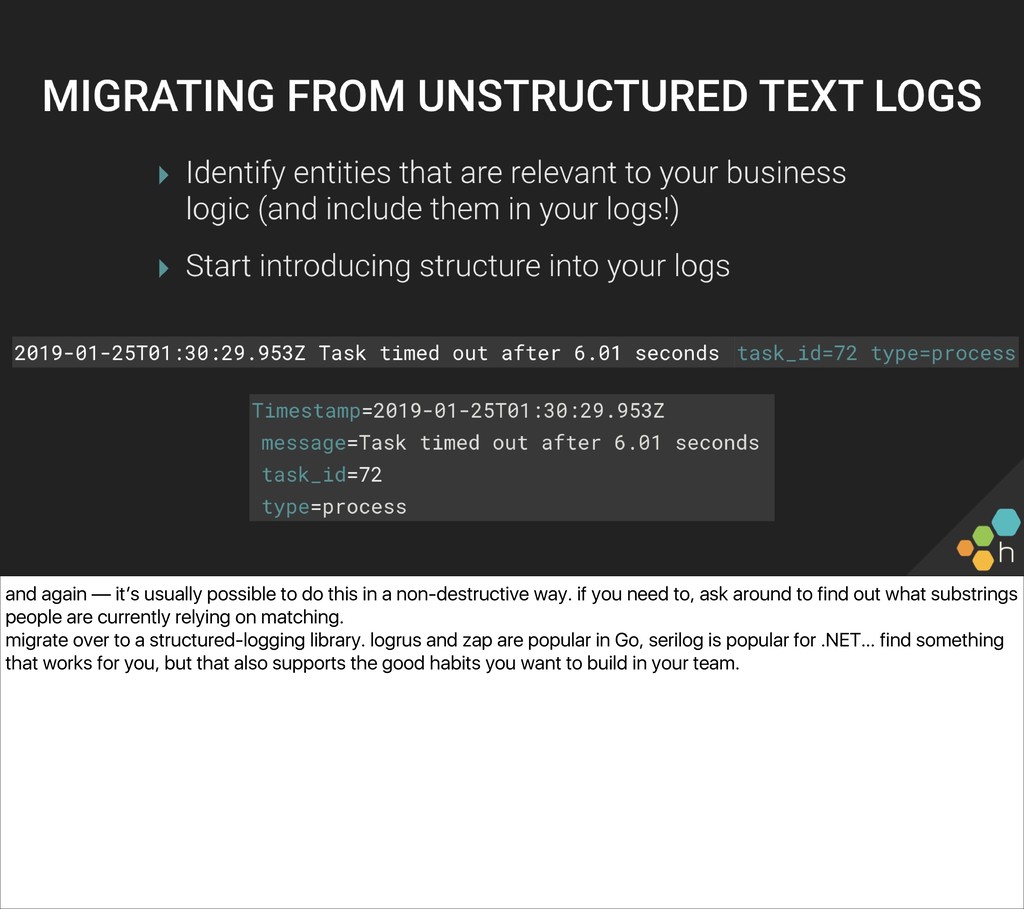
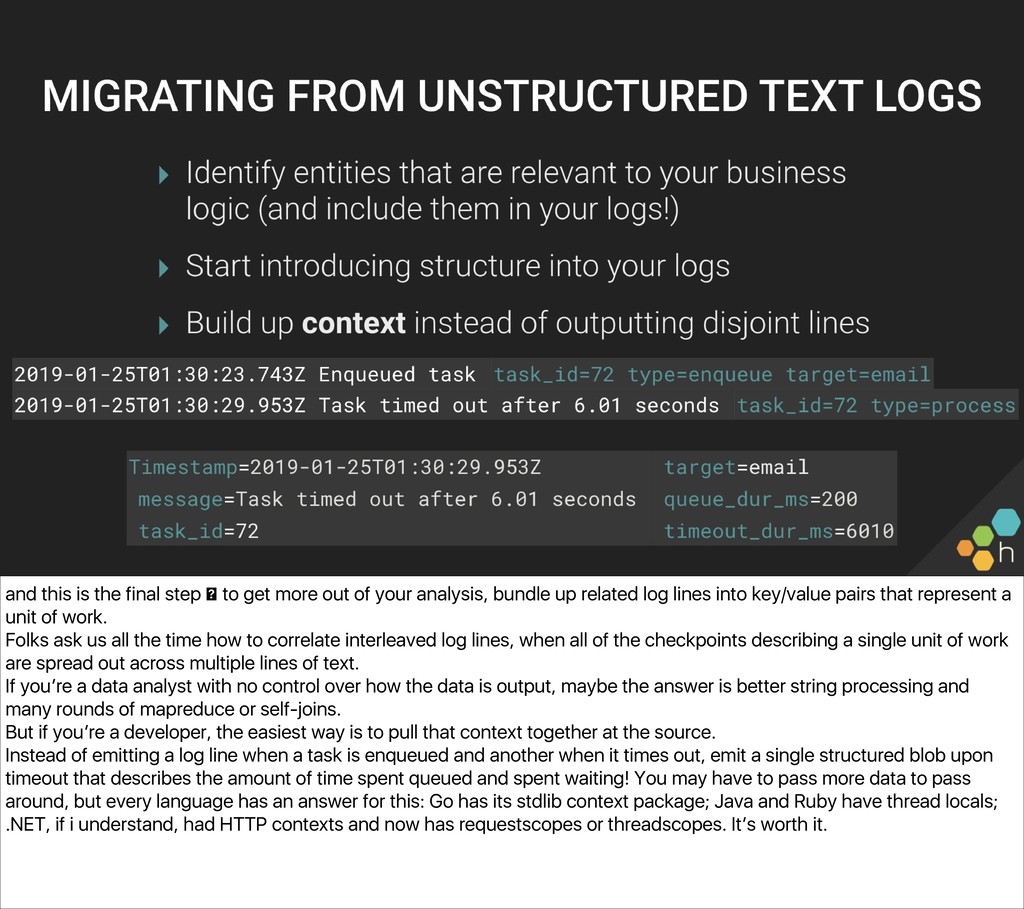
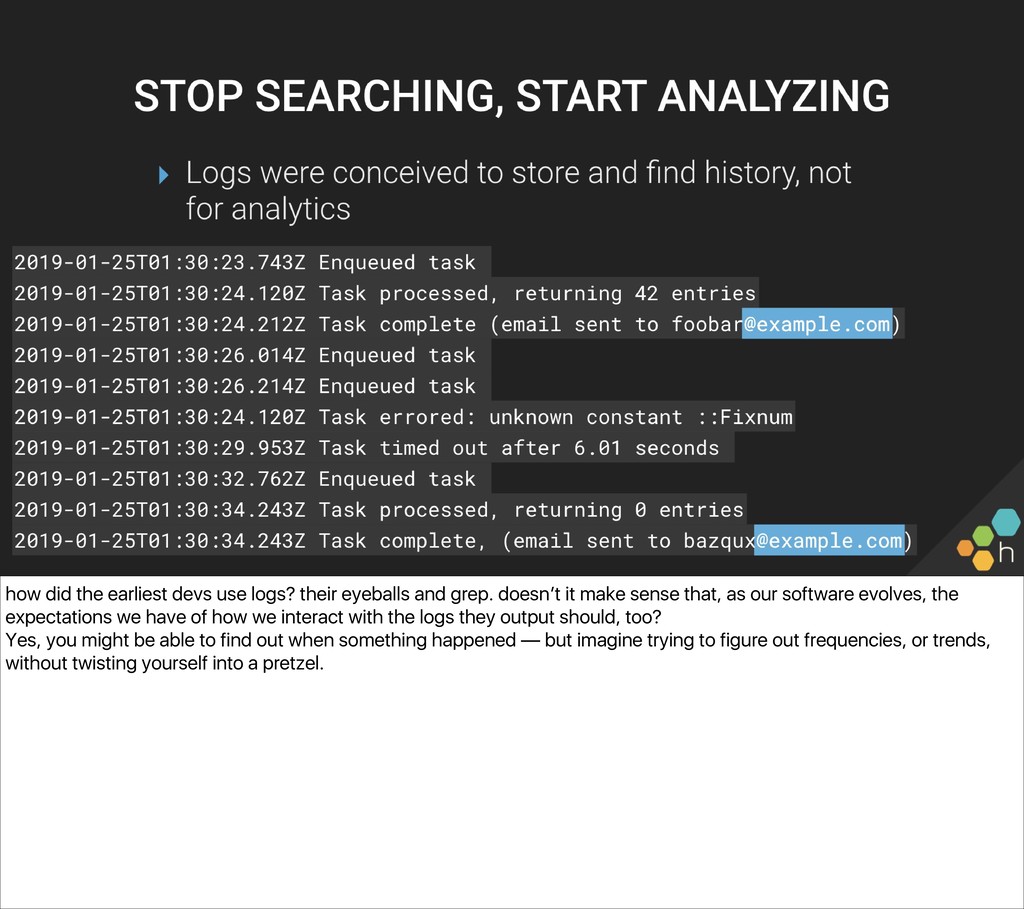
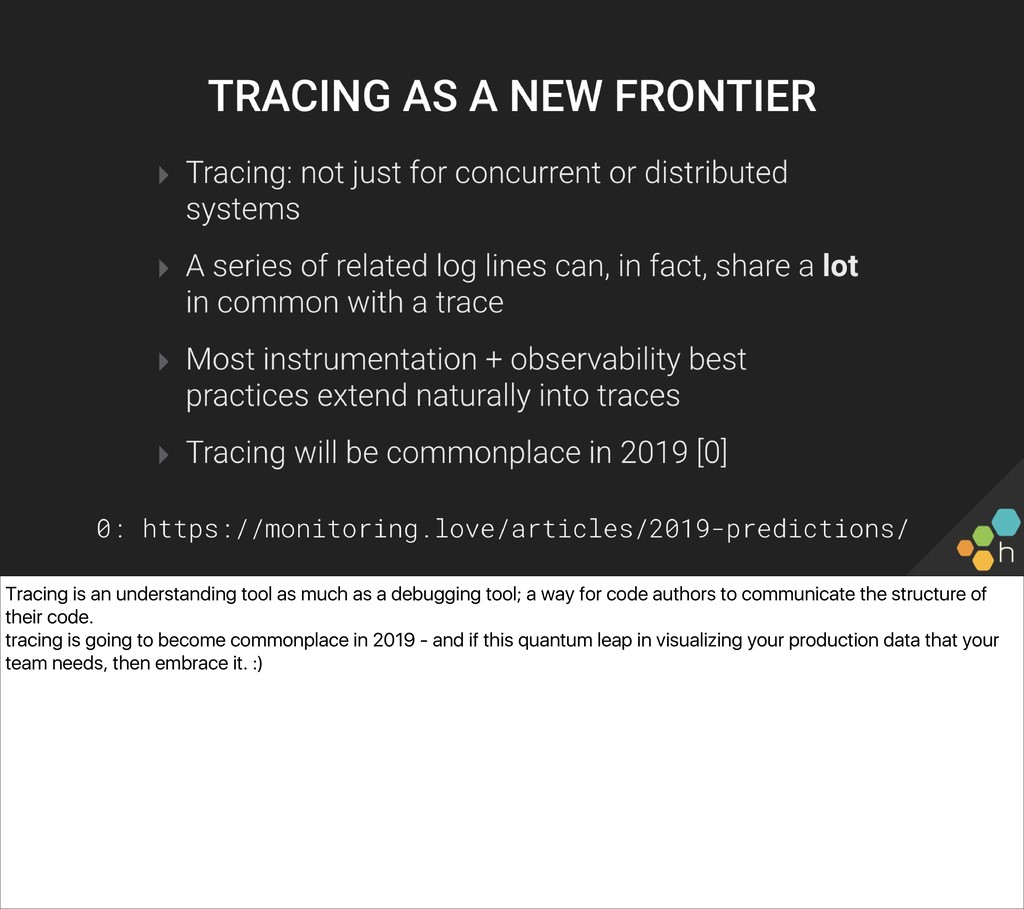
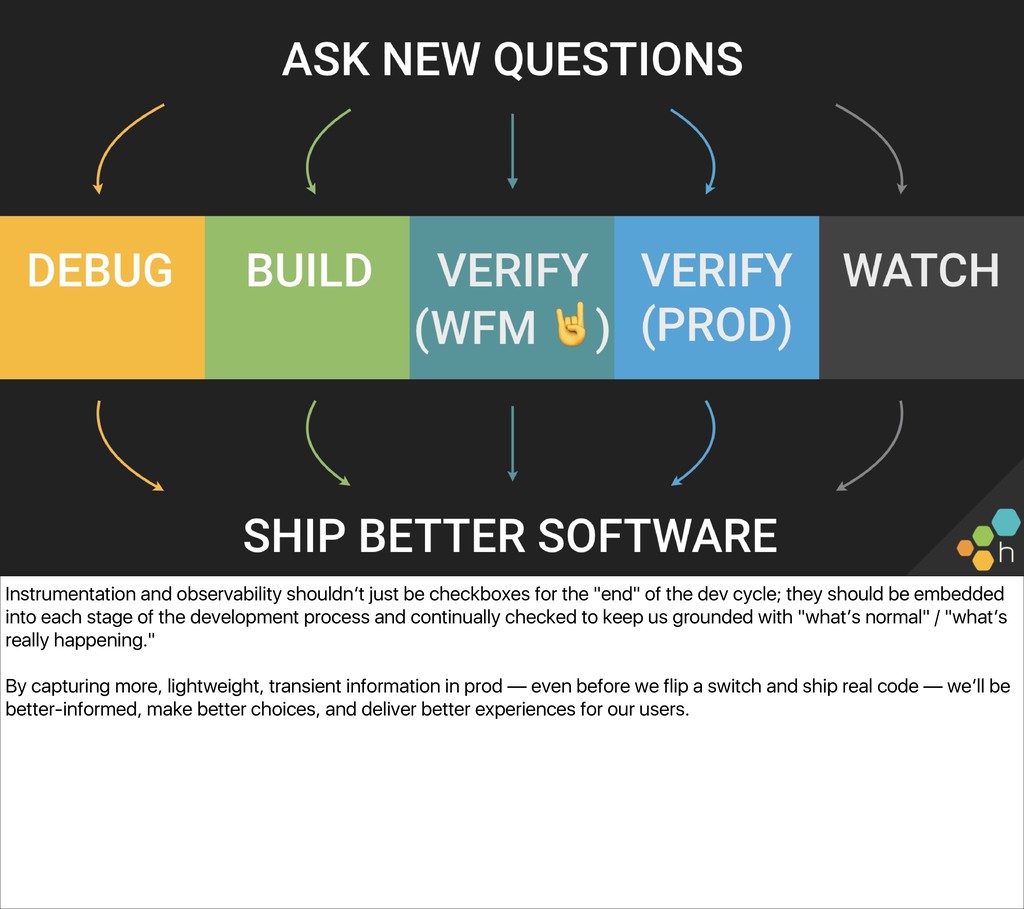
Then, we’ll lay out a series of steps to get your team from grepping unstructured text logs to outputting and analyzing well-structured traces. Instrumentation and observability aren’t all-or-nothing endeavors, and attendees should leave with an idea of “the next step” they can take to improve their ability to understand their production systems.

Christine Yen

January 30, 2019
Tweet

More Decks by Christine Yen

Other Decks in Technology

Transcript

  1. hi. thanks for coming to "observability and the development process!"

    today I’ll talk about how observability — a word associated with monitoring, with "over there in production-land" — is a mindset and a set of tools that can benefit us not just after, but before and during our software development process. i’m also a cofounder at honeycomb, which is focused on empowering engineering teams to understand their software in production. as a disclaimer - while i’ll be sharing some examples about how we dogfood to build honeycomb, the philosophies and techniques are generally applicable and should be transferrable to your existing tools.
  2. who am i? i’m christine :) and i’m a developer

    who delights in being in a room full of ops folks. and because i’m building a product focused on helping all engineers understand their production systems, i care a lot about bridging the gap between devs and ops with technological and cultural improvements.
  3. these days, software development is usually super customer-focused. there’s a

    whole suite of stuff we’re super diligent about… before we ship! at which point we celebrate!! … and then we forget about it.
  4. we forget about it, that is, until an ops person

    comes knocking on our door, grumpy and complaining about something breaking. which might make us respond like this. :) we all know folks, on either side, who talk like this. what happened to that diligence? that curiosity? that "oh, i should check these edge cases"? when we focus on the "us" vs "them" of this conflict, we get folks pointing fingers and hunkering down on their POV. but what brings us together, in the end, is this contract to the users of our service because more and more, we live in a world where the users — not your tests — are the final arbiters of correctness. this is what unifies us. so no matter what, we’re in this together, and need to start thinking from the perspective of users in production, instead.
  5. from the developers’ perspective, we can use data about how

    code is being run in production to really explore what our services are doing. and as a result, we can inform not only what features we build / bugs we fix, but also:
  6. During the development process, we've got lots of questions about

    our system that don't smell like "production monitoring" questions, but should totally rely on production data to answer them. Because not all interesting things are problems and they probably won’t show up in our dashboards … and definitely won’t always show up in our exception trackers … which leaves us to go seek out these interesting bits of knowledge. Because these interesting things are hypotheticals. Or about specific customer segments. Or "what does 'normal' even mean for this system?"
  7. Here are some questions that look an awful lot like

    standard questions for the ops side of the room… But if we frame these questions a little differently… to bring them a little bit closer to our world, the world of software development and branching logic
  8. … and once you start talking about customers, and their

    workloads, and how that might impact the customer experience… then devs start to care about the answers to these, too. Your nouns might be different. You might care about expensive Mongo queries, or high-value shopping carts, or the countries responsible for processing transactions. But the premise is the same — that the most painful problems to debug, or the most important edge cases to understand, often originate from that one outlier doing something unexpected, while the code expected something else. and these are problems that ops people often find, but devs have to help fix.
  9. here are some examples of how folks currently answer these

    questions. some folks would label this side system monitoring, or this side APM; some would label this side "for ops people" and this side "for developers"; i say that these labels are the problem, not a solution. by dividing this up, labeling one tool for one type of folks and one tool for another, we not only continue reinforcing that wall between ops and devs, we literally give the two sides different views into reality.
  10. and for the record, this is why i use the

    word observability. formally, it’s ____; informally, i think of it as ____.
  11. tools matter. the data we feed into those tools matter.

    and our tools for understanding prod can’t just talk in terms of CPU and memory and disk space, not if the ops folks want us—devs more likely to think in terms of build IDs and codepaths and customers—to use them too.
  12. We’re here today because this wall that folks think of—between

    "works on my machine" and "it’s over the wall now and in production"—has to come down. We’re entering a world with containers and microservices and serverless systems, and there’s too much code in production for developers to not take ownership of what gets deployed. the first wave of devops was about teaching ops people to code. teaching them to automate their workflows, to do more development. the second wave is going to have to be about teaching devs to get comfortable owning their code in production. and investing in observability—teaching and encouraging devs to look at prod, to poke at prod, to appreciate that what’s possible in prod isn’t so different from what’s possible in a dev environment—is how we get there.
  13. (THESIS): observability should be a core part of the development

    process. As the software is being built — not as it’s being evaluated for reliability, or right before it’s deployed — we need to be feeding useful information into each step of that process. As much as testing or documentation, understanding what our code does in production teaches us how to build better software. All the time. Observability isn’t just for finding out when things are broken or going wrong — it’s for understanding your software.
  14. let's go back to that slide of all the things

    that developers do and break them down into some more manageable steps those first three, before the code hits production. what informs each of these? is it just our fantastic developer intuition? do we have a PM feeding us instructions? ... i mean, the answer to both of those might be yes. but i sure hope we have some real data coming in as well! let’s take a look at some real-world examples of what using data in each of these stages of the development process might look like.
  15. This is the most boring case for me, because there’s

    really no shortage of people and software telling developers what needs to be fixed: alerts, exceptions, people on Twitter; they all help identify work that needs to be done. Data comes in to play, though, in refining that directive — when you’re going from a high-level "elevated latency" alert to "X part of your system is misbehaving under Y circumstances."
  16. when debugging issues locally… but in production … and there

    are certain things that can only be debugged or diagnosed in production, at scale. but the ideal case — when we have all of the information we need about what happened, and when—we essentially have the ability to replay the past. caveat: since most of us won’t start in the ideal case, our tools should make it easy to add new pieces of metadata when we need it.
  17. customer issue! (hypothesis -> wonky timestamps = degraded query performance.)

    so we added a field to track the difference in time between the reported time from the customer’s servers and our own.
  18. this is an example of the sort of high-level analysis

    we were able to do: we were able to zoom in on this one customer’s data, then visualize how event_time_delta_sec was changing over time. (each line = AZ, variations look normal… but having the orange line represent ~2x the delay of the olive line was strange.) but we’ve done enough analysis to know that averages can lie to us, so …
  19. and by throwing in the 10th percentile and the median

    -> now, we just debugged something in production; we have a better understanding of why their data doesn’t seem to be queryable immediately — but instead of guessing at what the fix might be, pushing that fix, and waiting for the customer to give us the all-clear, we were able to go back to the customer with something super specific for them to look into
  20. Understanding the potential impact of a change we're making—especially something

    that'll have a direct, obvious impact on users—lets us bring data into the decisionmaking process. By learning about what "normal" is (or at least—what "reality" is), we can figure out whether our fix is actually a fix or not. i love this section because it turns the events our software emits…❇️ into DEBUG statements in your prod traffic, that you can use while you’ve got a local branch with an initial solution. By having a flow where it’s lightweight and natural for software engineers to add these diagnostic bits and suddenly be able to describe of the execution of your logic in the wild, we can make more informed decisions and deliver better experiences to our customers.❇️ tie back to PMs: they make decisions based on qualitative interviews and grand intuition… but we’re developers with access to prod. ὠ We can make arguments based on data.
  21. when we were first starting out, we sort of… hand-waved

    our rate limiting implementation by using an in-process cache, where each server kiiind of just approximated the rate limit individually. As our traffic grew, there was an unwanted correlation between which server a single request hit, and which customers were actually being rate limited. we needed to spin up a shared cache and clean up this tech debt — it was time for a centralized rate limiter that would be more accurate. ✳️ but instead of just blindly making the change, we wanted to be confident it’d actually behave correctly. while we perfected the logic and heuristics, we could start capturing data in prod to simulate the logic, to see what the steady-state behavior would be, without impacting customers. So alongside the logic in the API server that calculated a particular requests's rate limit, we added a bit that tracked whether or not a given request would have been rate limited by the new algorithm.
  22. And then we could visualize the glorious new hypothetical future

    We could see that - as expected - the new rate limiting algorithm was more strict in a number of places, especially around large spikes. but we now had enough information here to examine each case individually and assess whether the change was what we intended! and the ability to actually identify which customers would have been rate limited… allowed us to work with each customer to help them understand the change in behavior.
  23. testing is great and all, but how do we select

    our test cases? a lot of this tends to be "intuition," or guessing at edge cases that matter. why not use prod data to determine which test cases are worthwhile?
  24. it’s pretty nice to be able to go take a

    look at your prod data to ask, hey… across all of the payloads hitting our API, what’s the distribution of the number of columns within each payload? what are the edge cases we should make sure to handle? note: this right here... is why pre-production testing is never going to be enough. the test cases are determined by humans, and even though we're using "data in the wild" to inform those, who knows what crazy things will happen next week, next month, next year?
  25. testing on your machine is all well and good, but

    what do we do when we aren't quiiite sure about our change, or want to check its impact in some lightweight or temporary way?
  26. we love the phrase "testing in production." … but it

    doesn’t mean only testing in prod, or using it as an excuse to skip writing test cases to verify expected behavior or prevent regressions.❇️ testing before and after you deploy something to production are complementary actions. and are both absolutely necessary. When you know the answer to "what happens when…", you can write a test for it, and you should. When you don’t, you should experiment and learn what you can under controlled conditions.❇️ because there are some things you can only test in a prod environment: on real scale, real network, real data complex systems have an infinitely long list of almost-impossible failure scenarios. and as they get more complex, as we add more components and more dependencies, the number of potentially dangerous interactions only increases. so rather than trying to predict the extremely rare, extremely unpredictable black swan failure scenarios… we make sure that if something happens, we 1) find out immediately, and 2) have enough information to know what to do about it. … speaking of our favorite way to test a hypothesis…
  27. We love feature flags for letting us test in production

    while we're still making sure the change is one we're happy with shipping. Pairing feature flags with our observability tooling lets us get incredibly fine-grained visibility into our code's impact. Being able to get these arbitrary feature flags into our dogfood cluster, means we can look at our normal top-level metrics, segmented by flags. This becomes incredibly powerful when we do things like test out code on a very small amount of traffic, while still retaining the ability to slice by hostname, customer, whatever.
  28. The best part about this approach is it means your

    developers can define these ephemeral, specific segments of your data freely to answer these sorts of... ephemeral questions that pop up during development. At this point, we actually send all live feature flags and their values along with all payloads to our storage engine dataset, so that as we observe future experiments, we don't have to stop first and remember to add the feature flag to a metric name or dashboard -- they're all just right there, mapped to the flags that we as software engineers are already thinking about.
  29. a lot of our feature flag use is for UX

    reasons, but also anytime we make changes to our storage layer -- these are hard to test locally (both because of scale and diversity of types of data). Awhile back, we were making changes to our string storage format. It was intended to make things more flexible but we wanted to make sure that it didn’t impact performance significantly. It was a twitchy change, and something that we wanted to roll out very carefully, one dataset at a time—this would give us greater isolation and ability to compare performance impact that if we’d done it one storage host at a time. So, armed with our feature flag setup, we could go from these top-level metrics around volume and average latency of these writes…
  30. … to being able to inspect "COUNT and AVG(cumulative write

    latency) for datasets in the experiment, vs metrics for datasets not in the experiment." This graph’s purple line shows writes that are flagged in to the new code, and the bottom graph shows the impact of the flagged code on our storage engine’s batch write latency.
  31. … after a bit more digging, we unearthed another correlation

    between write speed and size of the write batch, and by incorporating that field into our query, allowed us to confirm that our feature flagged code didn’t have a significant impact on the overall latency of our writes. (This example actually made it onto our blog, and you can find it https://honeycomb.io/blog/2017/08/how-honeycomb-us es-honeycomb-part-5-the-correlations-are-not-what-they-seem/)
  32. This stage everyone’s familiar with, right? :) Monitor production by

    staring at dashboards. And scrolling through dashboards… but I want to press on this, because it’s a great example of tools supporting that ops/dev split I touched on earlier. What’s the biggest source of chaos in systems? Humans. Software Engineers. Us, pushing code. :) Our tools have to be able to reflect this chaos - accurately. The state of the art for this these days seems to be drawing a line to mark a deploy, or matching up timestamps against some other record — but anyone who’s spent enough time deploying their code knows that deploys aren't instantaneous
  33. monitoring, traditionally -> CPU, memory, disk usage. if an ops

    person comes to me and tells me that CPU is up on our API servers, I … can’t immediately act on that. I would only have an abstract idea of how to translate that into a fix in the code. what I would understand… is, the latest deploy has significantly increased latency on one particular endpoint, for our biggest customer. that makes it easy for me to understand where — and when — to find the possible source of that change in performance.
  34. (PLAY VIDEO) - For example, we do rolling deploys of

    our storage nodes - and here you can see the progression of the deploy, the switchover, happen.
  35. (PLAY VIDEO) Here’s a more dramatic example. I was watching

    a deploy go out to our storage engine containing some changes that should have had no impact on performance—but saw the average latency for query reads go up a whole bunch. I was able to pinpoint the build where that started, go figure out what else made it in (turns out another storage layer change landed :)), and give the engineer a heads up. And, you can see where they reverted their change and latencies largely returned to normal. If you think about the sorts of observability tools that developers tend to rely on the most, because they speak their language, you think of… what? Exception trackers and crash reporting tools—but those aren’t flexible enough for ops needs. If we just remember to fold some of those nouns, some of that vocabulary, into our current tools, then maybe it can start to be more natural to reach for a different set of tools, and for us to share a common perspective with ops about prod.
  36. That's how we help bridge this "ops" vs "dev" gap,

    and that's how we devs start thinking about what happens after we ship:
  37. Yep, the things that we deal with day-to-day may be

    different, depending upon which end of the spectrum we fall on… but in the end, we can build bridges that bring us together.
  38. together, we will ask new questions about our systems like

    the blast radius of a change: something ops folks understand innately because they live in production, that developers will only pick up by tightening that feedback loop between dev and prod.
  39. Okay. So. How do we get there, from nothing, without

    getting lost in a giant rabbit hole or spending a month adding instrumentation to all of our services? There are a few parts to this; the first three talk about instrumentation (getting data in) in increasing levels of specificity, the fourth is about how we should be thinking when it comes to getting data back out, and the last is about a new, beautifully developer-friendly approach to this whole space.
  40. what this often means is: collecting metadata along the way

    as code is executed, so that we have everything in one place and ready for analysis. and "in one place" is really powerful — knowing that it took 72 ms to serve this HTTP request and that it took 25ms to execute the render step and that we spent 15ms waiting for the database… will make it trivial to tease out correlations (real correlations) later.
  41. We’ve talked a few times now about the "nouns" that

    your business might care about. They typically map to some part of your business, whether those "nouns" are customers, publishers, sellers, or consumers. Establishing a standard set of nouns to use in our instrumentation, and being consistent with our naming patterns will help make sure our data is as predictable as possible. it helps Future Us not hate Past Us (e.g. always app_id, not sometimes appId or application_id). And making sure those common fields map to a consistent set of metadata on all events we send (hostname, customer ID, dataset ID, build ID, etc) — so no matter which part of the system we’re looking at, we can
  42. let’s use a standard webapp as an example. by instrumenting

    our application, we can capture what arguments were sent to it on any given http request, some metadata about how the app was running, and what was returned … but what about this database, this black box, that the app depends on? what’s happening in there? i dunno, and even though mysql and postgres are open source, i’m certainly not going to fork it just so i can shove instrumentation inside of it. but i know what MySQL queries my app is sending it, from where of the code, and on behalf of which user — and i know how long it took to respond, and whether it was successful, and (if i’m lucky) extra metadata like how many rows were scanned. and by capturing all of that, i can start to reason about how the inputs impact the outputs of my black box, and how my application impacts all of that.
  43. When we talk to folks about beginning to instrument a

    piece of code that already exists, we typically start by asking them to describe a “unit of work” in the system and where it “enters” the system. For a standard webapp, serving an HTTP request is our “unit of work,” and it enters via the HTTP handler. So the handler — or maybe middleware — is your entry point. It’s where to start looking for the first place to hook into your code. And your baseline for describing that unit of work is whatever set of basic HTTP attributes are easy to capture.
  44. What makes your application interesting? Where are the bits that

    are specific to your custom logic, or to your business? What are the bits you can capture to help you narrow down potential causes when you’re trying to debug something? e.g. if you’re trying to figure out why half of your API requests are failing, it may be helpful to know that the failing requests are all trying to talk to one specific database cluster.
  45. And this sets you up for the sort of ad-hoc,

    ephemeral queries that drive development forward. Remember, many of those examples we ran through earlier -- the rate limiting example, or the feature flagged storage example -- relied on data that we had to add, often in parallel to the actual code being written. The simpler and smoother it is for us to add this sort of metadata on the fly, the more we’ll be able to use it to make sure we're building the right things.
  46. And the flip side to experimentation: let go of past

    experiments if they’re no longer valuable. Accept that nothing is set in stone, least of all instrumentation — and if a field isn’t useful anymore, get rid of it. The same way you might retire a feature flag. :)
  47. so to ground these concepts in reality, what’s likely to

    be our status quo, i’m going to talk a bit specifically about migrating from log lines — because that’s what most of us still reach for first.
  48. This is our first step towards that "common set of

    nouns" we want to use across all of the data our eng team is looking at. But recognize that there are ways to do this without dramatically changing things up, if your current teammates rely on looking through logs in a certain way. Maybe it’s as simple as getting folks used to thinking about, and explicitly including in the log output, where that log line is coming from / what context they need to know about that log line to make that log line more useful by itself.
  49. and again — it’s usually possible to do this in

    a non-destructive way. if you need to, ask around to find out what substrings people are currently relying on matching. migrate over to a structured-logging library. logrus and zap are popular in Go, serilog is popular for .NET… find something that works for you, but that also supports the good habits you want to build in your team.
  50. and this is the final step → to get more

    out of your analysis, bundle up related log lines into key/value pairs that represent a unit of work. Folks ask us all the time how to correlate interleaved log lines, when all of the checkpoints describing a single unit of work are spread out across multiple lines of text. If you’re a data analyst with no control over how the data is output, maybe the answer is better string processing and many rounds of mapreduce or self-joins. But if you’re a developer, the easiest way is to pull that context together at the source. Instead of emitting a log line when a task is enqueued and another when it times out, emit a single structured blob upon timeout that describes the amount of time spent queued and spent waiting! You may have to pass more data to pass around, but every language has an answer for this: Go has its stdlib context package; Java and Ruby have thread locals; .NET, if i understand, had HTTP contexts and now has requestscopes or threadscopes. It’s worth it.
  51. how did the earliest devs use logs? their eyeballs and

    grep. doesn’t it make sense that, as our software evolves, the expectations we have of how we interact with the logs they output should, too? Yes, you might be able to find out when something happened — but imagine trying to figure out frequencies, or trends, without twisting yourself into a pretzel.
  52. Logs are easy for humans to read — which made

    sense when the volume of requests any single program handled was fairly small, or when you’re developing on your local machine. But in today’s production world, logs are no longer human-scale. They’re machine-scale, and we need machines to help us make sense of them. As one of my esteemed colleagues said in a recent blog post, "There’s no PageRank for log data."
  53. And part of "having machines help us make sense of

    our data" means visualizing that data, rather than simply grepping and counting matches.
  54. Well, imagine we’re trying to make sure that our webapp

    performance is reasonable — but something (it can be a user, some APM tool, or even the product manager) tells us that things have been slow. Imagine trying to figure out why with only log lines to work with. Well, we’ve got all the useful bits in there: customer ID, the duration of the request, some metadata indicating which part of the app was hit. While this sort of log line may have made sense and told me useful things in my development environment… it scales really poorly once thrown into production, even when we’re only handling… a few requests per second.
  55. (PLAY VIDEO) Imagine instead being able to visualize how long

    requests are taking. My x-axis here is the time the request occurred, and the y-axis is the magnitude of the duration, or how long it took. This right-hand side of the graph tells me that, within the last 15 or 20 minutes, some requests have gotten much slower than usual. (Explain BubbleUp: https://www.honeycomb.io/blog/diving-into-data-with-honeycomb-codename-drilldown-is-in-beta/)
  56. folks are talking a lot these days about using tracing

    for distributed systems or microservices, which, yes, it’s absolutely useful for. (looks like the next session in this room will go into more detail) … but tracing can be invaluable inside a single service for almost the same reasons as for across microservices: in order to trace the execution of a single request through a complex system. (and plenty of complex systems are monoliths, whatever some folks might want you to believe)
  57. Let’s say we start with these task logs we’ve been

    looking at, but we have task IDs attached. It’s not such a far stretch of the imagination to imagine… this. Log lines grouped by task id, with the "Enqueue" line clearly marked as the start of each cluster.
  58. a trace is, at its simplest, a group of structured

    log lines characterized by a handful of magic fields — some descriptors ("service_name," "name"), a timer ("duration_ms"), then all you need are some identifiers ("trace_id," "span_id," and "parent_id") to tie log lines together into a trace.
  59. let’s say we’re looking to inspect how a particular service

    of ours has been behaving. we can start from a high-level query to visualize trends, find an interesting trace, and … this is a trace inside just one of our services. and there’s so much that we can learn about how our code executed, just by including those six special fields … and some extra metadata.
  60. e.g. identifying biz-relevant fields, adopting common standards in naming, and

    thinking in terms of aggregates and trends (before diving into a specific trace) Much the same way that some countries skipped land lines and went straight to cell phones, it may make sense for some orgs to lean on tracing to make sense of disjoint logs.
  61. Tracing is an understanding tool as much as a debugging

    tool; a way for code authors to communicate the structure of their code. tracing is going to become commonplace in 2019 - and if this quantum leap in visualizing your production data that your team needs, then embrace it. :)
  62. Instrumentation and observability shouldn’t just be checkboxes for the "end"

    of the dev cycle; they should be embedded into each stage of the development process and continually checked to keep us grounded with "what’s normal" / "what’s really happening." By capturing more, lightweight, transient information in prod — even before we flip a switch and ship real code — we’ll be better-informed, make better choices, and deliver better experiences for our users.
  63. ## In Conclusion - big or small, compliance or no

    compliance — the folks involved in shipping software should understand the behavior of our systems in production. - Software developers, we should own observability — because we have the most to gain! - Observability should be a core part of how we understand what to build, how to build it, and who we’re building it for. - We have the power to use data to be better developers and ship better software