Upgrade to Pro — share decks privately, control downloads, hide ads and more …

Monitoring Postgres at Scale | PGConf.ASIA 2018 | Lukas Fittl

Citus Data
December 12, 2018

Monitoring Postgres at Scale | PGConf.ASIA 2018 | Lukas Fittl

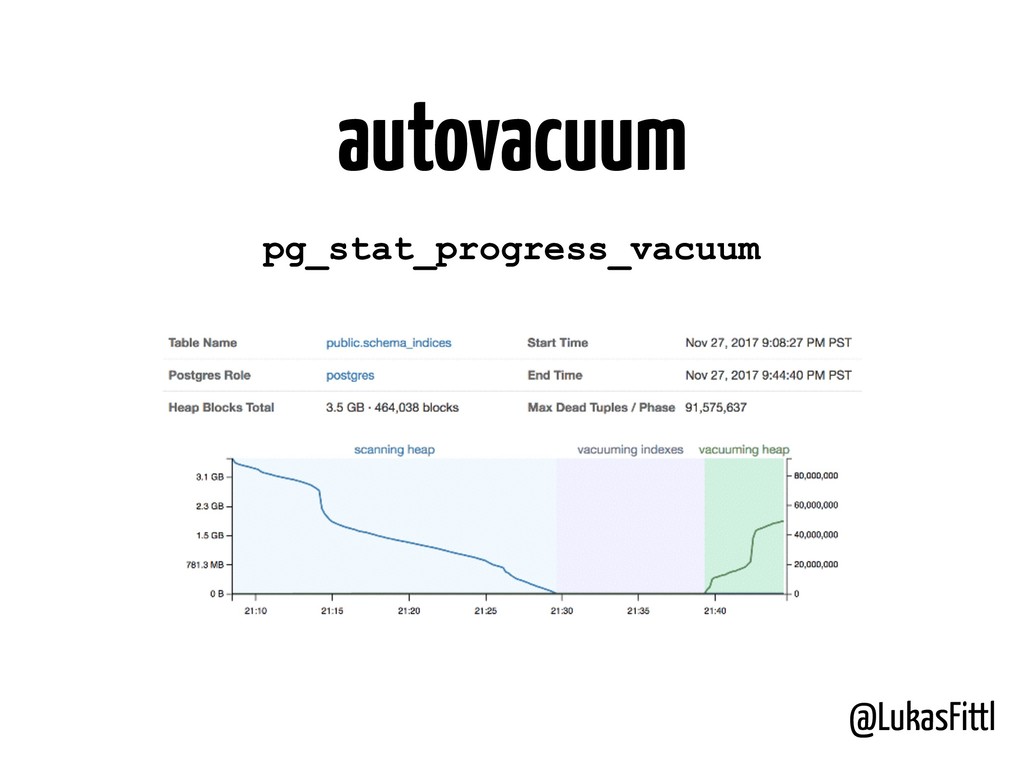
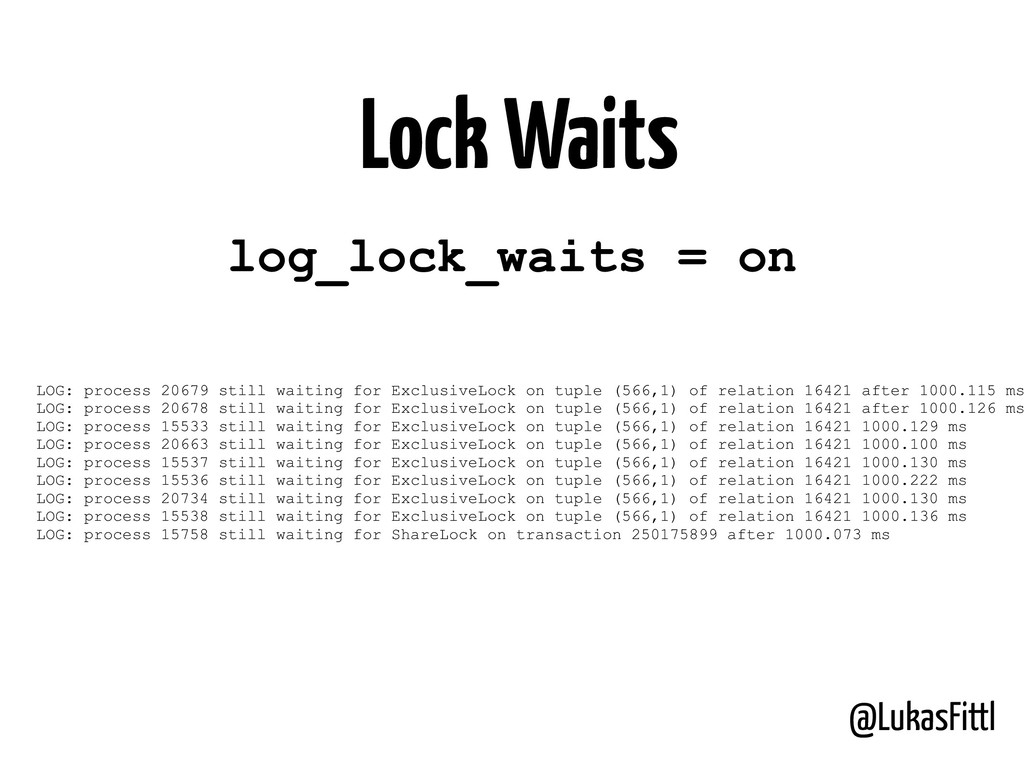
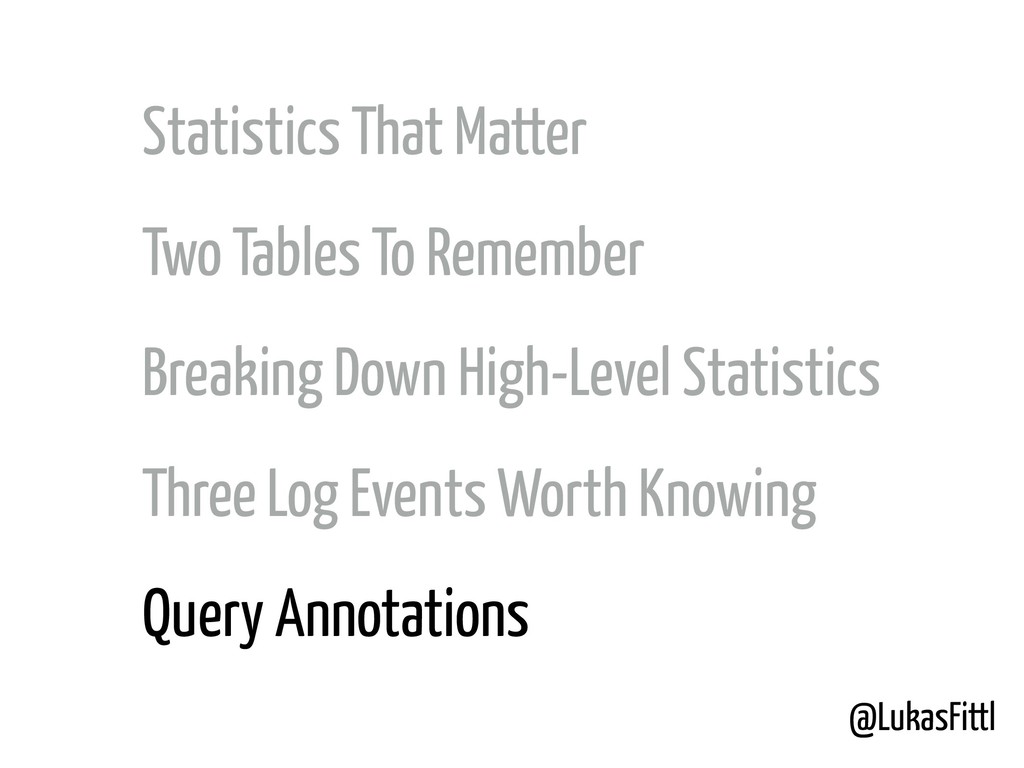
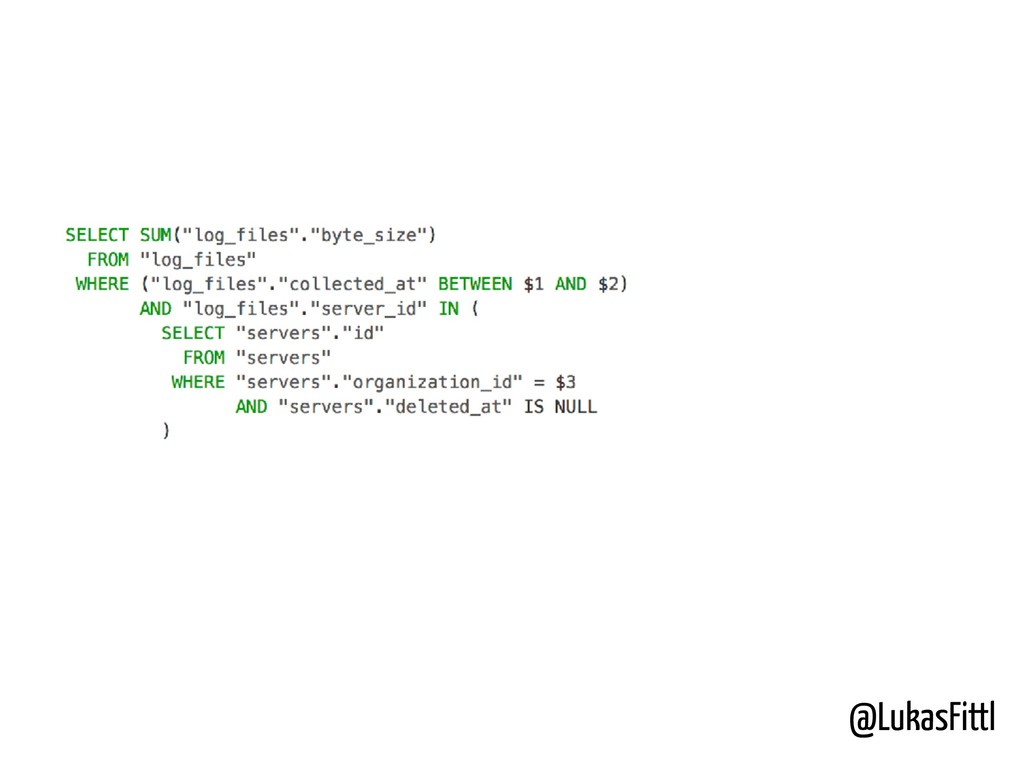
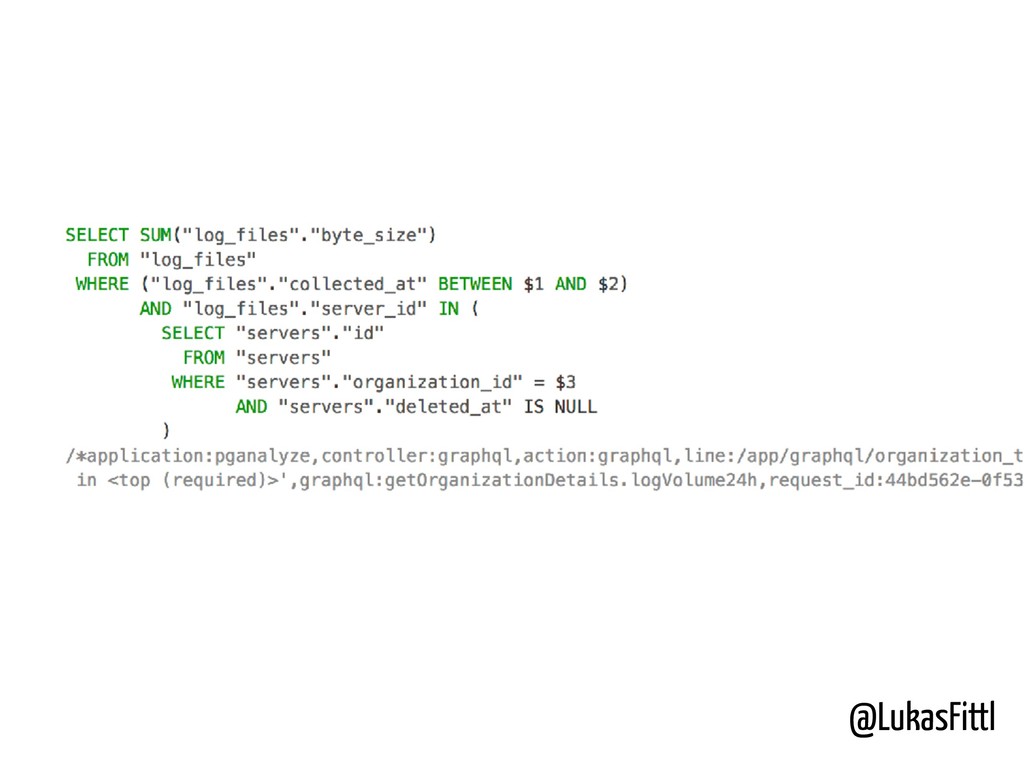
Your PostgreSQL database is one of the most important pieces of your architecture. What should you really watch out for, send reports on and alert on? We’ll discuss how query performance statistics can be made accessible to application developers, critical entries one should monitor in the PostgreSQL log files, how to collect EXPLAIN plans at scale, how to watch over autovacuum and VACUUM operations, and how to flag issues based on schema statistics.

Citus Data

December 12, 2018
Tweet

More Decks by Citus Data

Other Decks in Technology

Transcript

  1. @LukasFittl Statistics That Matter Two Tables To Remember Breaking Down

    High-Level Statistics Three Log Events Worth Knowing Query Annotations
  2. @LukasFittl Statistics That Matter Two Tables To Remember Breaking Down

    High-Level Statistics Three Log Events Worth Knowing Query Annotations
  3. @LukasFittl Statistics Are Often Counters * except when reset /

    overrun Counts only go up*,
 calculate diffs!
  4. @LukasFittl pg_stat_user_tables relname: name of the table seq_scan: # of

    sequential scans idx_scan: # of index scans n_tup_(ins/del/upd): # of rows modified n_live_tup: live rows n_dead_tup: dead rows last_(auto)vacuum: last VACUUM last_(auto)analyze: last ANALYZE …
  5. @LukasFittl SELECT relname, n_live_tup, seq_scan + idx_scan, 100 * idx_scan

    / (seq_scan + idx_scan) FROM pg_stat_user_tables ORDER BY n_live_tup DESC Index Hit Rate Target: >= 95% on large, active tables
  6. @LukasFittl pg_statio_user_tables relname: name of the table heap_blks_read: blocks from

    disk / OS cache heap_blks_hit: blocks from buffer cache idx_blks_read: index blks from disk idx_blks_hit: index blks from buffer cache …
  7. @LukasFittl pg_stat_activity pid: process ID backend_type: “client backend” vs internal

    processes state: idle/active/idle in transaction state_change: time of state change query: current/last running query backend_start: process start time xact_start: TX start time query_start: query start time wait_event: what backend is waiting for (e.g. Lock, I/O, etc) …
  8. @LukasFittl Longest Running Query SELECT now() - query_start, query FROM

    pg_stat_activity
 WHERE state = ‘active’ ORDER BY 1 LIMIT 1
  9. @LukasFittl 1. Install postgresql contrib package (if not installed) 2.

    Enable in postgresql.conf
 shared_preload_libraries = ‘pg_stat_statements’ 3. Restart your database 4. Create the extension
 CREATE EXTENSION pg_stat_statements; Enabling pg_stat_statements
  10. @LukasFittl SELECT * FROM pg_stat_statements; userid | 10 dbid |

    1397527 query | SELECT * FROM x WHERE calls | 5 total_time | 15.249 rows | 0 shared_blks_hit | 451 shared_blks_read | 41 shared_blks_dirtied | 26 shared_blks_written | 0 local_blks_hit | 0 pg_stat_statements
  11. @LukasFittl queryid | 1720234670 query | SELECT * FROM x

    WHERE y = ? calls | 5 total_time | 15.249 Query + No. of Calls + Avg Time
  12. @LukasFittl shared_blks_hit | 2447215 shared_blks_read | 55335 Avg. Shared Buffer

    Hit Rate hit_rate = shared_blks_hit / (shared_blks_hit + shared_blks_read) 97.78% Cache Hit Rate
  13. @LukasFittl Lock Statistics pg_locks pid: process ID (JOIN to pg_stat_activity.pid!)

    locktype: type of object being locked mode: locking type (e.g. AccessExclusive) granted: Lock Granted vs Being Waited For …
  14. @LukasFittl autovacuum => SELECT pid, query FROM pg_stat_activity WHERE query

    LIKE 'autovacuum: %'; 10469 | autovacuum: VACUUM ANALYZE public.schema_columns 12848 | autovacuum: VACUUM public.replication_follower_stats 28626 | autovacuum: VACUUM public.schema_index_stats | (to prevent wraparound) (3 rows) pg_stat_activity
  15. @LukasFittl autovacuum pg_stat_progress_vacuum relid: OID of the table phase: current

    VACUUM phase heap_blks_total: Heap Blocks Total heap_blks_scanned: Heap Blocks Scanned heap_blks_vacuumed: Heap Blocks Vacuumed …
  16. @LukasFittl Statistics That Matter Two Tables To Remember Breaking Down

    High-Level Statistics Three Log Events Worth Knowing Query Annotations
  17. @LukasFittl pg_stat_activity - Number & State of Connections - Oldest

    Query Still Running - Oldest Transaction Still Open - Blocked Queries
  18. @LukasFittl pg_stat_database - Transactions Per Second - Data Read Per

    Second - Rows Updated/etc Per Second - Deadlocks Per Second - …
  19. @LukasFittl Statistics That Matter Two Tables To Remember Breaking Down

    High-Level Statistics Three Log Events Worth Knowing Query Annotations
  20. @LukasFittl Statistics That Matter Two Tables To Remember Breaking Down

    High-Level Statistics Three Log Events Worth Knowing Query Annotations
  21. @LukasFittl LOG: duration: 4079.697 ms execute <unnamed>: SELECT * FROM

    x WHERE y = $1 LIMIT $2 DETAIL: parameters: $1 = 'long string', $2 = ‘1' Slow Queries log_min_duration_statement = 1000 ms
  22. @LukasFittl log_lock_waits = on LOG: process 20679 still waiting for

    ExclusiveLock on tuple (566,1) of relation 16421 after 1000.115 ms LOG: process 20678 still waiting for ExclusiveLock on tuple (566,1) of relation 16421 after 1000.126 ms LOG: process 15533 still waiting for ExclusiveLock on tuple (566,1) of relation 16421 1000.129 ms LOG: process 20663 still waiting for ExclusiveLock on tuple (566,1) of relation 16421 1000.100 ms LOG: process 15537 still waiting for ExclusiveLock on tuple (566,1) of relation 16421 1000.130 ms LOG: process 15536 still waiting for ExclusiveLock on tuple (566,1) of relation 16421 1000.222 ms LOG: process 20734 still waiting for ExclusiveLock on tuple (566,1) of relation 16421 1000.130 ms LOG: process 15538 still waiting for ExclusiveLock on tuple (566,1) of relation 16421 1000.136 ms LOG: process 15758 still waiting for ShareLock on transaction 250175899 after 1000.073 ms Lock Waits
  23. @LukasFittl Statistics That Matter Two Tables To Remember Breaking Down

    High-Level Statistics Three Log Events Worth Knowing Query Annotations
  24. @LukasFittl application: pganalyze controller: graphql action: graphql line: /app/graphql/organization_type.rb …

    graphql: getOrganizationDetails.logVolume24h request_id: 44bd562e-0f53-453f-831f-498e61ab6db5
  25. @LukasFittl 3 Take-Aways 1. Collect Historic Metrics 2. Focus on

    Drill-Down To Query Level 3. Annotate Your Queries With Their Origin