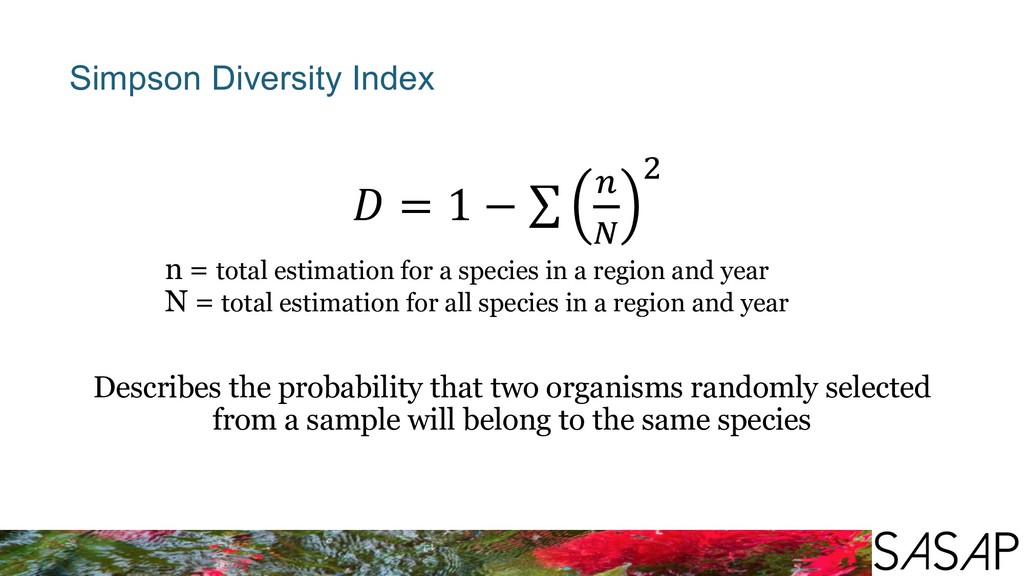
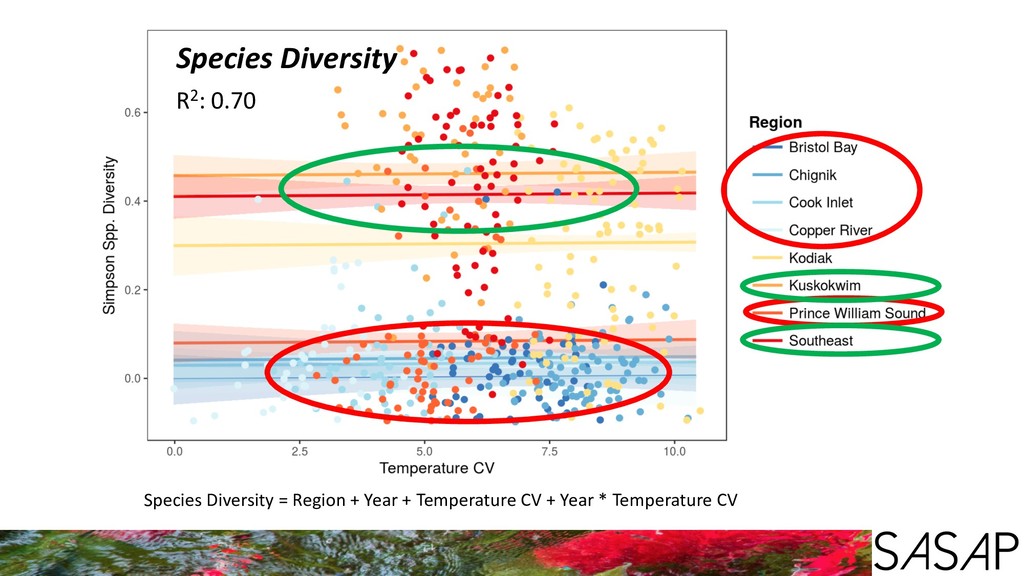
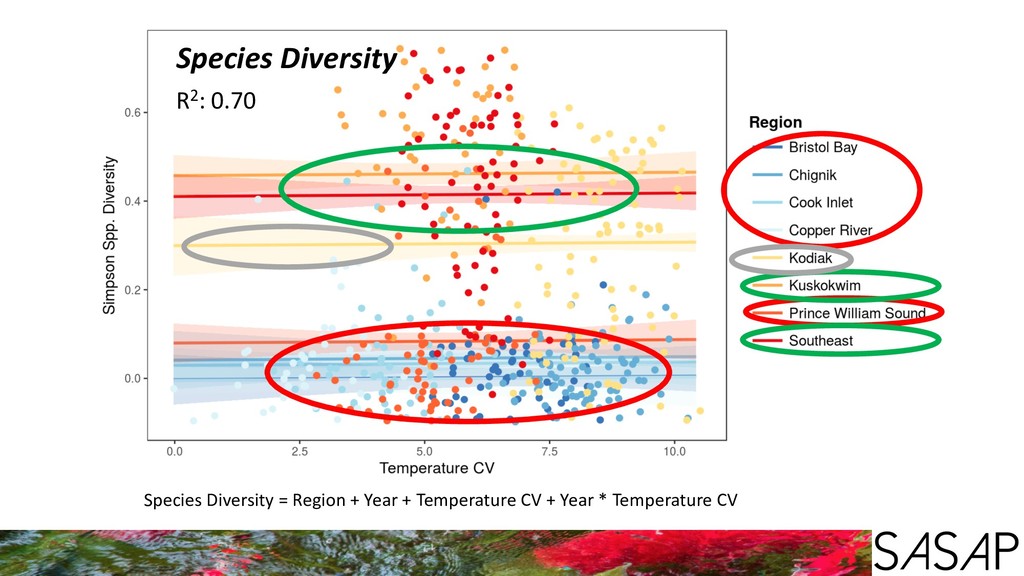
( n = total estimation for a species in a region and year N = total estimation for all species in a region and year Describes the probability that two organisms randomly selected from a sample will belong to the same species
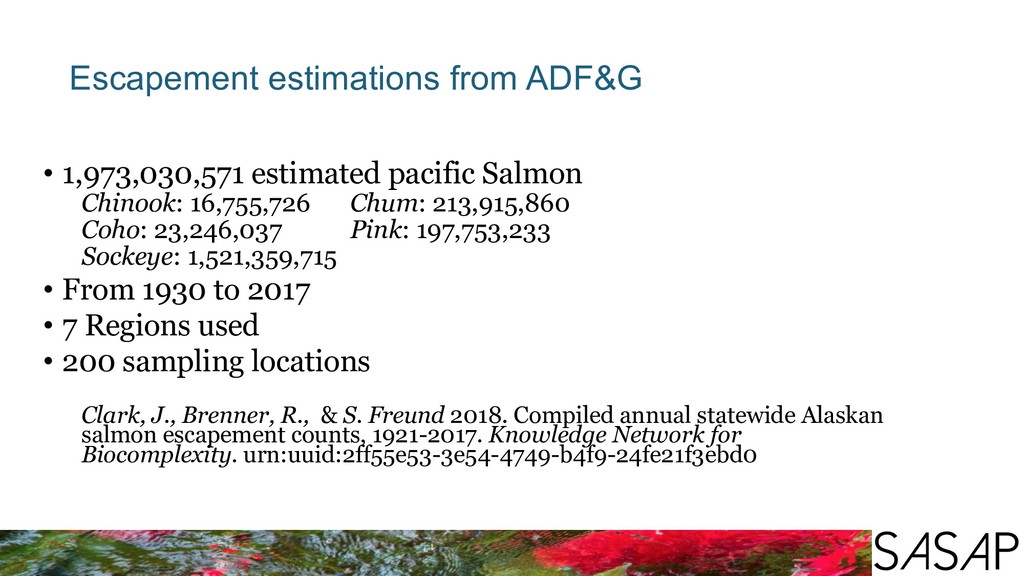
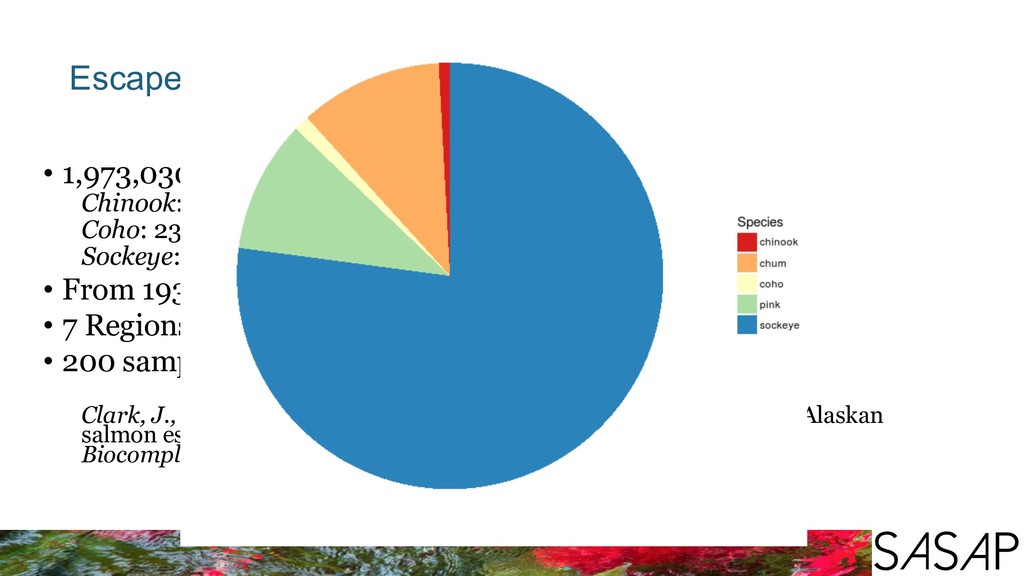
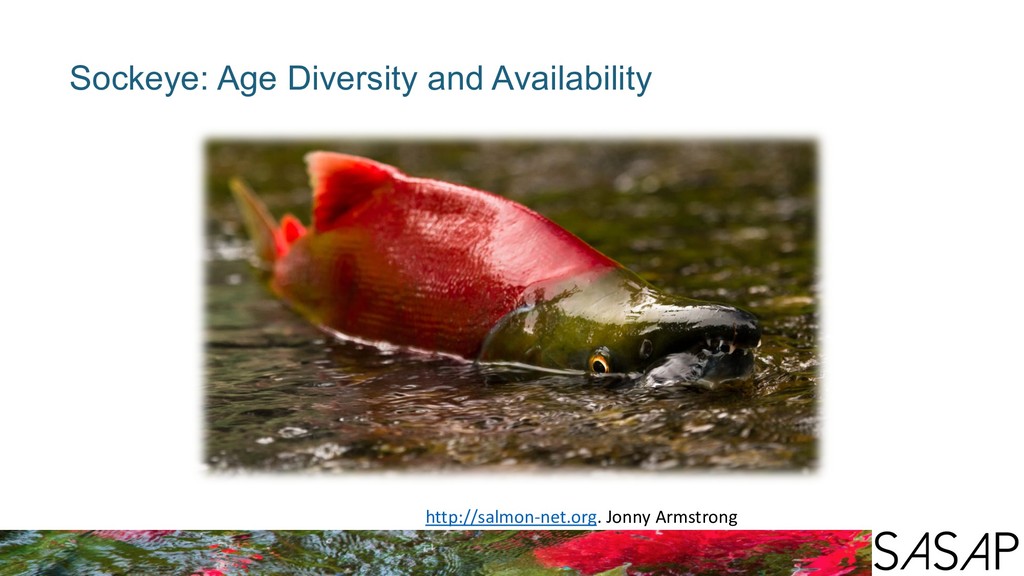
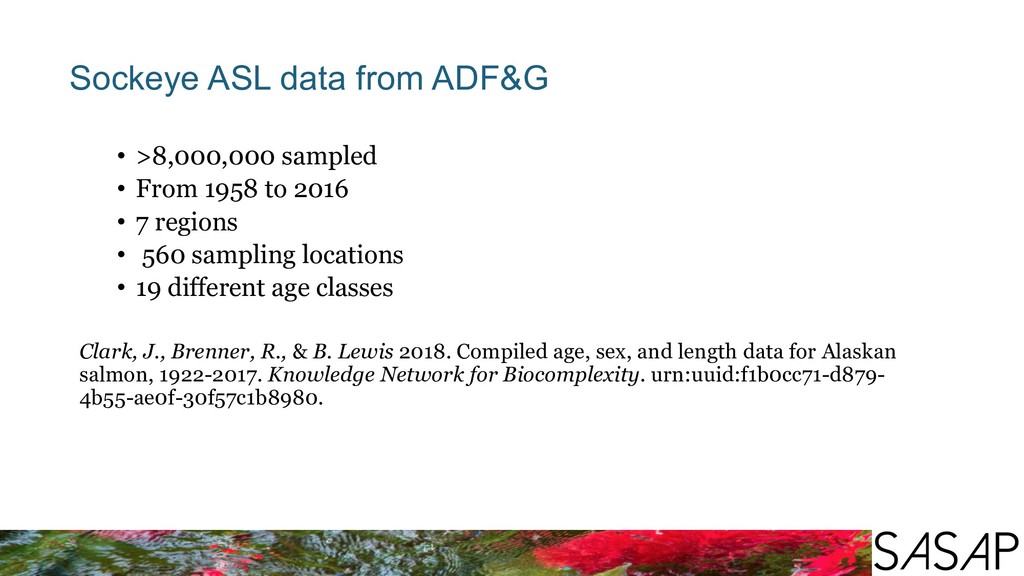
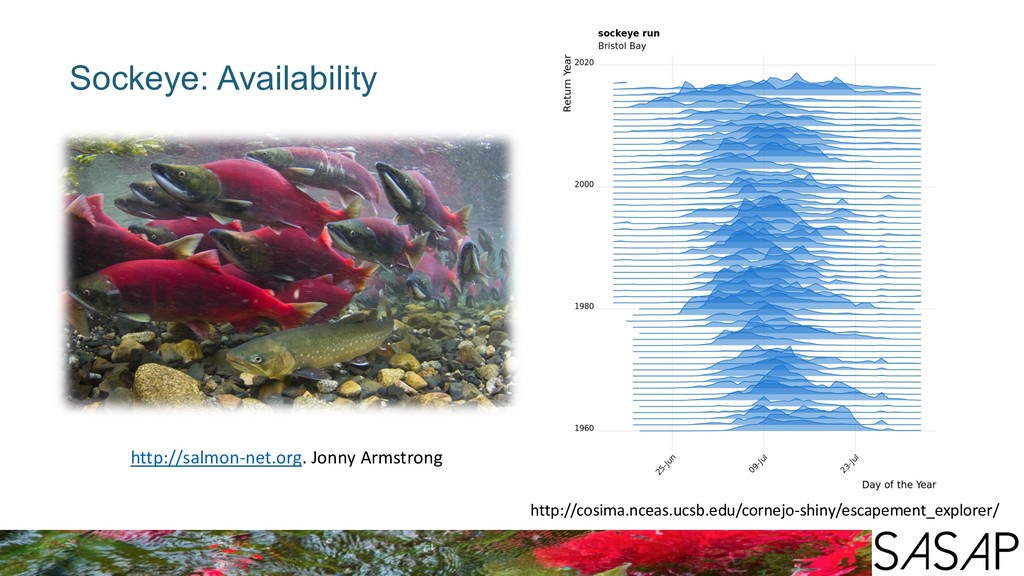
1958 to 2016 • 7 regions • 560 sampling locations • 19 different age classes Clark, J., Brenner, R., & B. Lewis 2018. Compiled age, sex, and length data for Alaskan salmon, 1922-2017. Knowledge Network for Biocomplexity. urn:uuid:f1b0cc71-d879- 4b55-ae0f-30f57c1b8980.
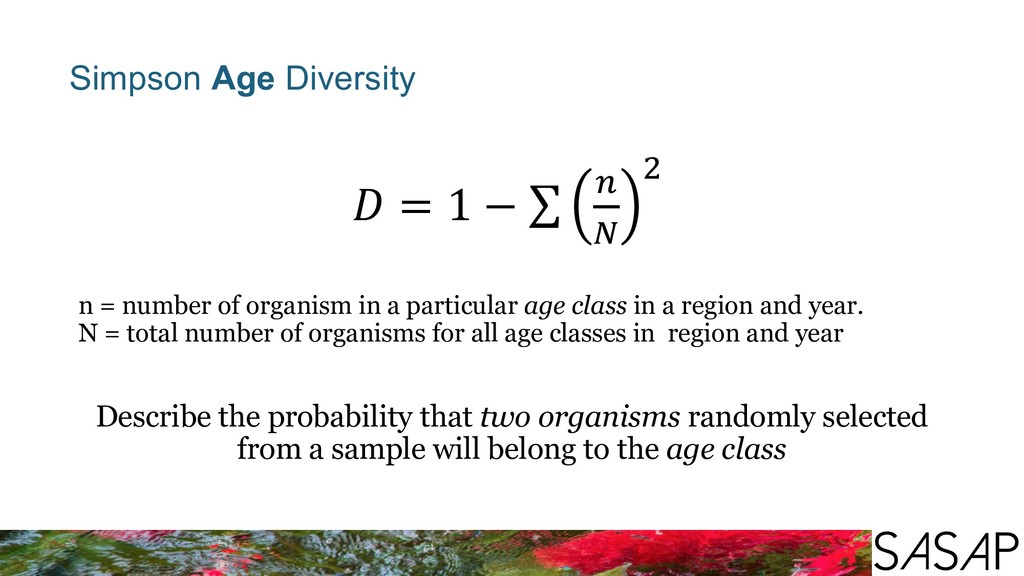
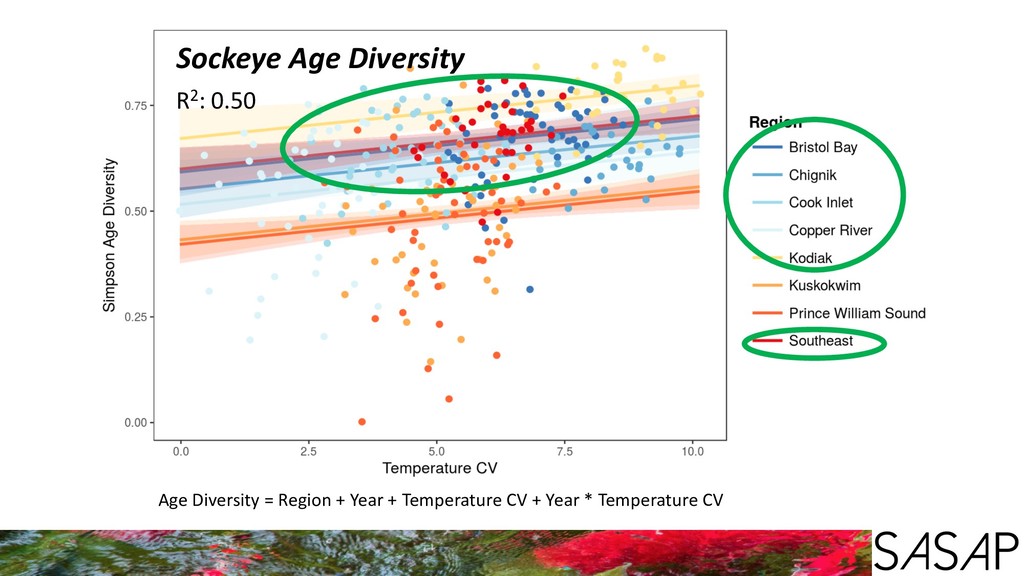
( n = number of organism in a particular age class in a region and year. N = total number of organisms for all age classes in region and year Describe the probability that two organisms randomly selected from a sample will belong to the age class
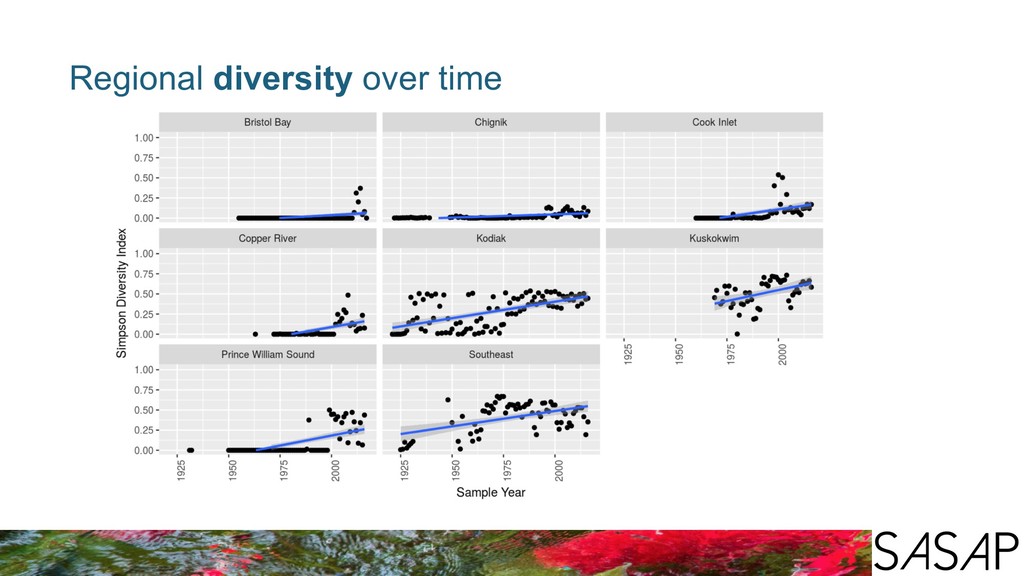
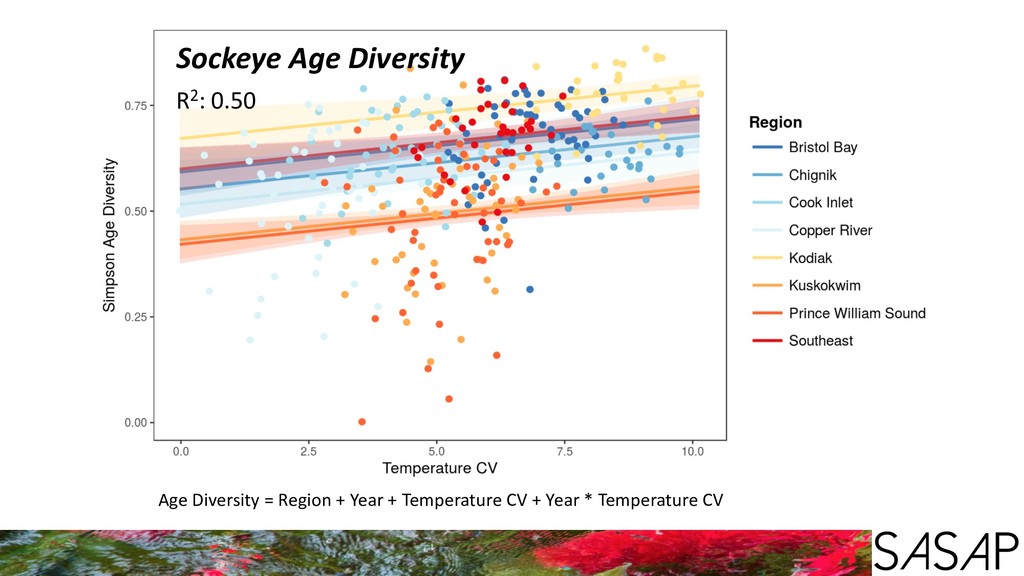
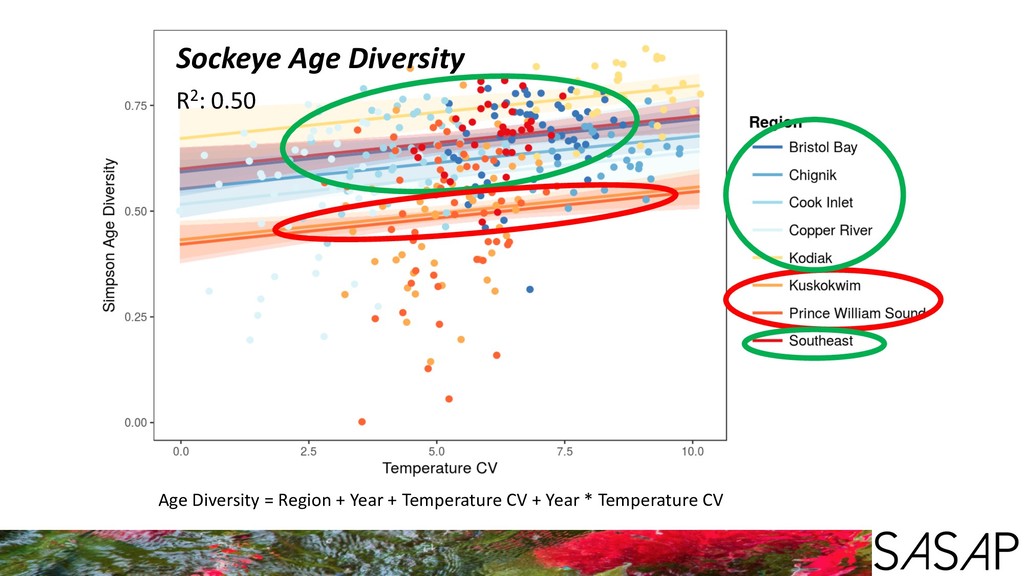
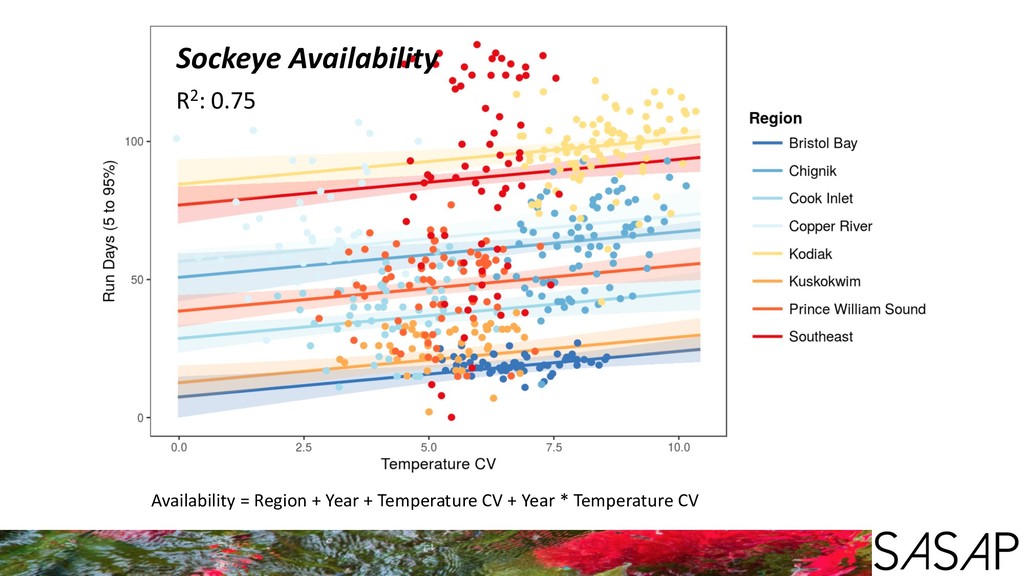
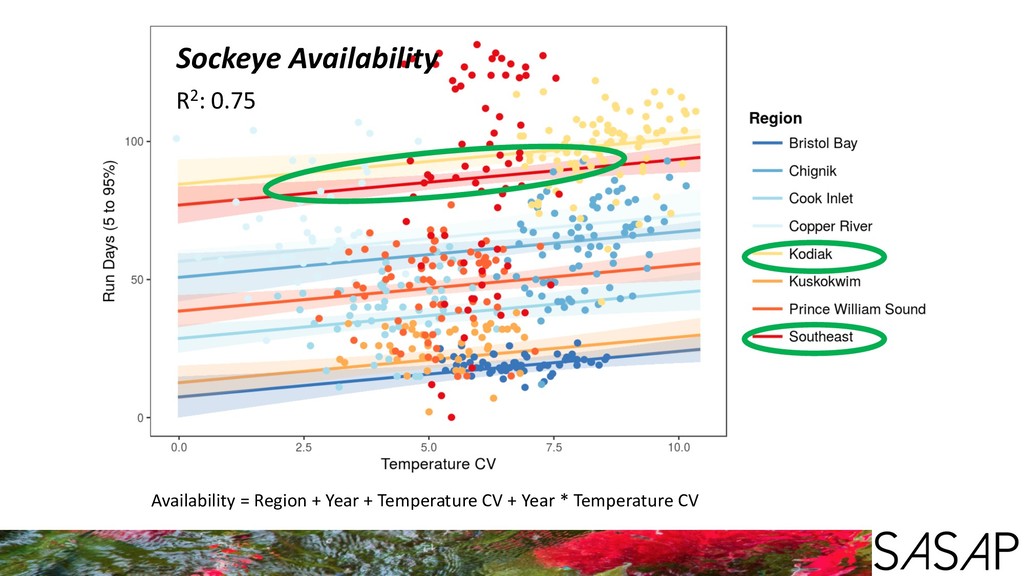
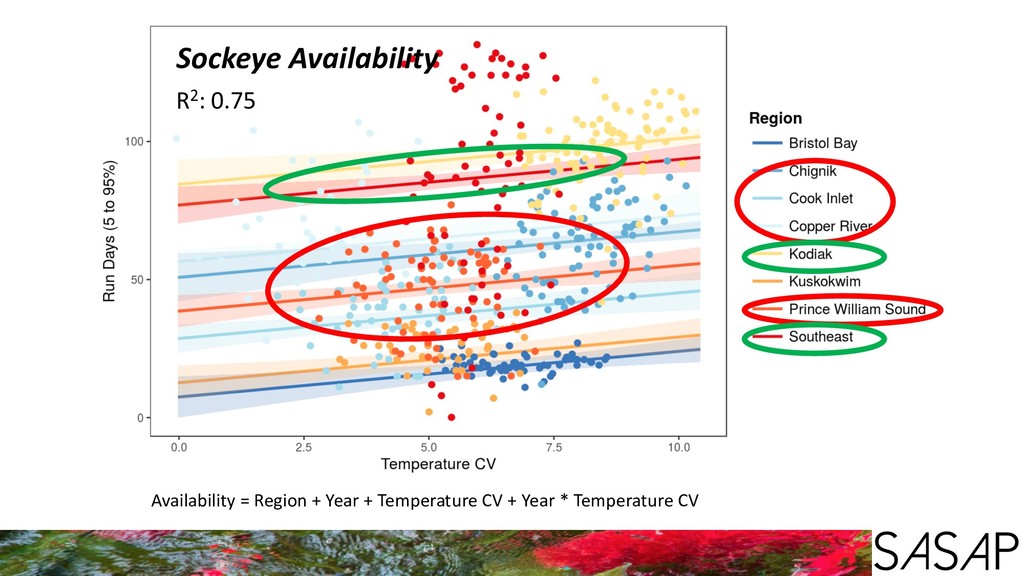
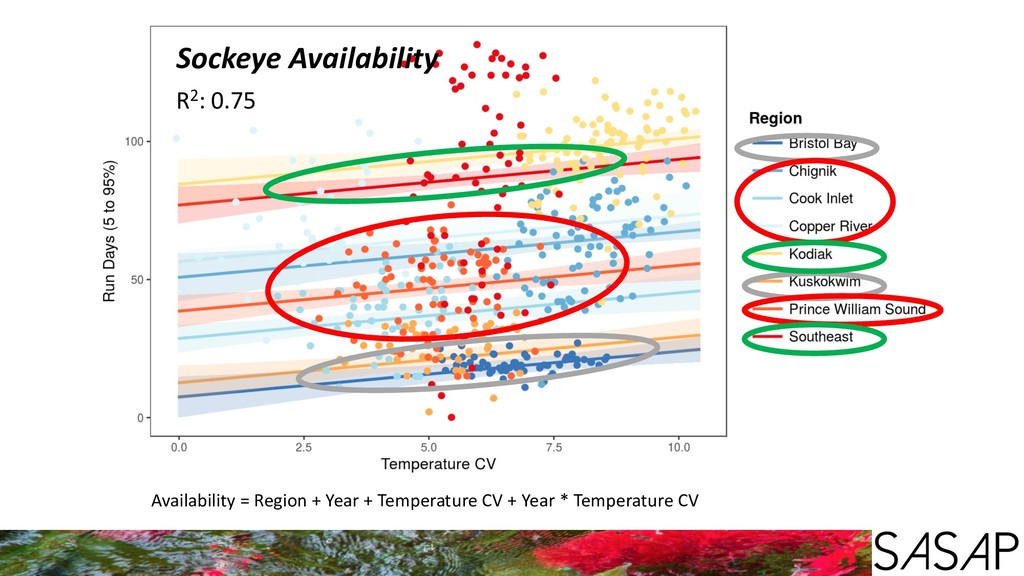
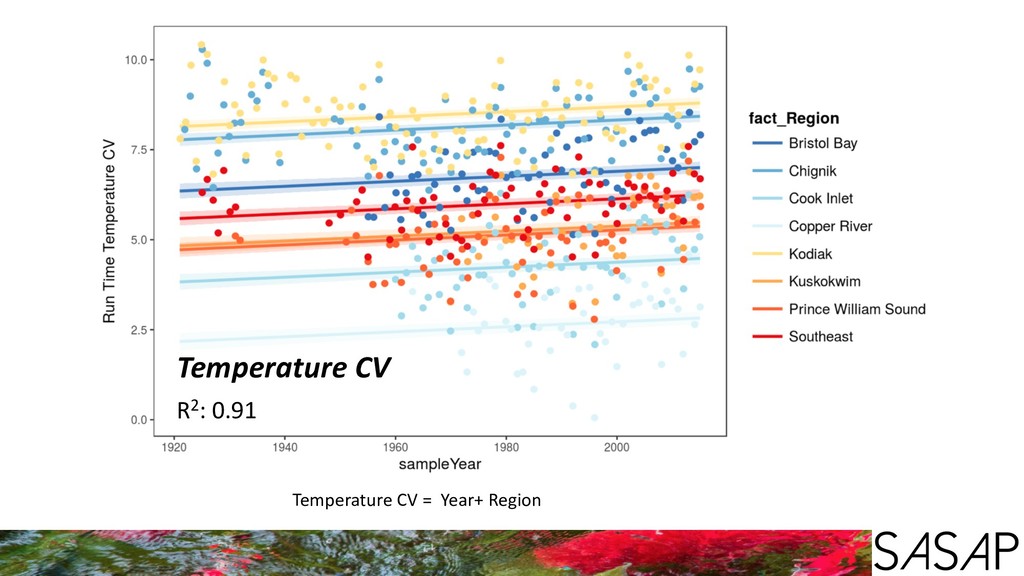
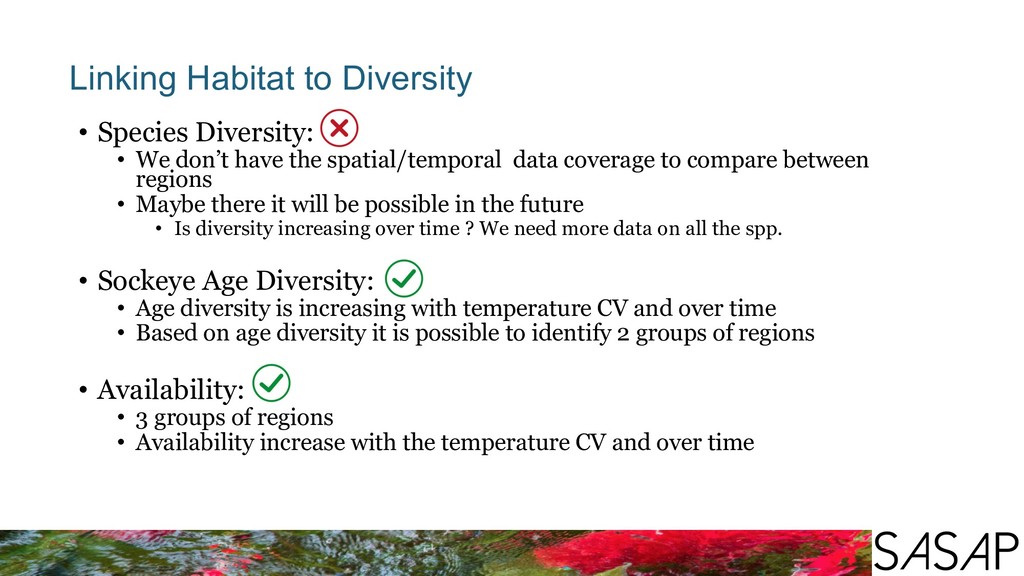
have the spatial/temporal data coverage to compare between regions • Maybe there it will be possible in the future • Is diversity increasing over time ? We need more data on all the spp. • Sockeye Age Diversity: • Age diversity is increasing with temperature CV and over time • Based on age diversity it is possible to identify 2 groups of regions • Availability: • 3 groups of regions • Availability increase with the temperature CV and over time
they have a significant effect on diversity and availability • Increasing availability does not necessarily means predictability • It could be the opposite from the perspective of harvesters • Longer regional availability can be composed of shorter runs at different times • It is important to understand the tradeoffs between habitat loss and diversity loss. • How much diversity is enough diversity ?
![Jorge Cornejo [email protected] Acknowledgments](https://files.speakerdeck.com/presentations/3a022cacf7334d58839dfcdda5d0a342/slide_29.jpg)