hyperlinked. Do download and read further if you see something interesting on a slide. I’m going to run the full hour. There will not be a separate question time at the end. Please interrupt for questions!
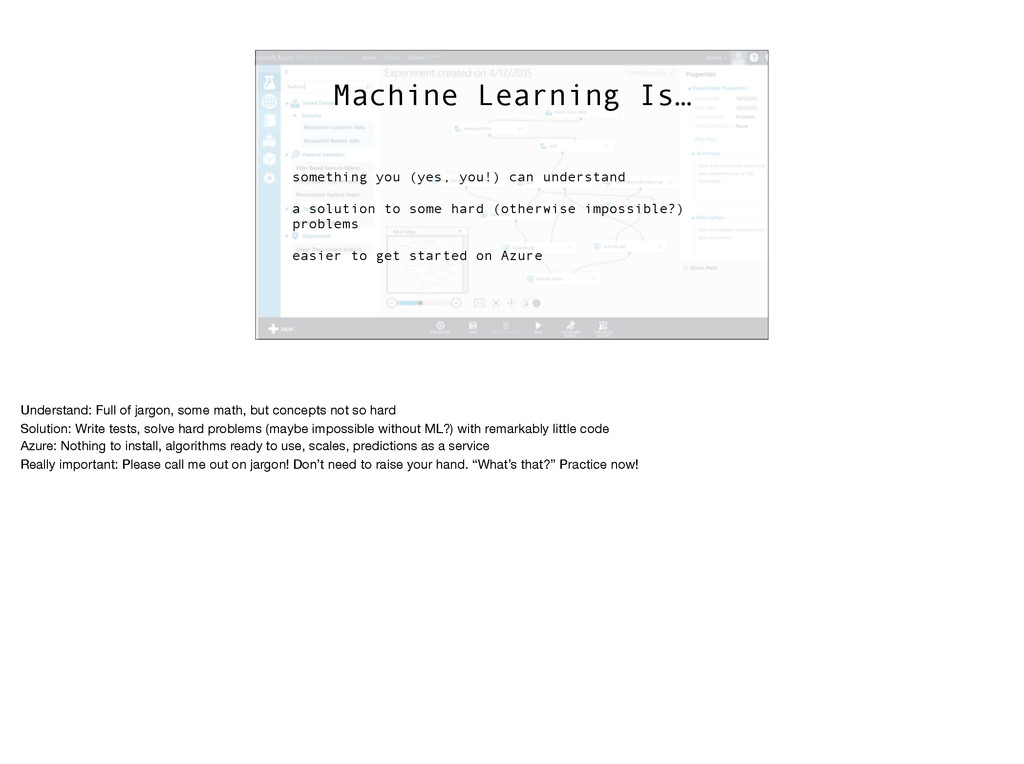
solution to some hard (otherwise impossible?) problems easier to get started on Azure Understand: Full of jargon, some math, but concepts not so hard Solution: Write tests, solve hard problems (maybe impossible without ML?) with remarkably little code Azure: Nothing to install, algorithms ready to use, scales, predictions as a service Really important: Please call me out on jargon! Don’t need to raise your hand. “What’s that?” Practice now!
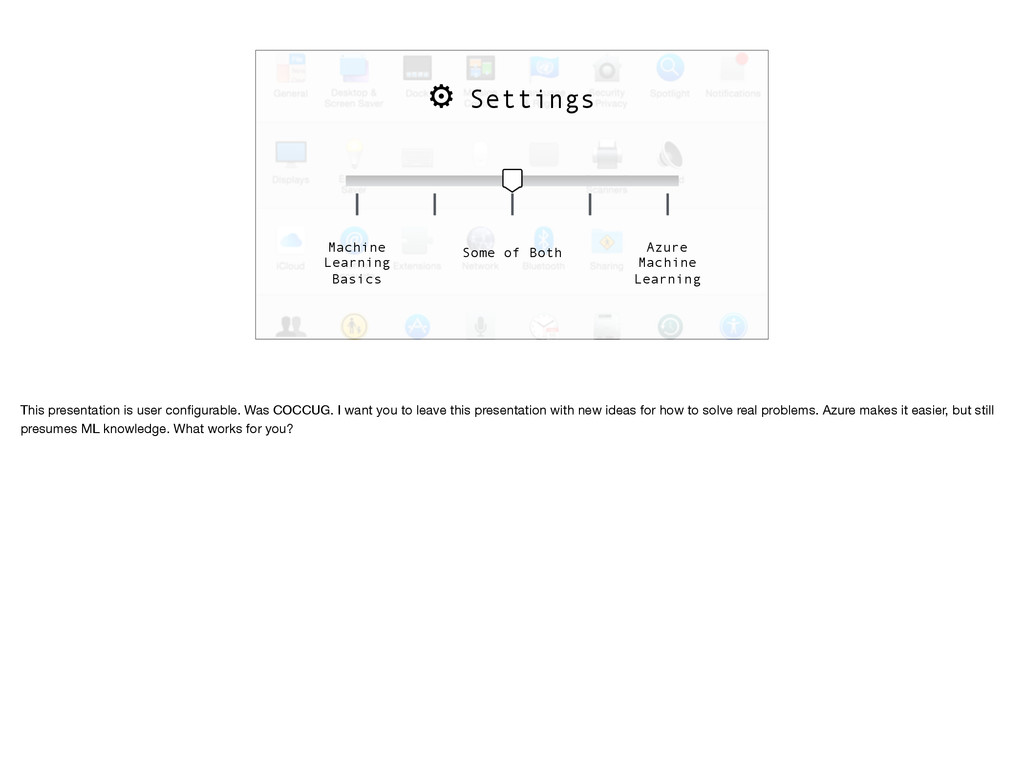
Both This presentation is user configurable. Was COCCUG. I want you to leave this presentation with new ideas for how to solve real problems. Azure makes it easier, but still presumes ML knowledge. What works for you?
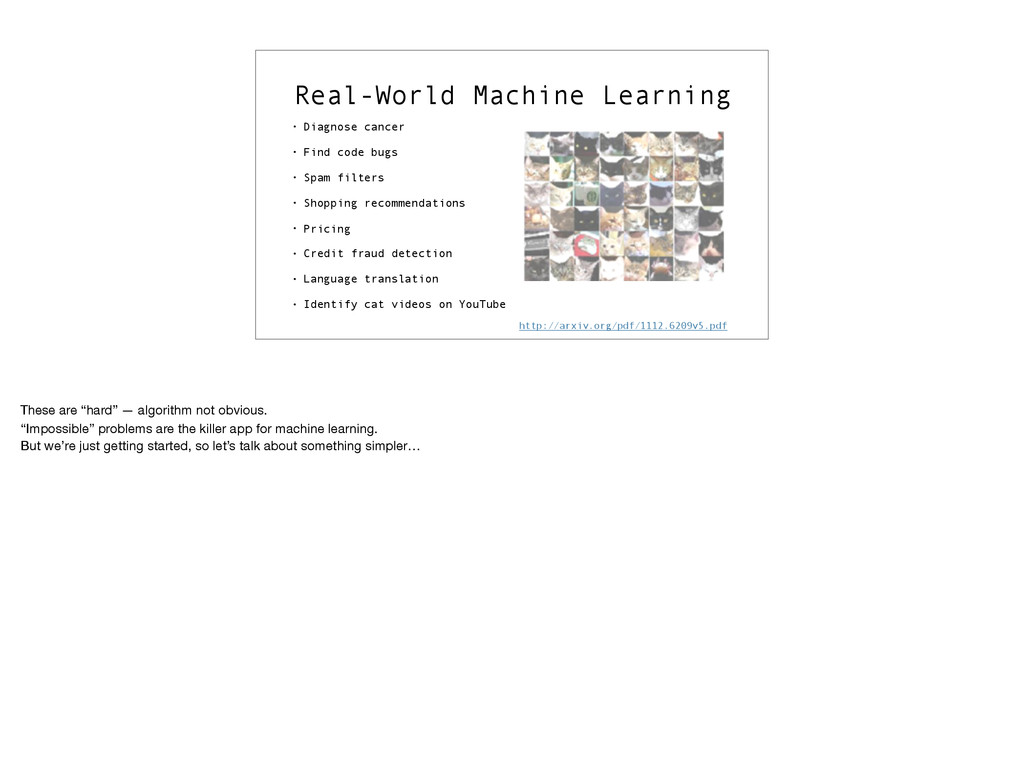
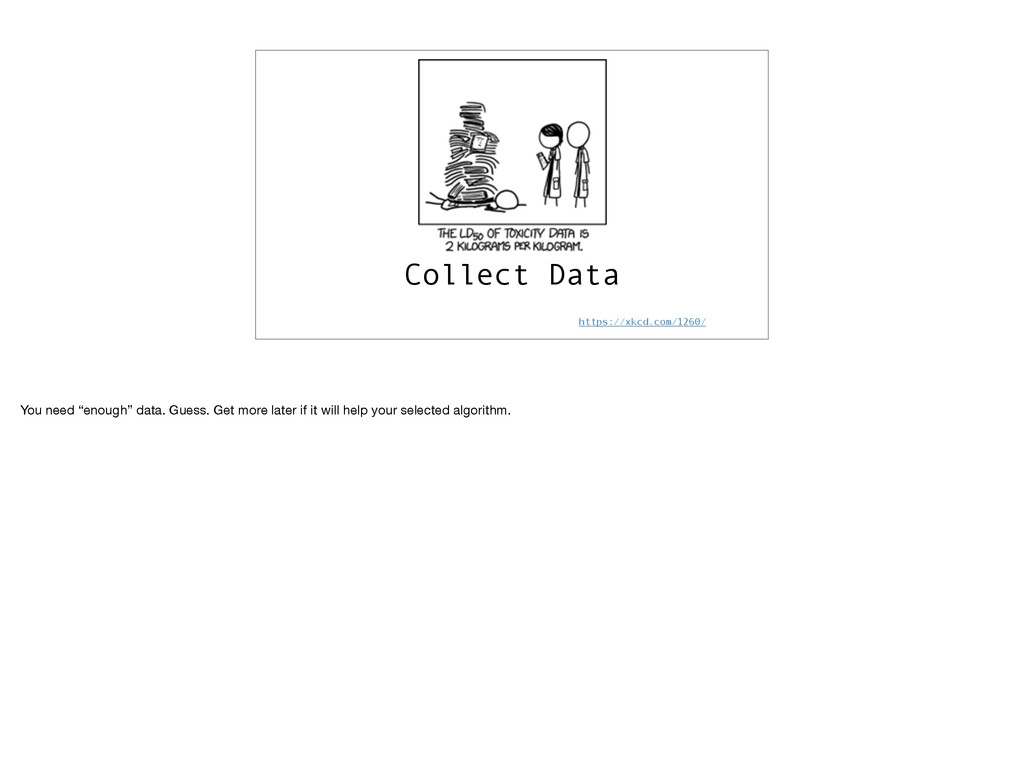
• Spam filters • Shopping recommendations • Pricing • Credit fraud detection • Language translation • Identify cat videos on YouTube http://arxiv.org/pdf/1112.6209v5.pdf These are “hard” — algorithm not obvious. “Impossible” problems are the killer app for machine learning. But we’re just getting started, so let’s talk about something simpler…
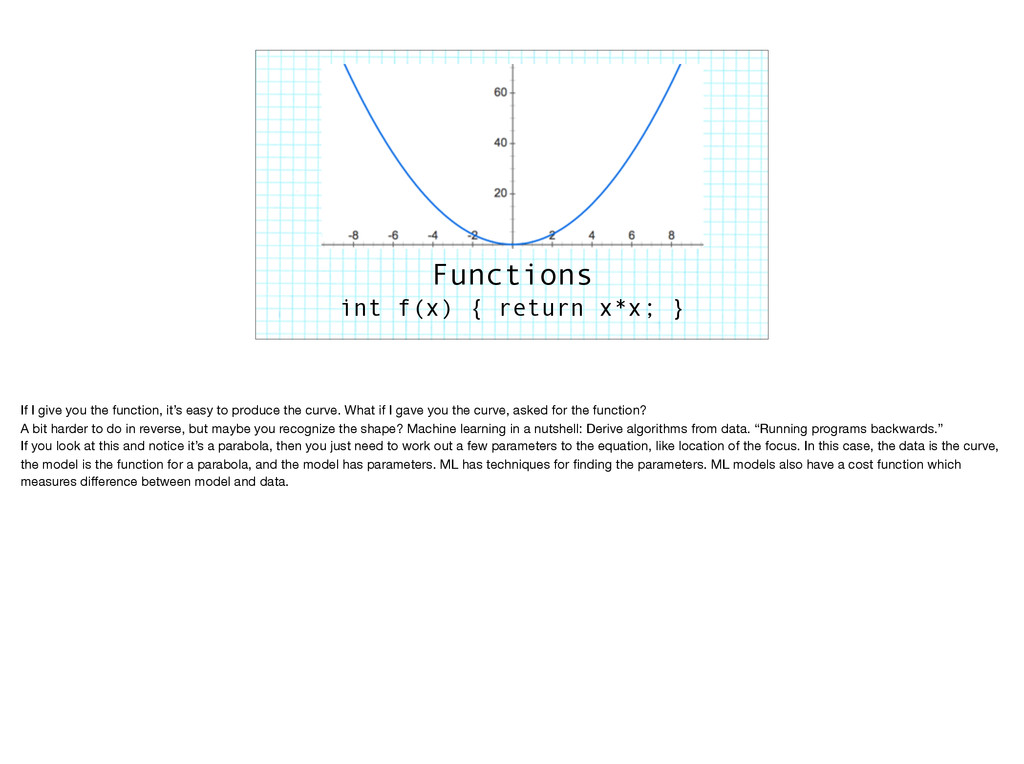
you the function, it’s easy to produce the curve. What if I gave you the curve, asked for the function? A bit harder to do in reverse, but maybe you recognize the shape? Machine learning in a nutshell: Derive algorithms from data. “Running programs backwards.” If you look at this and notice it’s a parabola, then you just need to work out a few parameters to the equation, like location of the focus. In this case, the data is the curve, the model is the function for a parabola, and the model has parameters. ML has techniques for finding the parameters. ML models also have a cost function which measures difference between model and data.
want to write. This one is for email classification. I wrote this myself! It’s not very good. Why? We’ve tried it! 1) Doesn’t work, even for non-trivial implementation (people tried this kind of technique for years). 2) This is short, real one huge/unmaintainable. 3) Different for everyone. Some people like spam!
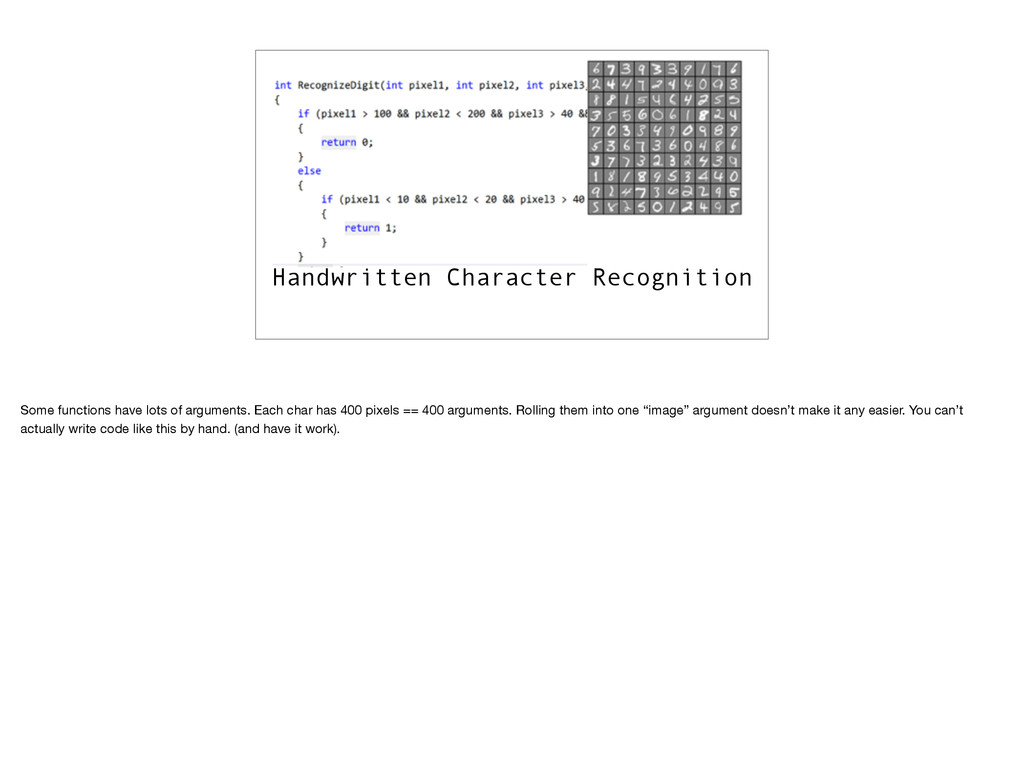
char has 400 pixels == 400 arguments. Rolling them into one “image” argument doesn’t make it any easier. You can’t actually write code like this by hand. (and have it work).
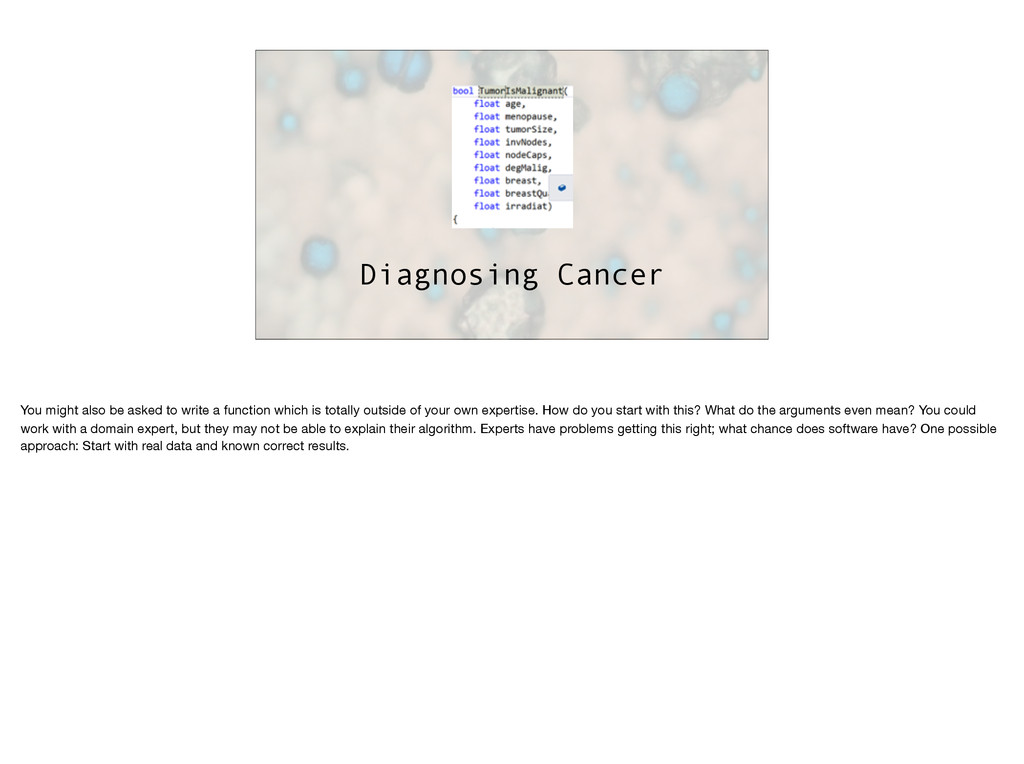
function which is totally outside of your own expertise. How do you start with this? What do the arguments even mean? You could work with a domain expert, but they may not be able to explain their algorithm. Experts have problems getting this right; what chance does software have? One possible approach: Start with real data and known correct results.
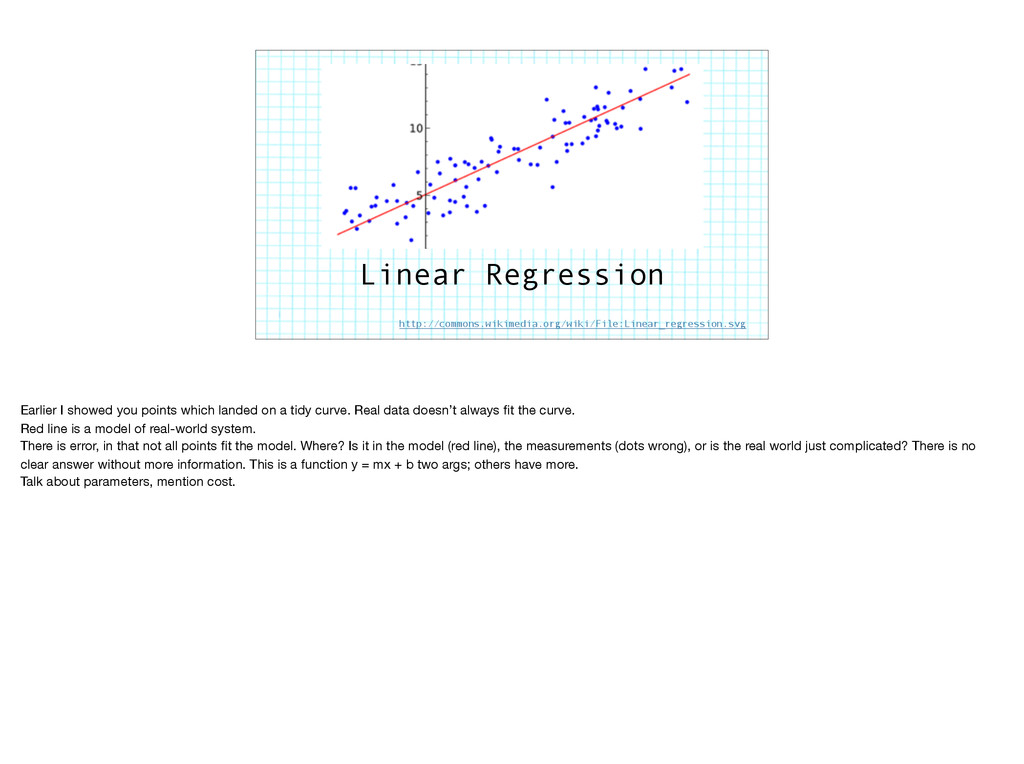
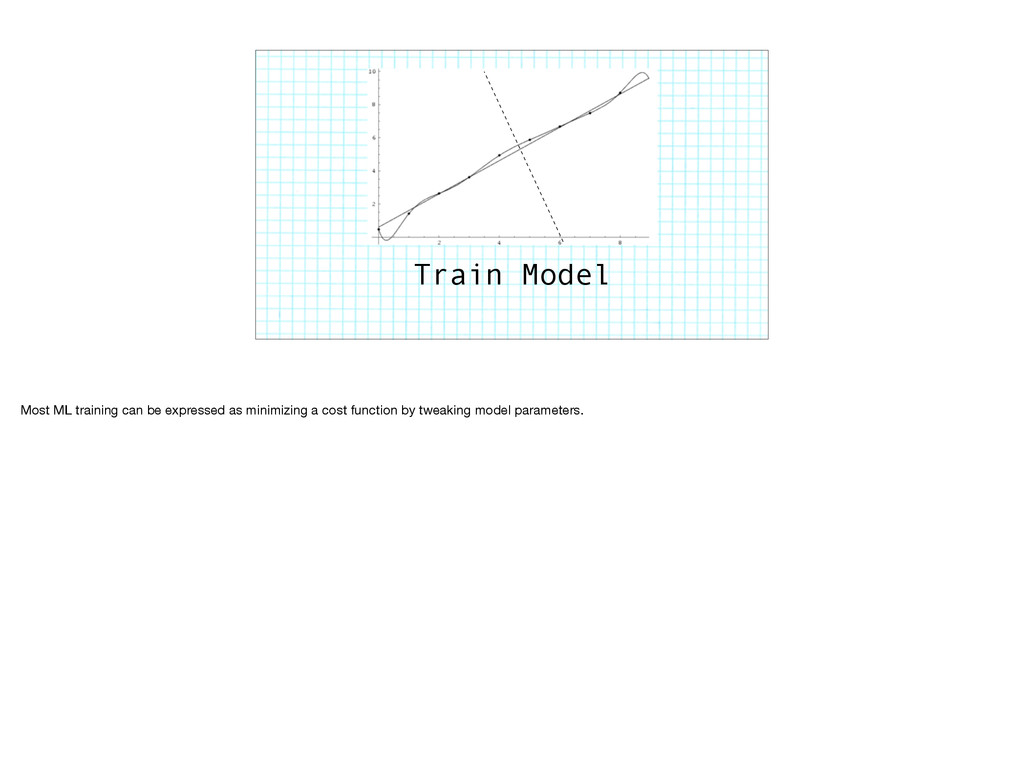
on a tidy curve. Real data doesn’t always fit the curve. Red line is a model of real-world system. There is error, in that not all points fit the model. Where? Is it in the model (red line), the measurements (dots wrong), or is the real world just complicated? There is no clear answer without more information. This is a function y = mx + b two args; others have more. Talk about parameters, mention cost.
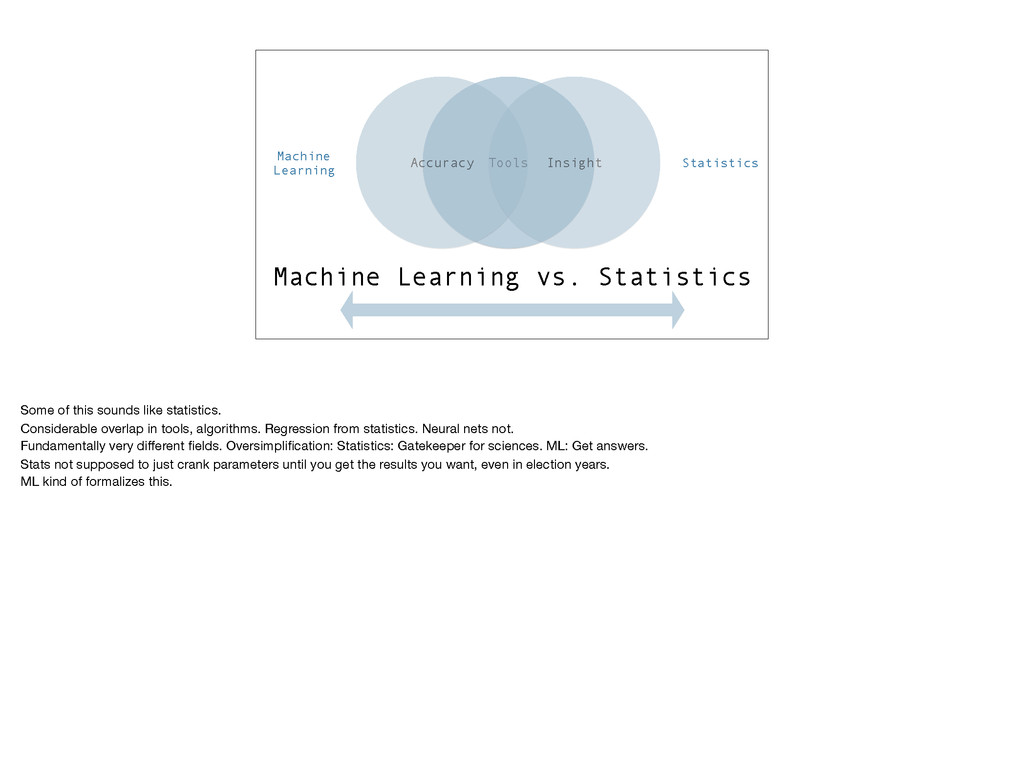
Some of this sounds like statistics. Considerable overlap in tools, algorithms. Regression from statistics. Neural nets not. Fundamentally very different fields. Oversimplification: Statistics: Gatekeeper for sciences. ML: Get answers. Stats not supposed to just crank parameters until you get the results you want, even in election years. ML kind of formalizes this.
cost a little deeper. Dots in this model are real world measurements. Red line is terrible. Curved line passes through all points, appears to have no error, but straight line is a better model (Why?) — reflects data we haven’t seen yet. Much of ML is bias (red; model doesn’t reflect real data) vs. variance (curvy; predictions change too much with data points). Perfect models have neither bias nor variance. For imperfect models, it’s important to understand whether imperfection is due to bias or variance. Different fixes Reduce cost (difference between prediction and real points) on training data and test data.
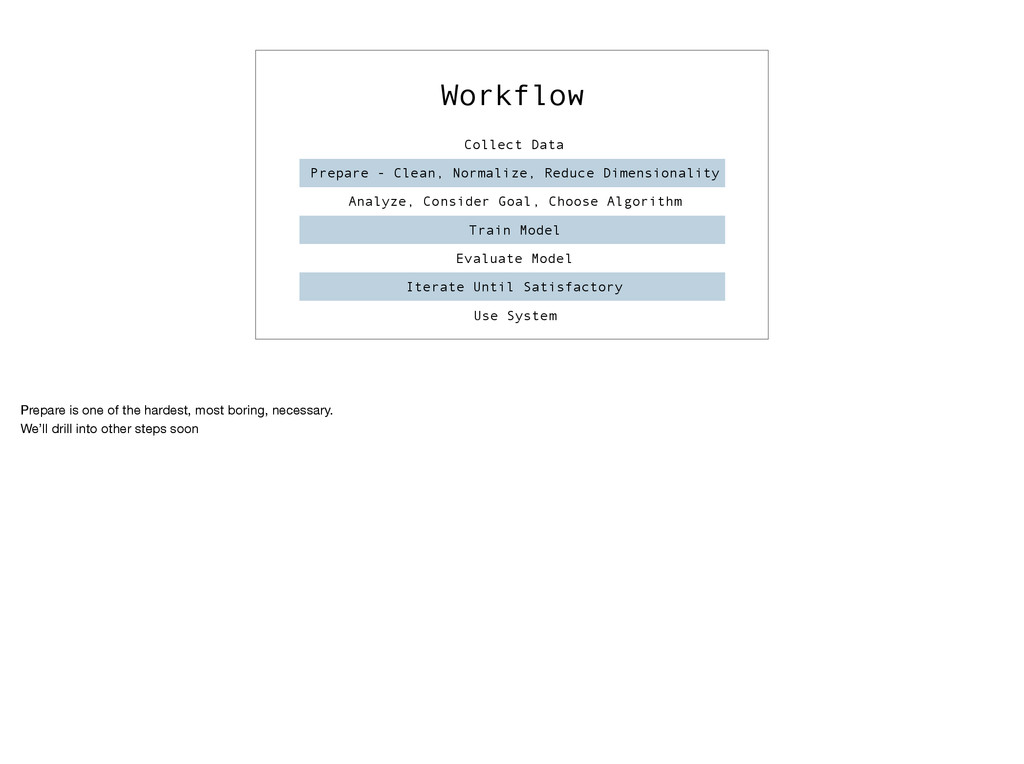
Consider Goal, Choose Algorithm Train Model Evaluate Model Iterate Until Satisfactory Use System Prepare is one of the hardest, most boring, necessary. We’ll drill into other steps soon
full of jargon. Features, output/target variable/gold standard/label, categorical/nominal/qualitative data, continuous/quantitative data, Race finish places: Qualitative or quantitative? examples, classification, two class data
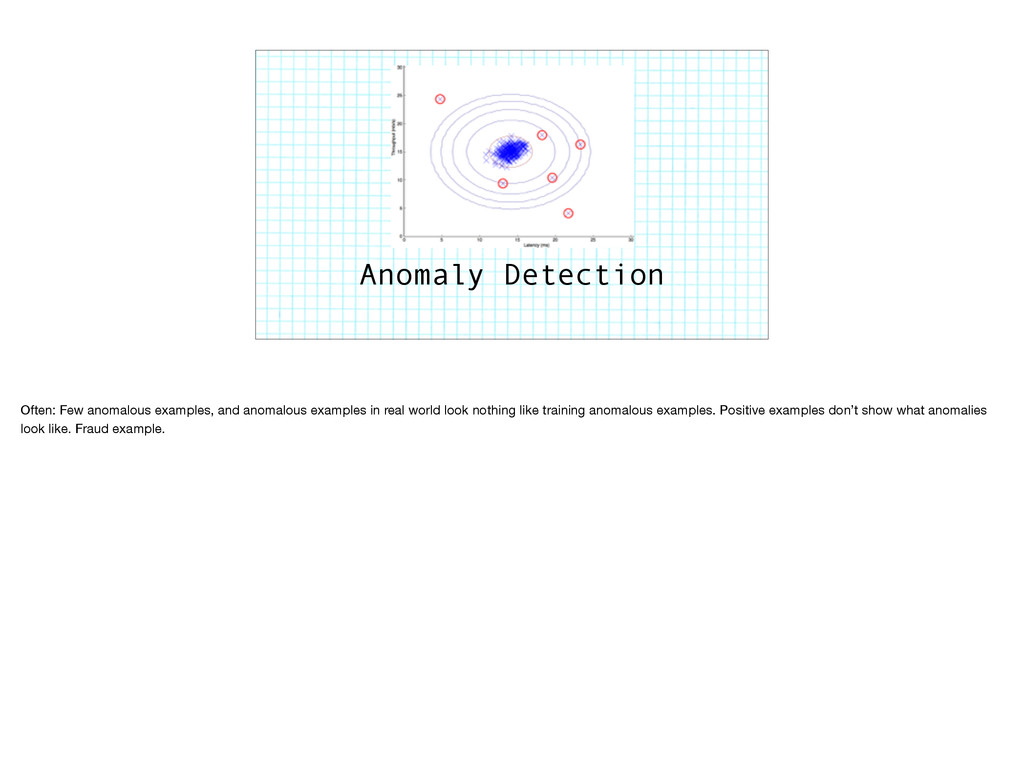
influence choice of anomaly detection algorithm. Will discuss anomaly detection later. For some problems it’s better to have a false positive than a false negative, or vice versa.
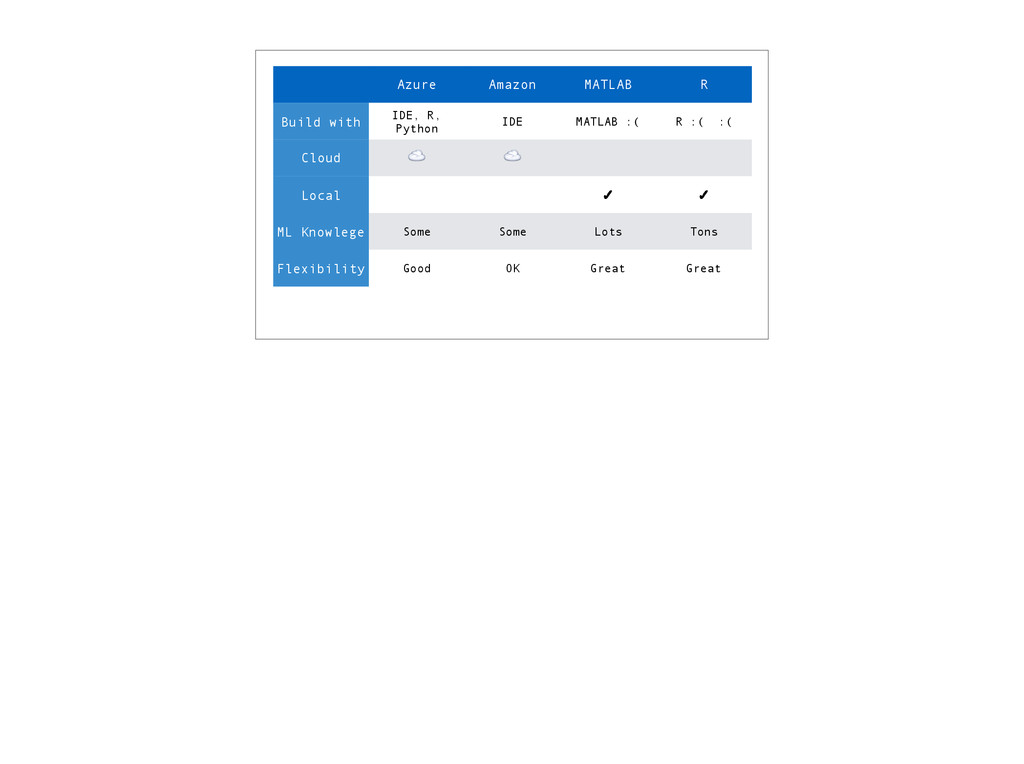
pipeline. Lots of work! Can be quite complicated, as with CV/NLP. This is an NLP experiment. TF-IDF = Term Frequency-Inverse Document Frequency. Eliminate or synthesize missing values Standardize format Standardize: E.g., convert images to similar size “Out of the box” solutions for this tend to be weaker/inflexible
Test Set Training Validation Test For supervised learning, we often partition/sample data Training set: Adjust weights/parameters [Cross] Validation set: Minimize overfitting, choose algorithm. Test set: Test final system. Omitted in simple examples.
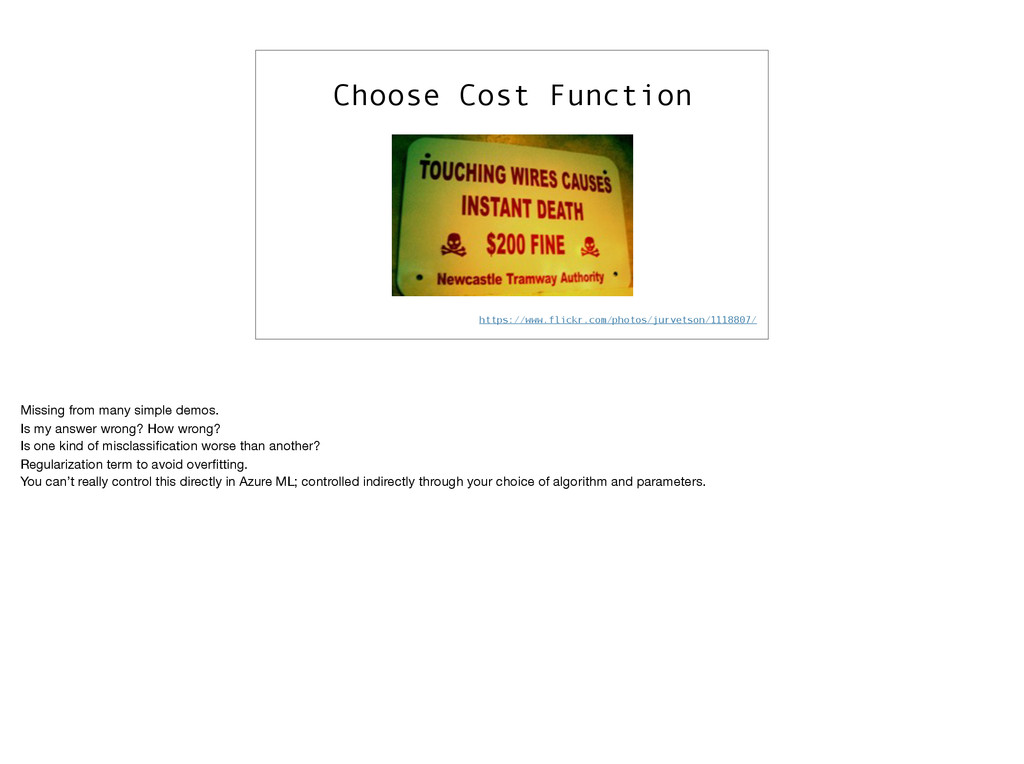
my answer wrong? How wrong? Is one kind of misclassification worse than another? Regularization term to avoid overfitting. You can’t really control this directly in Azure ML; controlled indirectly through your choice of algorithm and parameters.
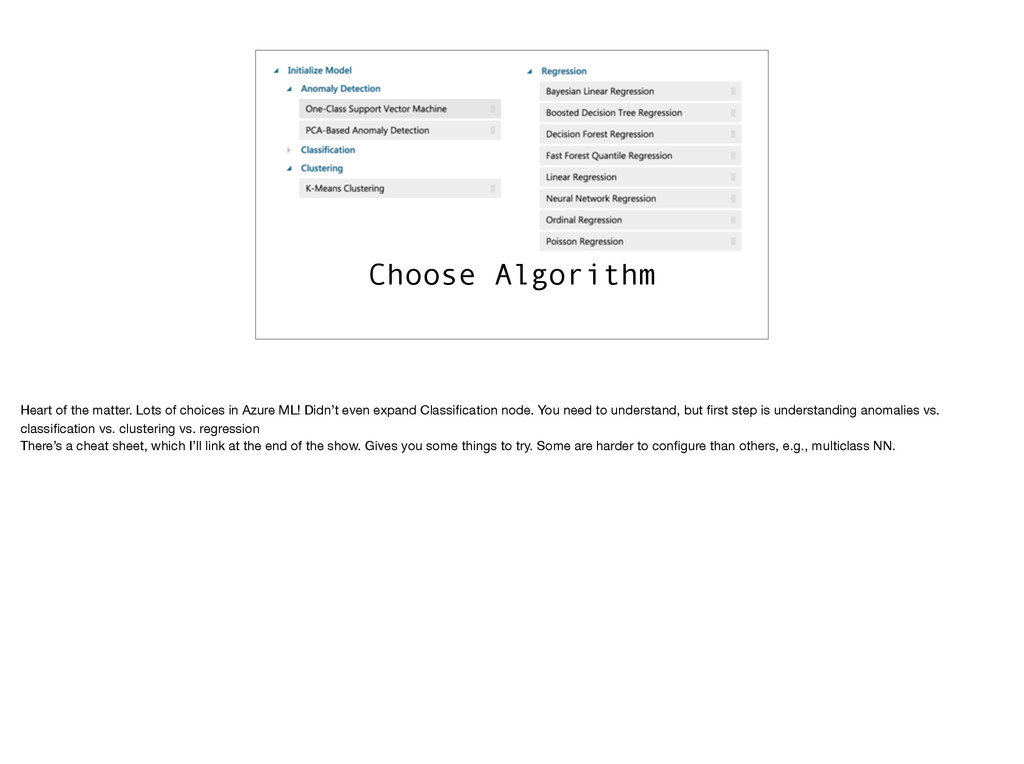
Azure ML! Didn’t even expand Classification node. You need to understand, but first step is understanding anomalies vs. classification vs. clustering vs. regression There’s a cheat sheet, which I’ll link at the end of the show. Gives you some things to try. Some are harder to configure than others, e.g., multiclass NN.
is a decision tree to predict Titanic survivors (two class). Decision tree is interesting because it gives you insight into the structure of your data. Many ML algorithms like NN really don’t. Regression and categorization are supervised learning. Pop quiz, what are the features here? (sibsp = # of siblings or spouses) #s under leaf: P(survival), %observations in leaf.
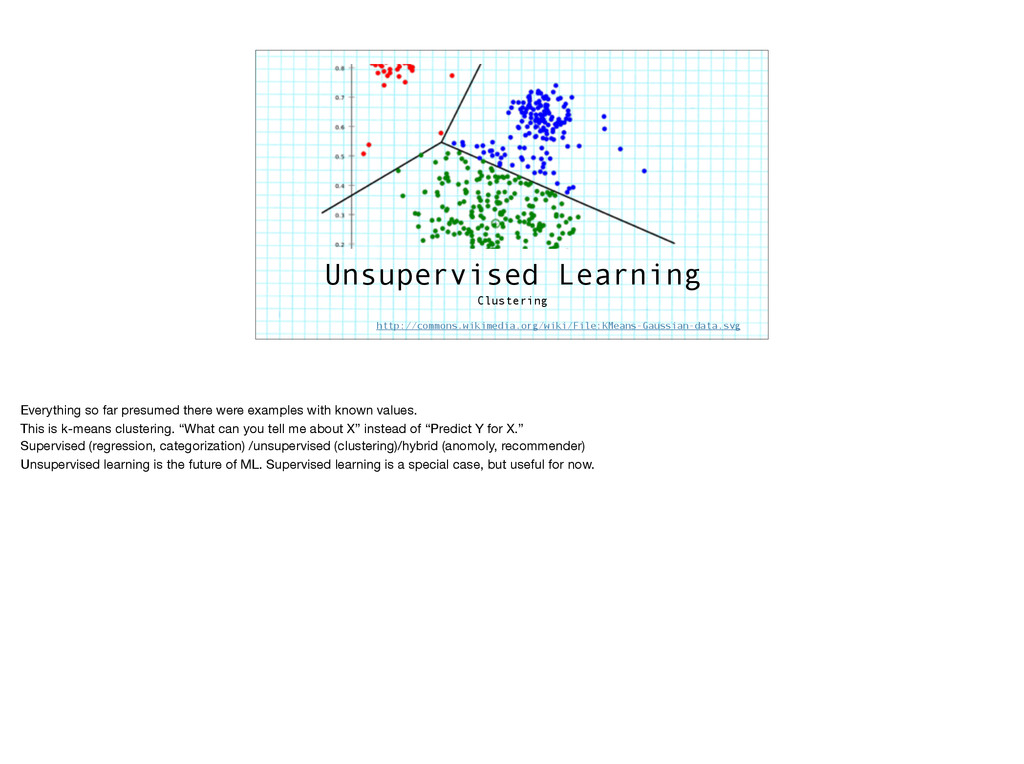
examples with known values. This is k-means clustering. “What can you tell me about X” instead of “Predict Y for X.” Supervised (regression, categorization) /unsupervised (clustering)/hybrid (anomoly, recommender) Unsupervised learning is the future of ML. Supervised learning is a special case, but useful for now.
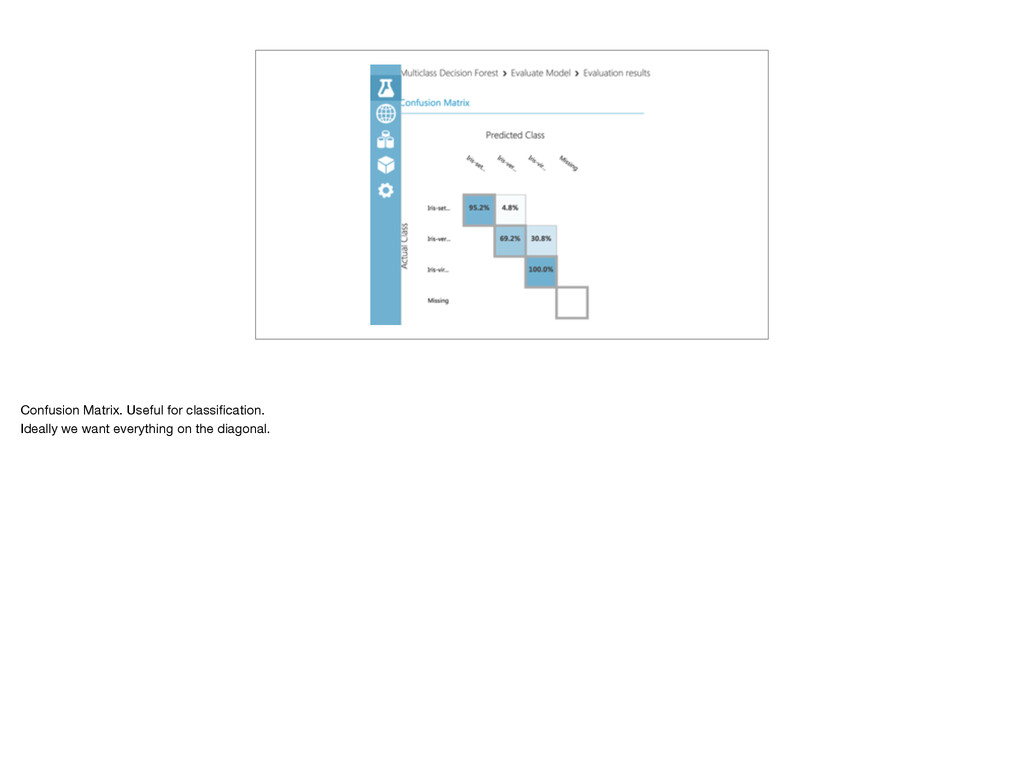
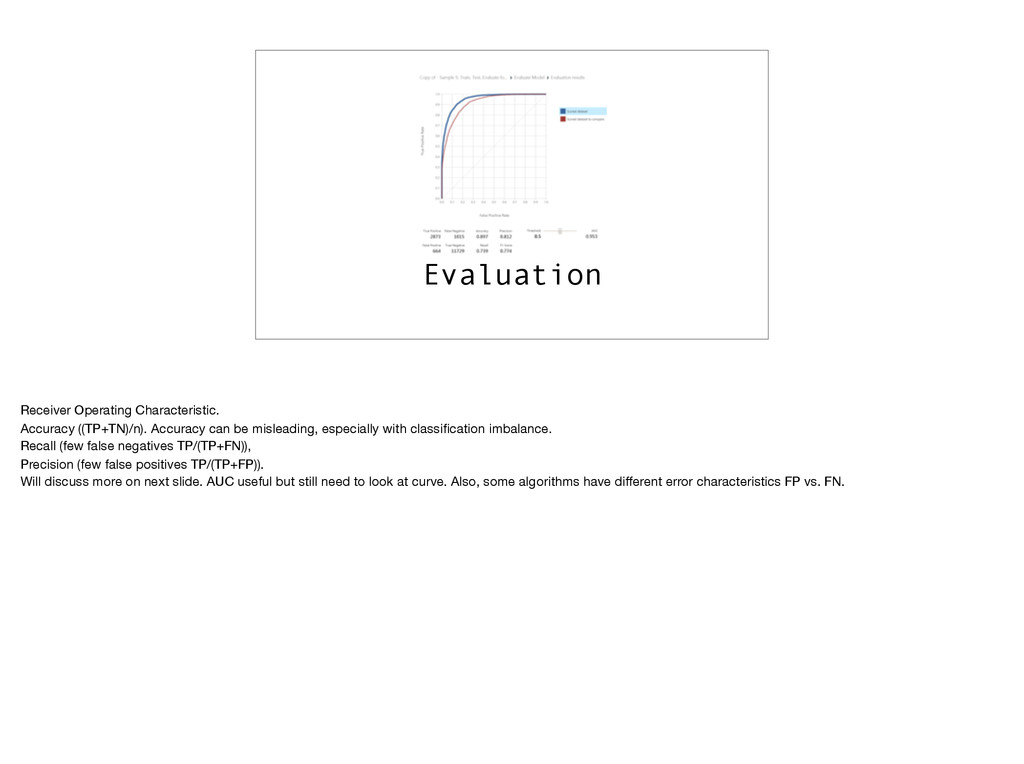
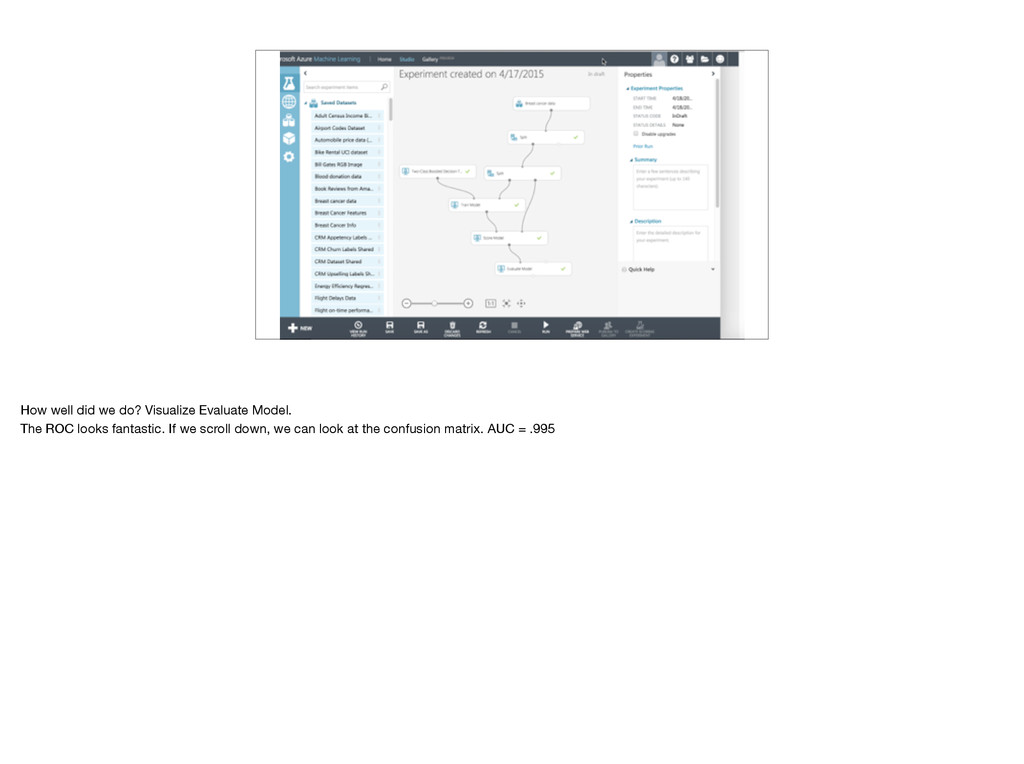
especially with classification imbalance. Recall (few false negatives TP/(TP+FN)), Precision (few false positives TP/(TP+FP)). Will discuss more on next slide. AUC useful but still need to look at curve. Also, some algorithms have different error characteristics FP vs. FN.
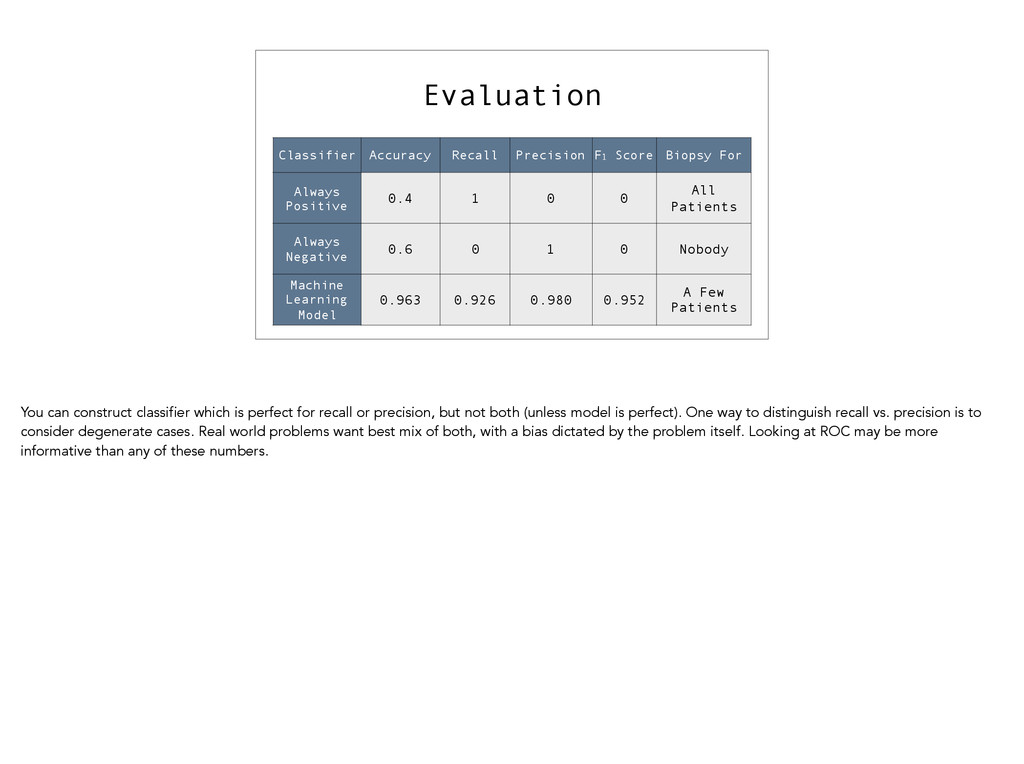
Positive 0.4 1 0 0 All Patients Always Negative 0.6 0 1 0 Nobody Machine Learning Model 0.963 0.926 0.980 0.952 A Few Patients You can construct classifier which is perfect for recall or precision, but not both (unless model is perfect). One way to distinguish recall vs. precision is to consider degenerate cases. Real world problems want best mix of both, with a bias dictated by the problem itself. Looking at ROC may be more informative than any of these numbers.
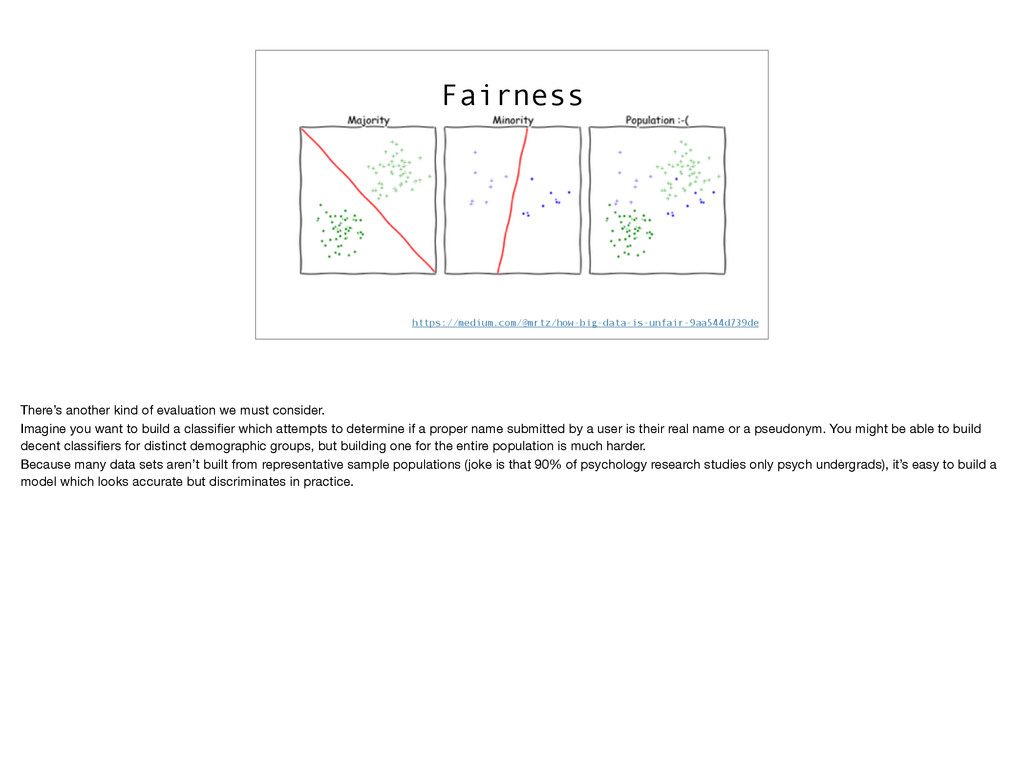
Imagine you want to build a classifier which attempts to determine if a proper name submitted by a user is their real name or a pseudonym. You might be able to build decent classifiers for distinct demographic groups, but building one for the entire population is much harder. Because many data sets aren’t built from representative sample populations (joke is that 90% of psychology research studies only psych undergrads), it’s easy to build a model which looks accurate but discriminates in practice.
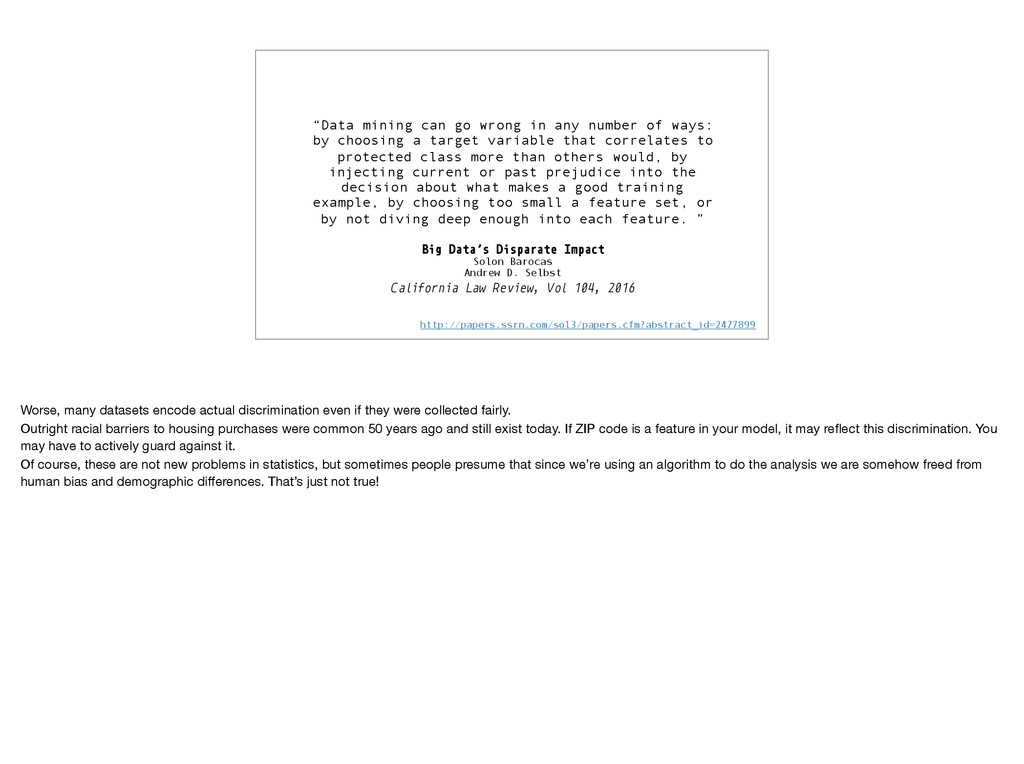
Law Review, Vol 104, 2016 “Data mining can go wrong in any number of ways: by choosing a target variable that correlates to protected class more than others would, by injecting current or past prejudice into the decision about what makes a good training example, by choosing too small a feature set, or by not diving deep enough into each feature. ” http://papers.ssrn.com/sol3/papers.cfm?abstract_id=2477899 Worse, many datasets encode actual discrimination even if they were collected fairly. Outright racial barriers to housing purchases were common 50 years ago and still exist today. If ZIP code is a feature in your model, it may reflect this discrimination. You may have to actively guard against it. Of course, these are not new problems in statistics, but sometimes people presume that since we’re using an algorithm to do the analysis we are somehow freed from human bias and demographic differences. That’s just not true!
theory, let’s put it into practice. This is going to be a whirlwind tour. Many features we won’t cover. Target audience: Data scientists. Removes need to implement ML algorithms, but still must understand what they do.
then sell them. • Machine learning “IDE” • Algorithms from Xbox, Bing, and more • First class R and Python support • Data from SQL Azure, Hive, web, published web service Features
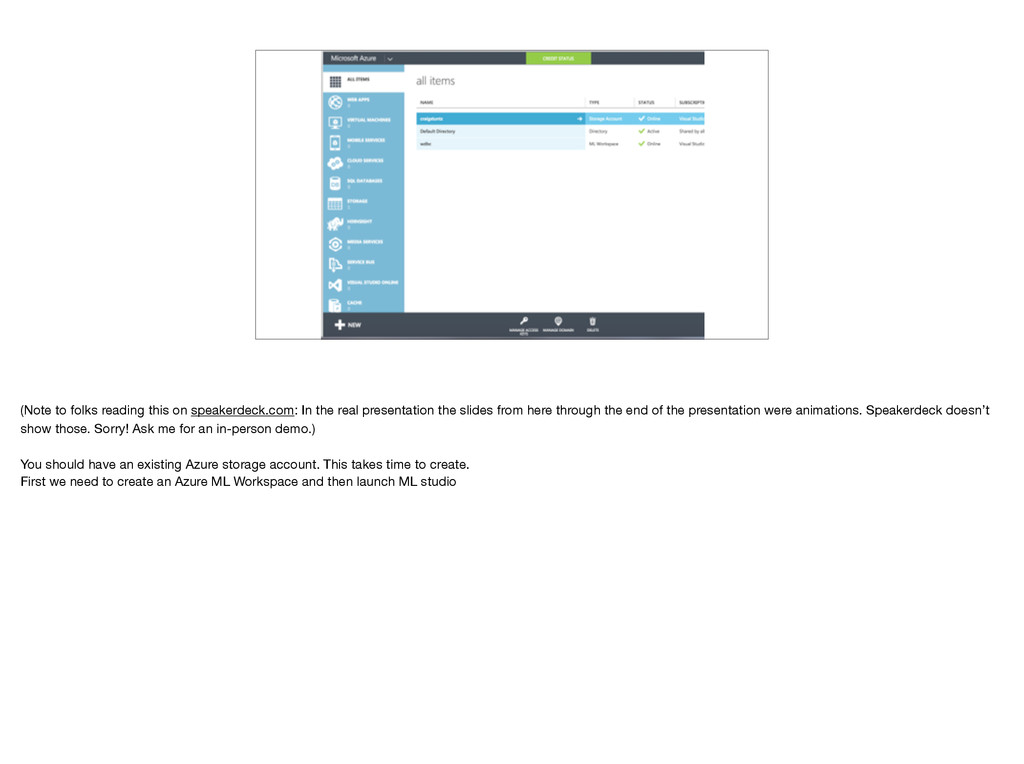
presentation the slides from here through the end of the presentation were animations. Speakerdeck doesn’t show those. Sorry! Ask me for an in-person demo.) You should have an existing Azure storage account. This takes time to create. First we need to create an Azure ML Workspace and then launch ML studio
presentation the slides from here through the end of the presentation were animations. Speakerdeck doesn’t show those. Sorry! Ask me for an in-person demo.) You should have an existing Azure storage account. This takes time to create. First we need to create an Azure ML Workspace and then launch ML studio
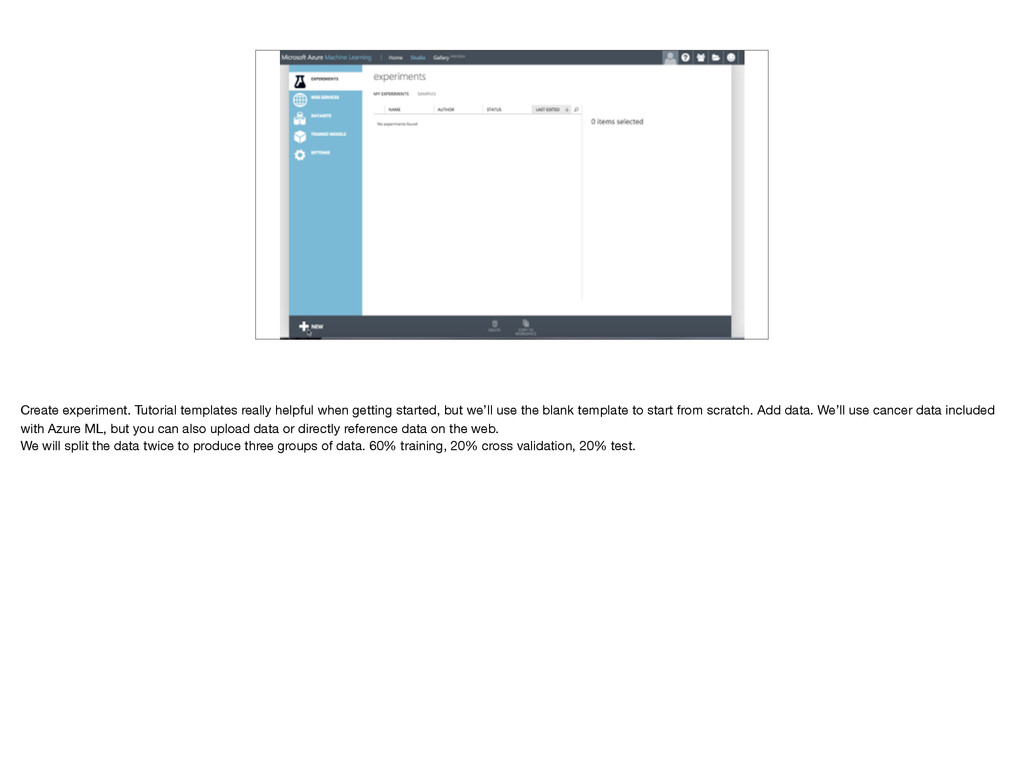
we’ll use the blank template to start from scratch. Add data. We’ll use cancer data included with Azure ML, but you can also upload data or directly reference data on the web. We will split the data twice to produce three groups of data. 60% training, 20% cross validation, 20% test.
we’ll use the blank template to start from scratch. Add data. We’ll use cancer data included with Azure ML, but you can also upload data or directly reference data on the web. We will split the data twice to produce three groups of data. 60% training, 20% cross validation, 20% test.
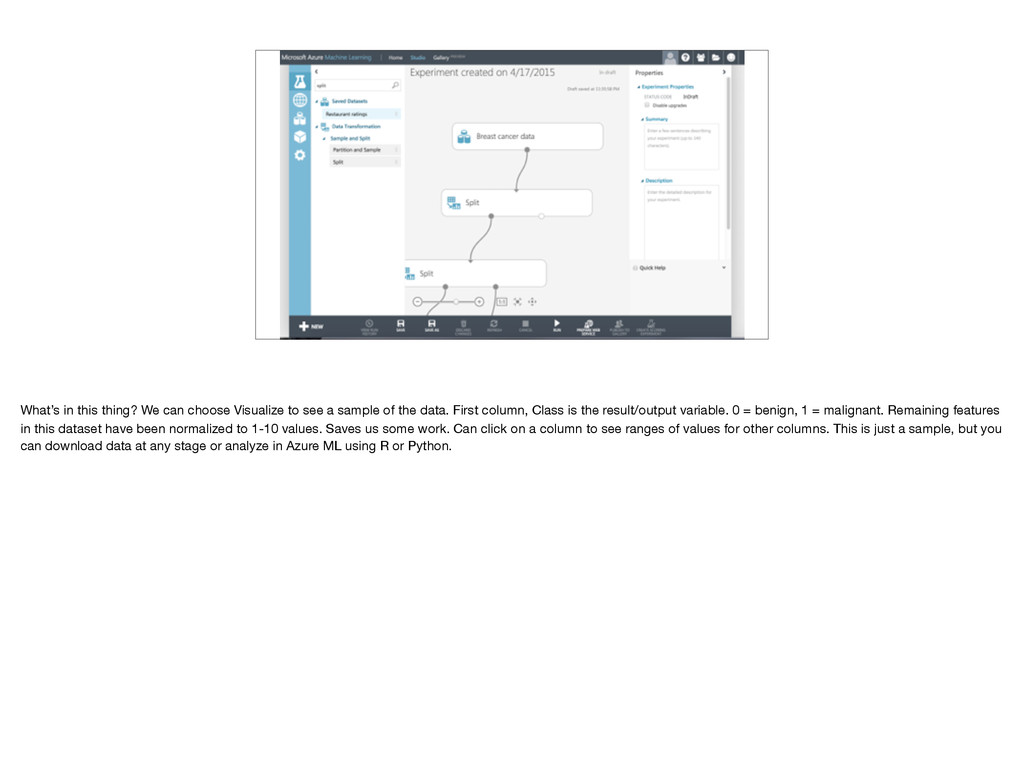
a sample of the data. First column, Class is the result/output variable. 0 = benign, 1 = malignant. Remaining features in this dataset have been normalized to 1-10 values. Saves us some work. Can click on a column to see ranges of values for other columns. This is just a sample, but you can download data at any stage or analyze in Azure ML using R or Python.
a sample of the data. First column, Class is the result/output variable. 0 = benign, 1 = malignant. Remaining features in this dataset have been normalized to 1-10 values. Saves us some work. Can click on a column to see ranges of values for other columns. This is just a sample, but you can download data at any stage or analyze in Azure ML using R or Python.
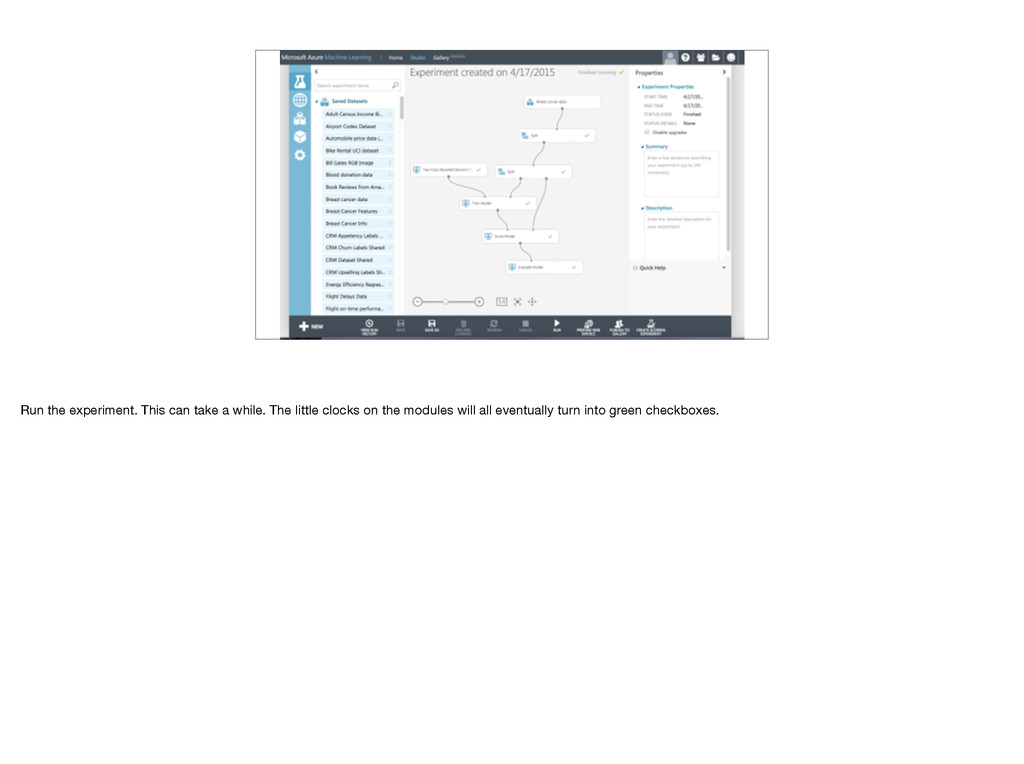
room. Have to choose an algorithm. We need a two class algorithm, and I’ll start with a decision tree. We can just drop it into the workspace, but it’s untrained. Add Train model and connect algorithm and training data. Have to tell Train model what we’re trying to predict. Launch column selector, choose Class. We want to compare those predictions with known correct answers in cross validation data set, so add score model and connect to cross validation data. Add evaluate model to graph results. Haven’t used test data yet! Does it make sense what all these do? Stop me now! Important: Cross validation set not used for training, so not biased by training data.
room. Have to choose an algorithm. We need a two class algorithm, and I’ll start with a decision tree. We can just drop it into the workspace, but it’s untrained. Add Train model and connect algorithm and training data. Have to tell Train model what we’re trying to predict. Launch column selector, choose Class. We want to compare those predictions with known correct answers in cross validation data set, so add score model and connect to cross validation data. Add evaluate model to graph results. Haven’t used test data yet! Does it make sense what all these do? Stop me now! Important: Cross validation set not used for training, so not biased by training data.
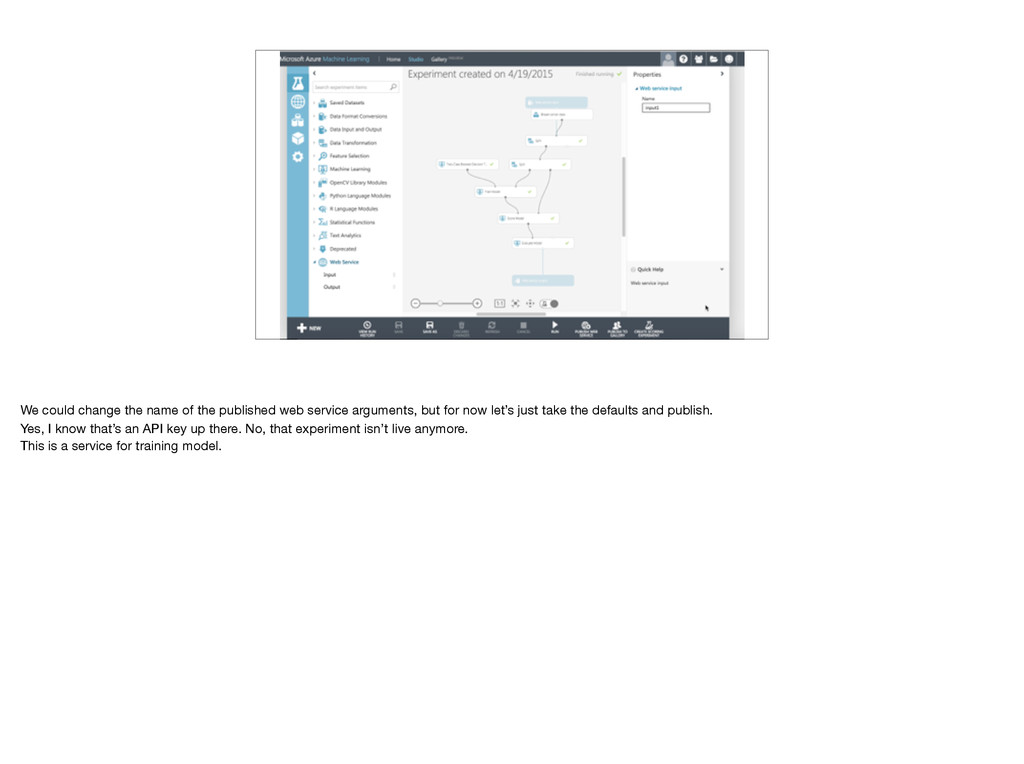
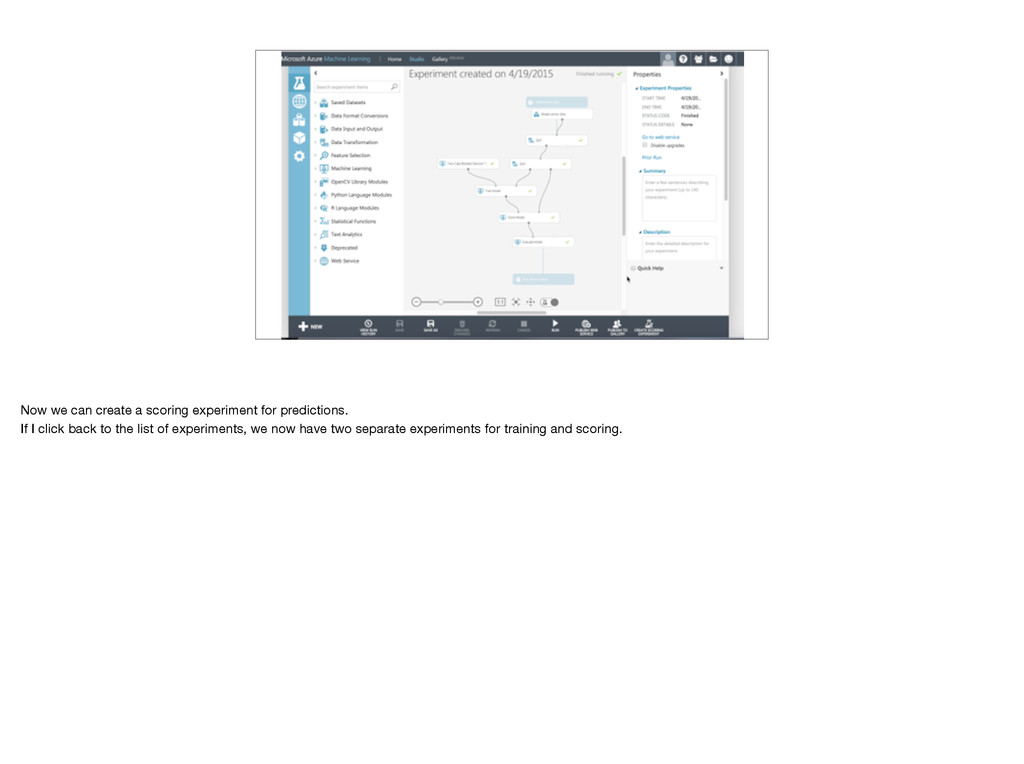
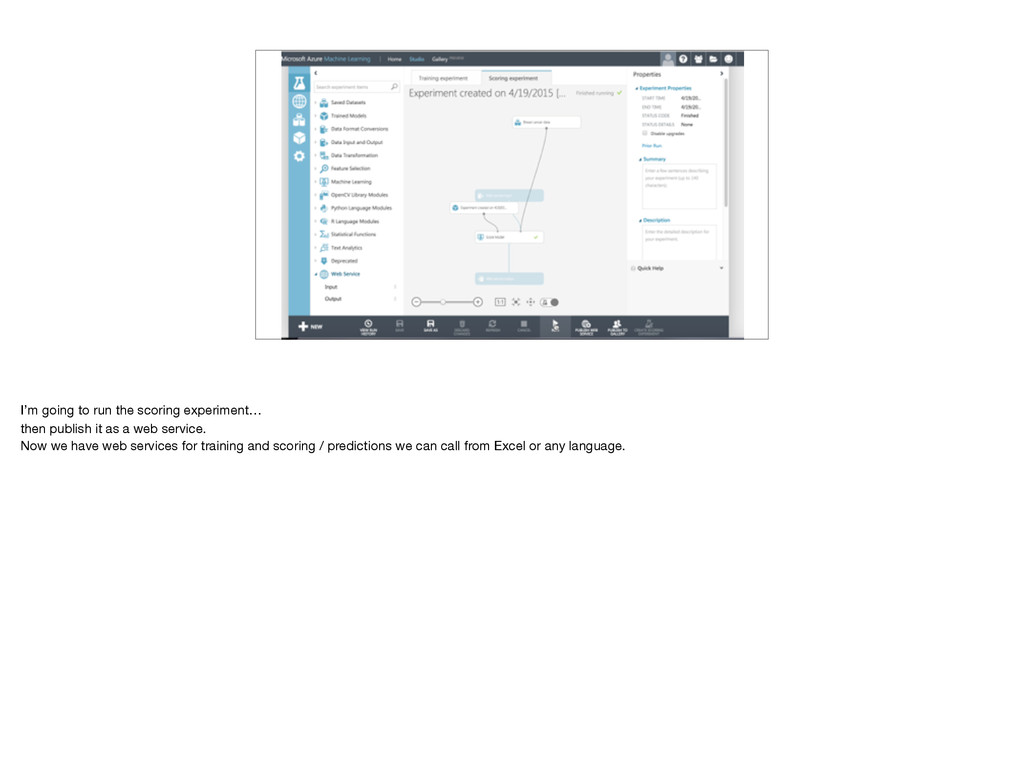
arguments, but for now let’s just take the defaults and publish. Yes, I know that’s an API key up there. No, that experiment isn’t live anymore. This is a service for training model.
arguments, but for now let’s just take the defaults and publish. Yes, I know that’s an API key up there. No, that experiment isn’t live anymore. This is a service for training model.
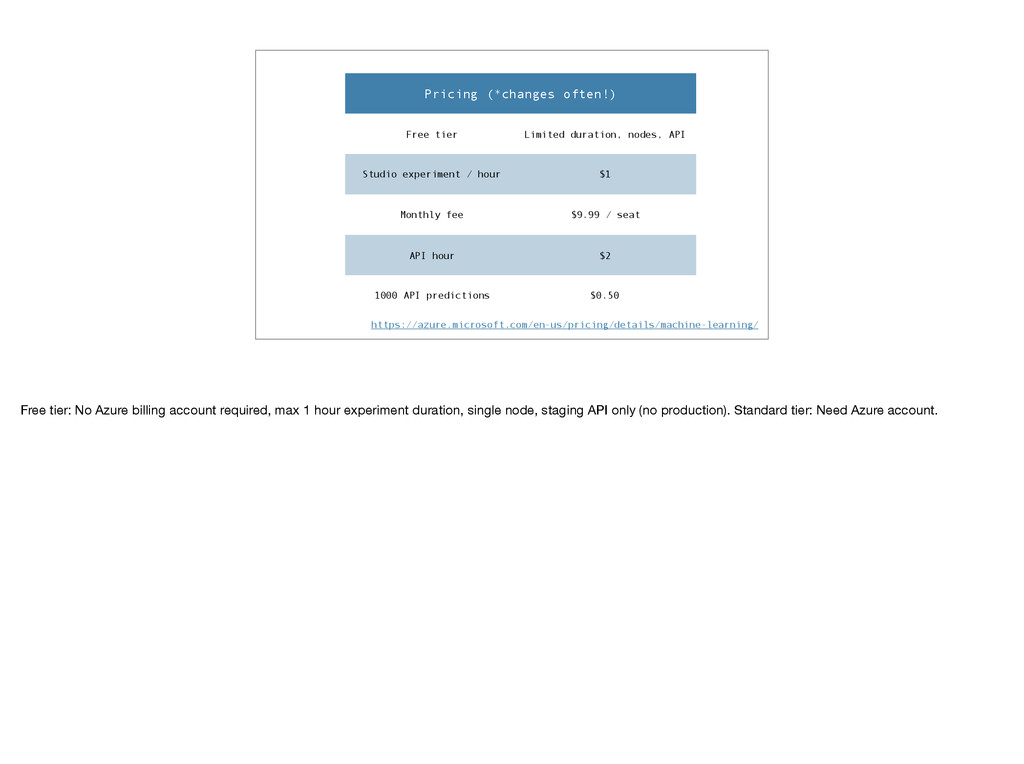
Studio experiment / hour $1 Monthly fee $9.99 / seat API hour $2 1000 API predictions $0.50 https://azure.microsoft.com/en-us/pricing/details/machine-learning/ Free tier: No Azure billing account required, max 1 hour experiment duration, single node, staging API only (no production). Standard tier: Need Azure account.
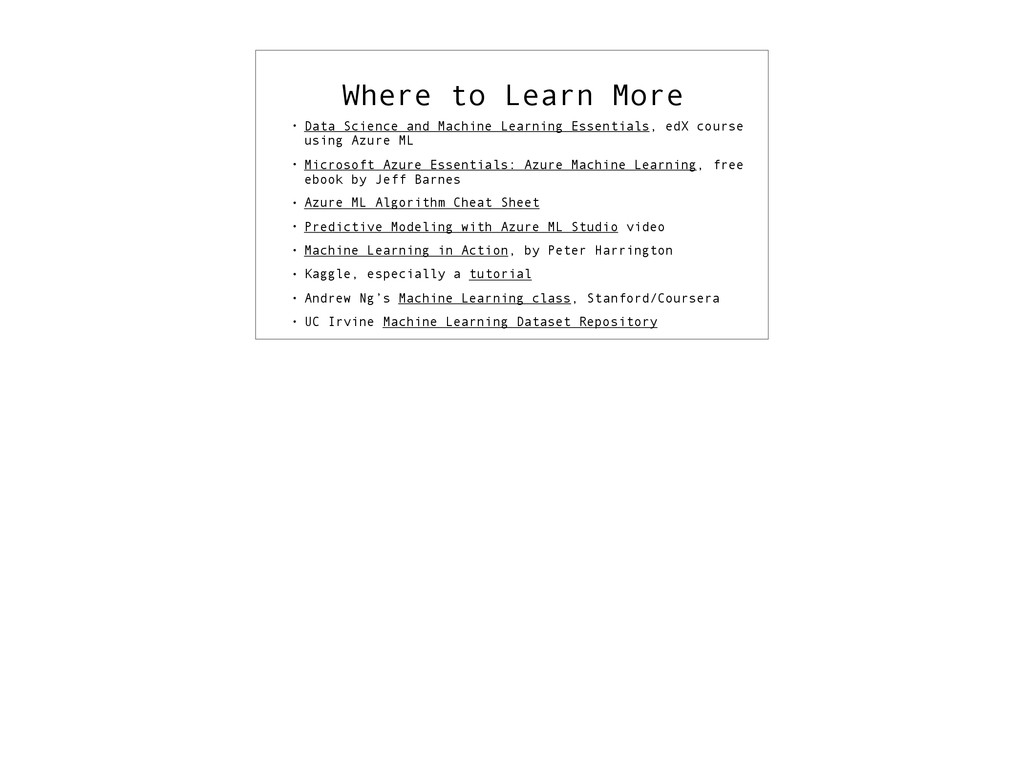
Essentials, edX course using Azure ML • Microsoft Azure Essentials: Azure Machine Learning, free ebook by Jeff Barnes • Azure ML Algorithm Cheat Sheet • Predictive Modeling with Azure ML Studio video • Machine Learning in Action, by Peter Harrington • Kaggle, especially a tutorial • Andrew Ng’s Machine Learning class, Stanford/Coursera • UC Irvine Machine Learning Dataset Repository
![Data Sets • Training Set • [Cross] Validation Set •](https://files.speakerdeck.com/presentations/30581a565c684b32af1262aba90e224d/slide_18.jpg)
![Craig Stuntz @CraigStuntz [email protected] http://blogs.teamb.com/craigstuntz http://www.meetup.com/Papers-We-Love-Columbus/ If you want to](https://files.speakerdeck.com/presentations/30581a565c684b32af1262aba90e224d/slide_60.jpg)