Upgrade to Pro — share decks privately, control downloads, hide ads and more …

Electricity consumption and household characteristics: Implications for census-taking in a smart metered future

Ben Anderson
September 09, 2015

Electricity consumption and household characteristics: Implications for census-taking in a smart metered future

Paper presented at RSS2015 session on the future of the Census. Some animations may not work so well on SpeakerDeck.
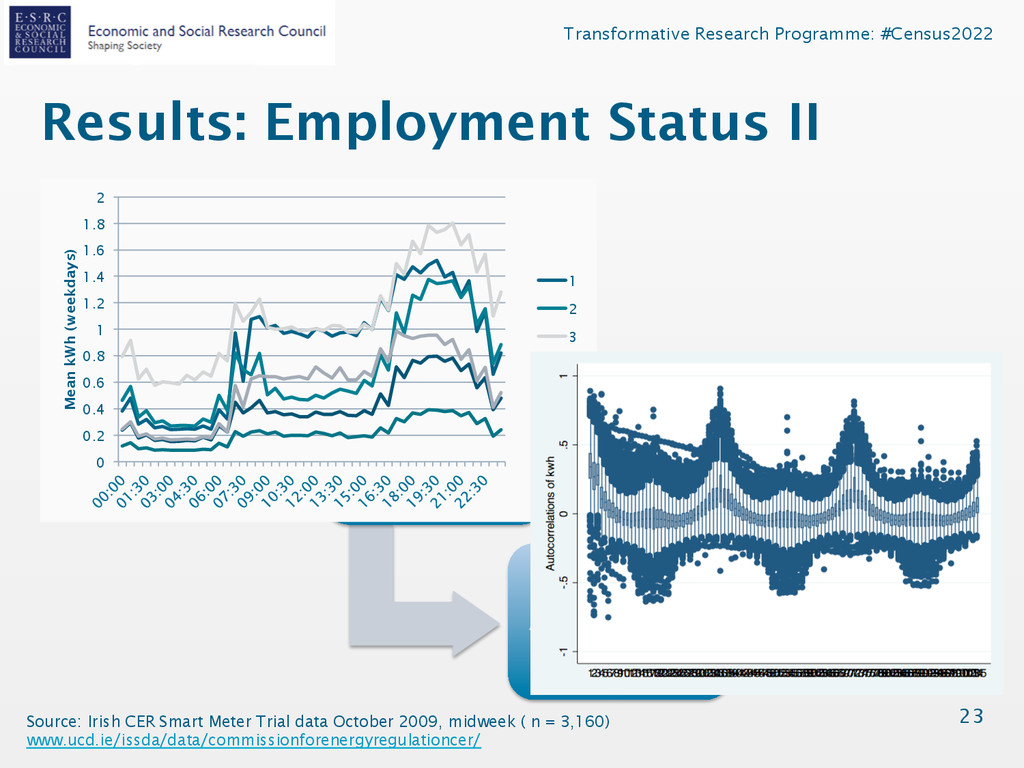
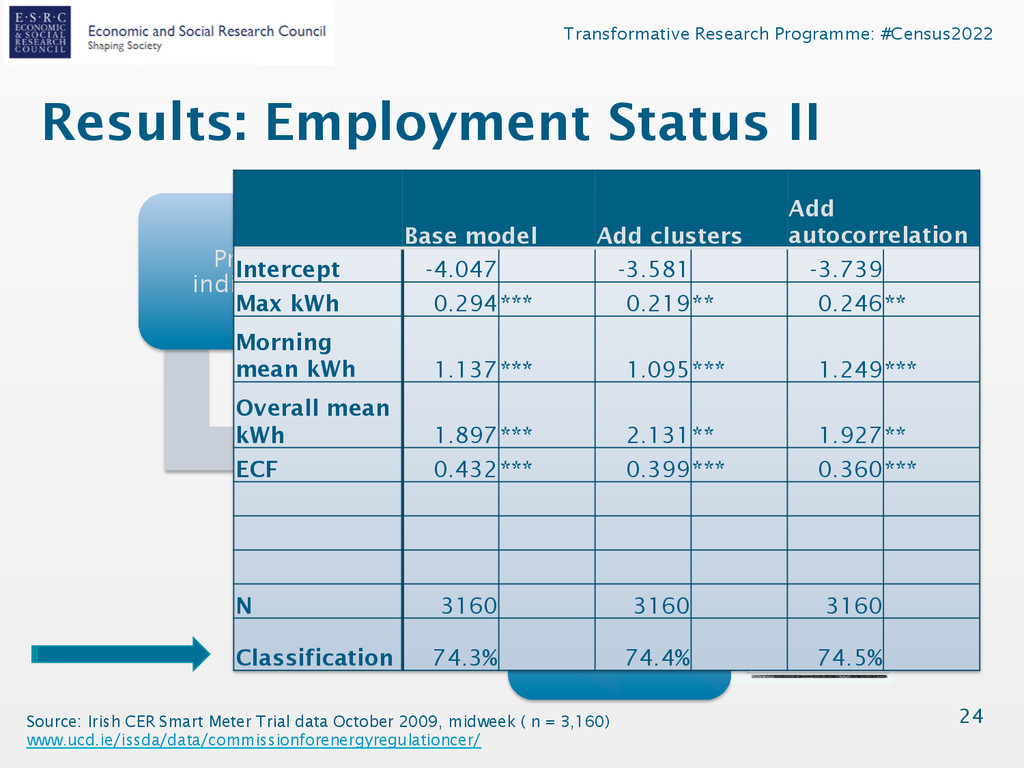
Anderson, B., Lin, X. and Newing, A. (2015) Electricity consumption and household characteristics: Implications for census-taking in a smart metered future. Contributed paper, Royal Statistical Society International Conference 2015, Univesity of Exeter, 9/9/2015 .

Ben Anderson

September 09, 2015
Tweet

More Decks by Ben Anderson

Other Decks in Research

Transcript

  1. Electricity consumption and household characteristics: Implications for census-taking in a

    smart metered future Sharon Lin ([email protected]) Ben Anderson ([email protected], @dataknut) Engineering & Environment (Energy & Climate Change)
  2. Transformative Research Programme: #Census2022 Background • Timeliness & cost • Indicators UK

    Census evolution • Finding new ways to deliver the Census – ‘Census-like’ Challenges • New kinds of data • New kinds of social indicators - ‘Census-plus’ • More frequently • New data ‘markets’ Opportunities 3 Beyond 2011: Admini Aggregate Data Martin Ralphs, Meghan Elkin, Sim Huynh Background The Office for National Statistics population and small area socio-d Programme has been established way forward to meet future user n Improvements in technology a modernise the existing census p already held within government relatively well understood most o by better re-use of ‘administrative The final recommendation, whic Beyond 2011 Beyond 2011: Administrative Data Models - Research Using Aggregate Data Martin Ralphs, Meghan Elkin, Simon Whitworth, Jennifer Wall, Domenica Rasulo and Jennifer Huynh Background The Office for National Statistics is currently taking a fresh look at options for the production of population and small area socio-demographic statistics for England and Wales. The Beyond 2011 Programme has been established to carry out research on the options and to recommend the best way forward to meet future user needs. Improvements in technology and administrative data sources offer opportunities to either modernise the existing census process, or to develop an alternative by re-using existing data already held within government. Since methods for taking the traditional census are already relatively well understood most of the research is focussing on how surveys can be supplemented
  3. Transformative Research Programme: #Census2022 Special interest: Electricity • Unlike gas (c.

    90%) Near universal availability • Unlike gas (c. 85%) Near universal uptake • Unlike water (c. 45%) 100% metered 4
  4. Transformative Research Programme: #Census2022 Inspiration I: Census-like 5 Census 2011

    household level variables* Existing evidence for links to load profiles Household Number of persons (Beckel et al., 2013) Presence of person with limiting long term illness Number of children (Yohanis et al., 2008) Age distributions of all persons Dwelling Household dwelling type (Firth et al., 2008; McLoughlin et al., 2012) Household tenure (Druckman and Jackson, 2008) Number of (bed)rooms dwelling floor area as a proxy Number of cars/vans Presence of and fuel used for heating (McLoughlin et al., 2013) Householder Ethnic group/country of birth of HRP/main language Age of HRP (McLoughlin et al., 2013) NS-SEC of household reference person (HRP) (Druckman and Jackson, 2008; Hughes and Moreno, 2013; McLoughlin et al., 2013) Economic activity of HRP/hours worked (Yohanis et al., 2008; McLoughlin et al., 2013) HRP Education level Marital Status * Taken from ONS. 2014a. 2011 Census User Guide - 2011 Census Variable and Classification Information: Part 3. Newport: Office for National Statistics. Using ‘profile indicators’
  5. Transformative Research Programme: #Census2022 Inspiration II: Census-plus 6 * Taken

    from ONS. 2014a. 2011 Census User Guide - 2011 Census Variable and Classification Information: Part 3. Newport: Office for National Statistics. Census-plus indicators Existing evidence for links to load profiles Other Dwelling floor area (Beckel et al., 2013; Craig et al., 2014; McLoughlin et al., 2013) Household Income (Beckel et al., 2013; Craig et al., 2014; McLoughlin et al., 2013) Consumption profile segments Haben et al (2013) Indicators of routine ? Using ‘profile indicators’
  6. Transformative Research Programme: #Census2022 Inspiration III: Data 7 Weekdays Weekends

    Source: Irish CER Smart Meter Trial data October 2009 ( n = 3,488) www.ucd.ie/issda/data/commissionforenergyregulationcer/ 0 0.2 0.4 0.6 0.8 1 1.2 00:00:00 01:30:00 03:00:00 04:30:00 06:00:00 07:30:00 09:00:00 10:30:00 12:00:00 13:30:00 15:00:00 16:30:00 18:00:00 19:30:00 21:00:00 22:30:00 Mean kwh (October 2009) 0 0.2 0.4 0.6 0.8 1 1.2 00:00:00 01:30:00 03:00:00 04:30:00 06:00:00 07:30:00 09:00:00 10:30:00 12:00:00 13:30:00 15:00:00 16:30:00 18:00:00 19:30:00 21:00:00 22:30:00 Mean kwh (October 2009) In work Unemployed Caring for family/ relative Retired
  7. Transformative Research Programme: #Census2022 Research Pathway Sample data • ‘Labeled’ consumption

    • Models Large sample • ‘Unlabeled’ consumption • Geo-coded Validate • Using Census 2011 LSOA/ OA data 8 This project
  8. Transformative Research Programme: #Census2022 ‘Smart Meter’ Datasets • UoS Energy Study

    (n = 180) • Irish CER Smart Meter Trial (n = 4,000) • Energy Demand Reduction Project (n= 14,000) ‘Labelled’ data • ? ‘Unlabelled’ but geocoded data 9
  9. Transformative Research Programme: #Census2022 ‘Smart Meter’ Datasets • UoS Energy Study

    (n ~= 180) • Irish CER Smart Meter Trial (n ~= 4,000) ‘Labelled’ data • Energy Demand Reduction Project (n ~= 14,000) ‘Unlabelled’ and non-geocoded • ? ‘Unlabelled’ but geocoded data 10
  10. Transformative Research Programme: #Census2022 CER Irish Smart Meter Trials 11

    Sample Method unclear N = ~ 4,000 Geography unknown Study groups Trial & control Surveys Pre (2009) Post (2010) Electricity kWh per half hour for 24months
  11. Transformative Research Programme: #Census2022 Processing & Cleaning 12 Analytic sample

    October 2009 – 5.6 million ½ hour records October 2009 Outliers Non- domestic 157 million ½ hour records
  12. Transformative Research Programme: #Census2022 Profile indicators 13 Simplification Peak: • Magnitude

    • Timing of peak Baseload consumption Overall mean consumption Daily sum 97.5th percentile Ratio of evening peak mean to non- evening peak mean (ECF) Ratio of daily mean to peak (LF)
  13. Transformative Research Programme: #Census2022 Characteristics of interest • Income • Floor area

    • Employment status Census-like: • Number of residents • Presence of children Given that we know: 14 DWP, HMRC, NHS etc
  14. Transformative Research Programme: #Census2022 Step1: Profile indicators prediction • October 2009

    Mixed effects model • 3 * 4 =12 repeat observations Mid-week (Tues – Thurs) • 2 * 4 = 8 repeated observations Weekend (Sat & Sun) 15
  15. Transformative Research Programme: #Census2022 Step1: Profile indicators prediction 16 Profile

     indicators  (LHS)   Predictors  (RHS)   Daily  Peak  *me   Income Daily  peak  demand  06:00  to  10.30   Floor area Daily  average  baseload  demand  (02:00  -­‐   05:00)   Employed (response person) Daily  mean  consump*on     Retired (response person) Daily  sum  of  consump*on   [Number of residents] Daily  97.5th  percen*le  consump*on         [Presence of children] Evening  Consump*on  Factor   Load  factor  
  16. Transformative Research Programme: #Census2022 Results: Weekend 17 Daily peak time

      Daily peak 06:00 to 10.30   Daily average baseload (02:00 - 05:00)   Daily average   Daily sum   Daily 97.5th percentile   Evening Consumptio n Factor   Load factor   Number of residents   -   Yes   Yes   Yes   Presence of children   -   Yes   Yes   Yes   Yes   Income   Not when employm ent & floor area included   -   Yes   Not when employm ent included   Not when employm ent included   Not when employmen t & floor area included   -   -   Floor area   -   -   Yes   -   -   -   -   Yes   Employment   -   -   -   -   -   -   -   -   Retired   -   -   -   -   -   -   -   -   Residual   78%   35%   40%   21%   21%   34%   65%   50%   Source: Irish CER Smart Meter Trial data October 2009 ( n = 3,488) www.ucd.ie/issda/data/commissionforenergyregulationcer/
  17. Transformative Research Programme: #Census2022 Results: Midweek 18 Daily peak time

      Daily peak 06:00 to 10.30   Daily average baseloa d (02:00 - 05:00)   Daily average   Daily sum   Daily 97.5th percenti le   Evening Consum ption Factor   Load factor   Number of residents -   Yes   Not when employmen t & floor area included   Yes   Yes   Yes   Presence of children Not when employmen t & floor area included   Yes   Yes   Yes   Yes   Not when employmen t & floor area included   Income -   Not when employme nt included   Yes   Not when employme nt & floor area included   Not when employme nt & floor area included   Not when employme nt & floor area included   -   -   Floor area -   -   -   -   -   -   -   -   Employment -   -   -   -   -   -   Yes   Yes   Retired -   -   -   -   -   -   -   -   Residual 80%   37%   46%   23%   23%   36%   72%   51%   Source: Irish CER Smart Meter Trial data October 2009 ( n = 3,488) www.ucd.ie/issda/data/commissionforenergyregulationcer/
  18. Transformative Research Programme: #Census2022 Step 2: Can we predict attributes?

    • HRP in Employment Logit model • Income • Floor area Linear model • Assume we know n people & n children In both cases 19 DWP, HMRC, NHS etc
  19. Transformative Research Programme: #Census2022 Results: Employment Status I § Midweek: 20

    § Correct classification –  Without ‘energy’ = 65.01% Source: Irish CER Smart Meter Trial data October 2009 ( n = 3,488) www.ucd.ie/issda/data/commissionforenergyregulationcer/
  20. Transformative Research Programme: #Census2022 Results: Employment Status I § Midweek: 21

    § Correct classification –  Without ‘energy’ = 65.01% –  With ‘energy’ = 65.41% ! Source: Irish CER Smart Meter Trial data October 2009 ( n = 3,488) www.ucd.ie/issda/data/commissionforenergyregulationcer/
  21. Transformative Research Programme: #Census2022 Results: Employment Status II Profile indicators

    Profile clusters Autocorrelation 22 Source: Irish CER Smart Meter Trial data October 2009, midweek ( n = 3,160) www.ucd.ie/issda/data/commissionforenergyregulationcer/
  22. Transformative Research Programme: #Census2022 Results: Employment Status II Profile indicators

    Profile clusters Autocorrelation 23 Source: Irish CER Smart Meter Trial data October 2009, midweek ( n = 3,160) www.ucd.ie/issda/data/commissionforenergyregulationcer/ 0 0.2 0.4 0.6 0.8 1 1.2 1.4 1.6 1.8 2 Mean kWh (weekdays) 1 2 3 4 5 6
  23. Transformative Research Programme: #Census2022 Profile indicators Profile clusters Autocorrelation Results:

    Employment Status II 24 Base model   Add clusters   Add autocorrelation   Intercept   -4.047   -3.581   -3.739   Max kWh   0.294  ***   0.219  **   0.246  **   Morning mean kWh   1.137  ***   1.095  ***   1.249  ***   Overall mean kWh   1.897  ***   2.131  **   1.927  **   ECF   0.432  ***   0.399  ***   0.360  ***   N   3160   3160   3160   Classification   74.3%   74.4%   74.5%   Source: Irish CER Smart Meter Trial data October 2009, midweek ( n = 3,160) www.ucd.ie/issda/data/commissionforenergyregulationcer/
  24. Transformative Research Programme: #Census2022 Conclusions • ‘Energy’ may not help much

    If we have admin data • Profile indicators may have value But if we don’t… 25 For the variables tested…
  25. Transformative Research Programme: #Census2022 Research Pathway Sample data • ‘Labeled’ consumption

    • Models Large sample • ‘Unlabeled’ consumption • Geo-coded Validate • Using Census 2011 LSOA/ OA data 26 This project We need