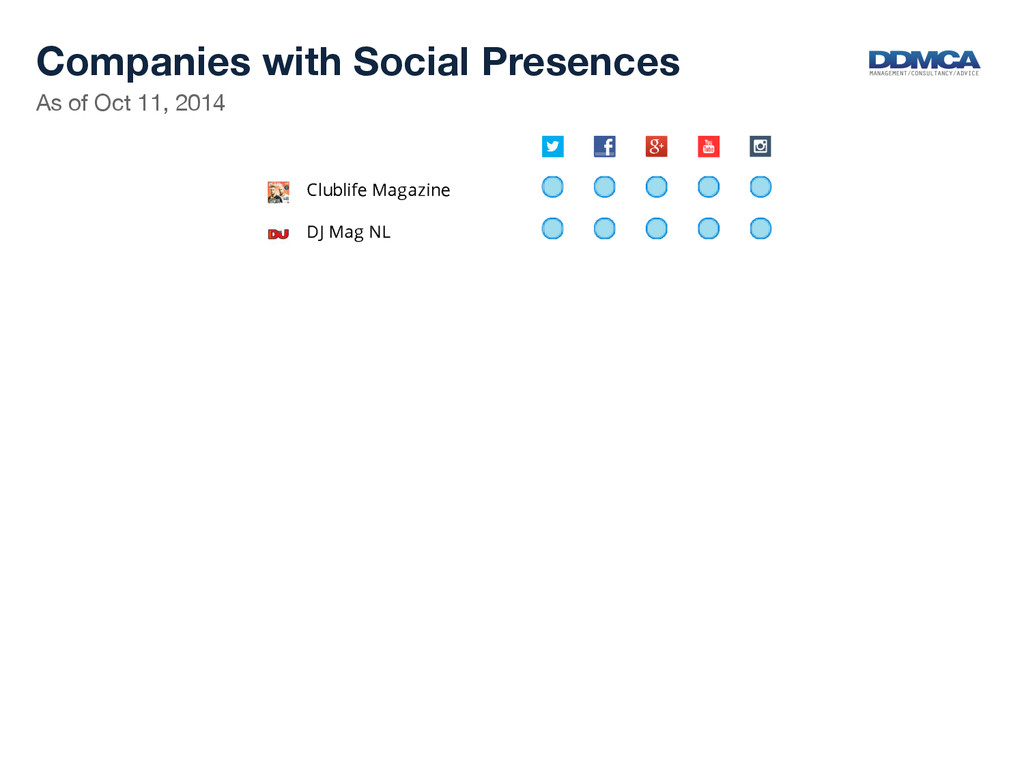
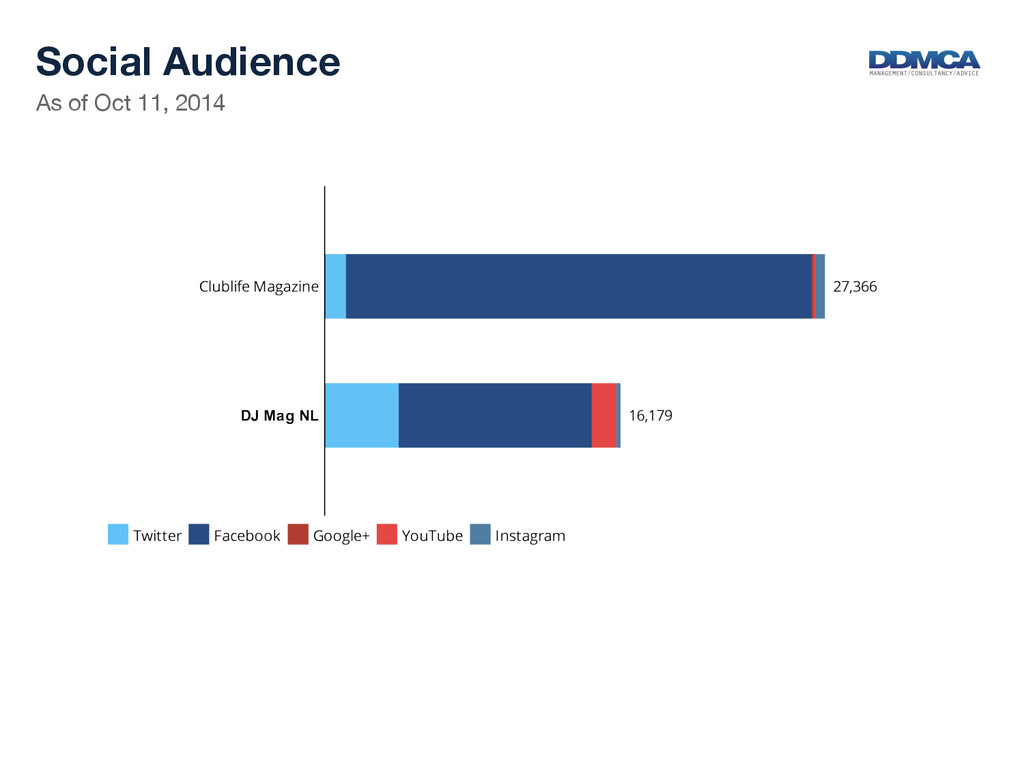
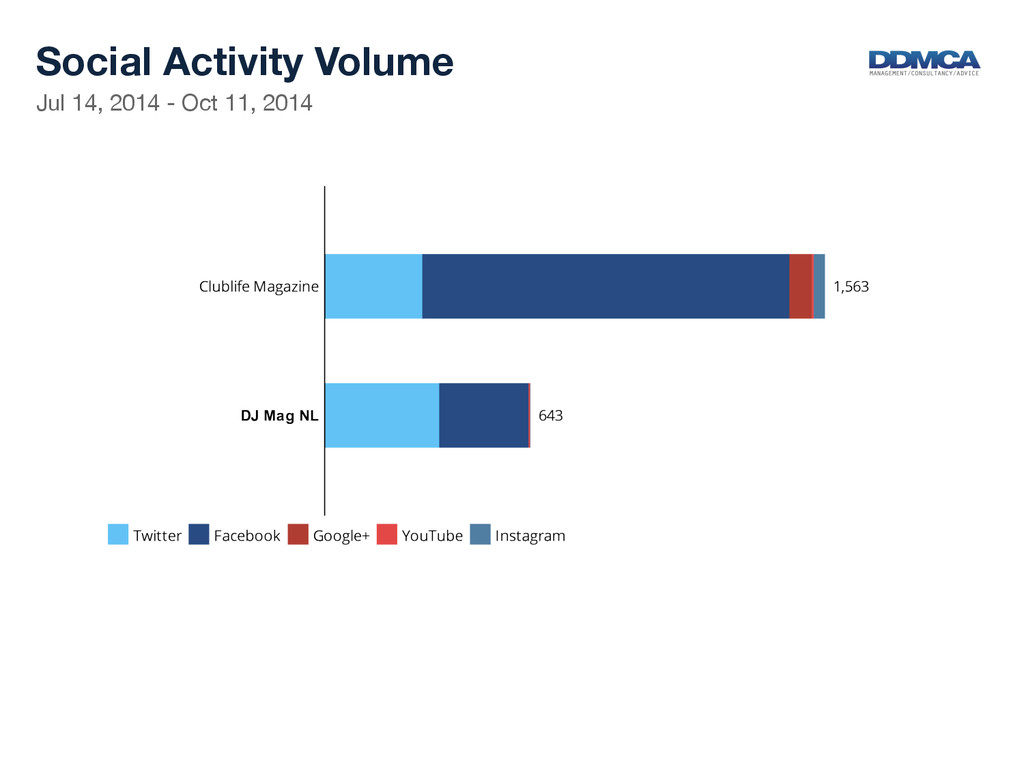
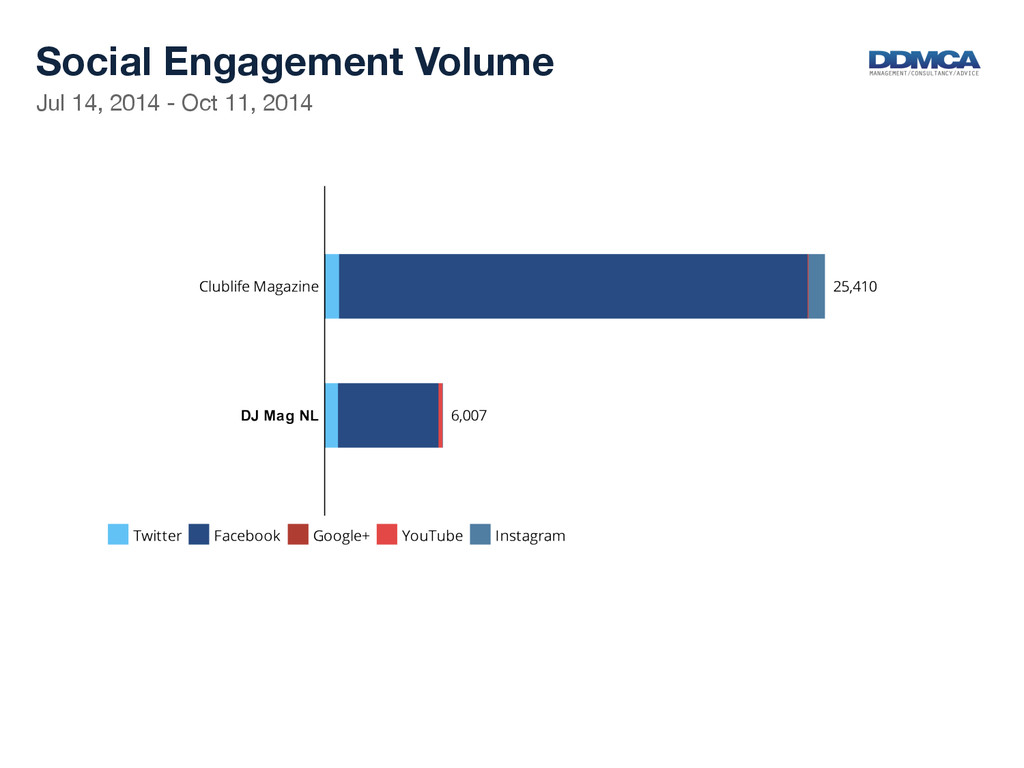
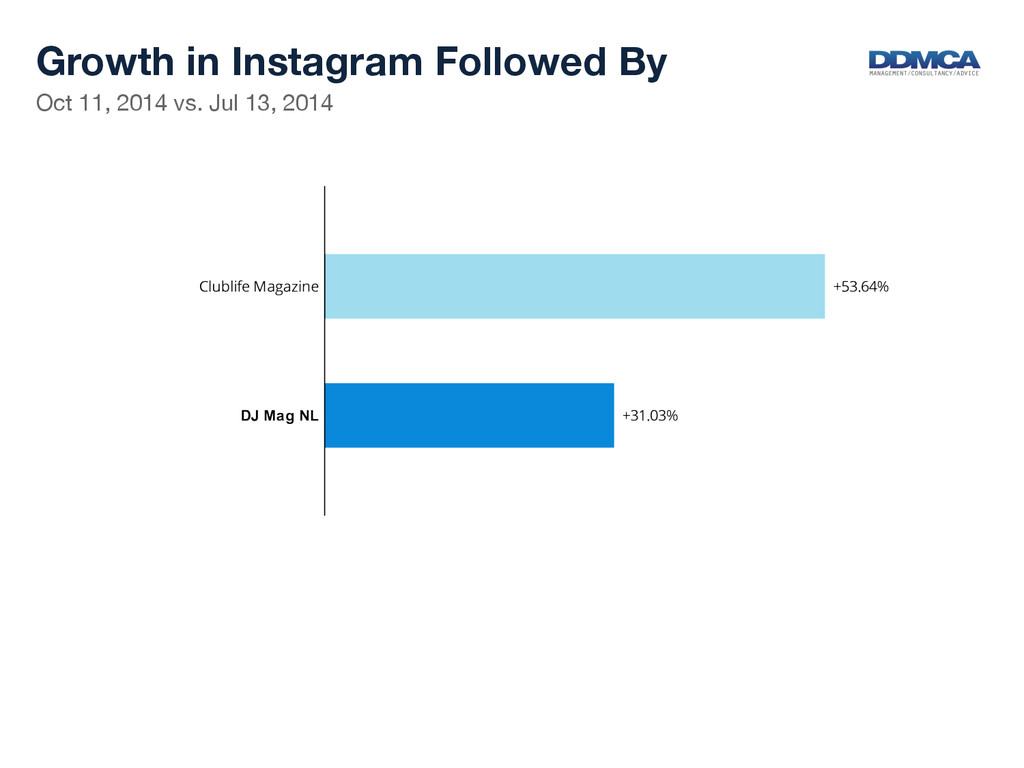
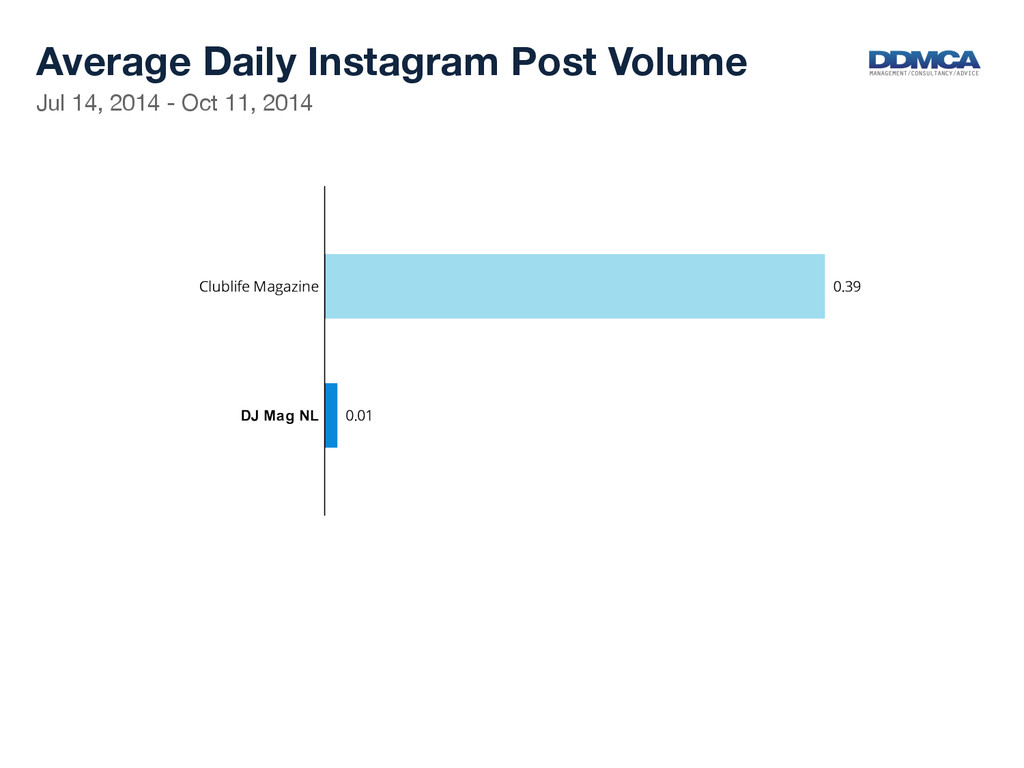
In this report you will find extensive data of Facebook, Twitter, Instagram, YouTube and Google+ over the last 90 days of DJ Mag Netherlands and Clublife EDM.
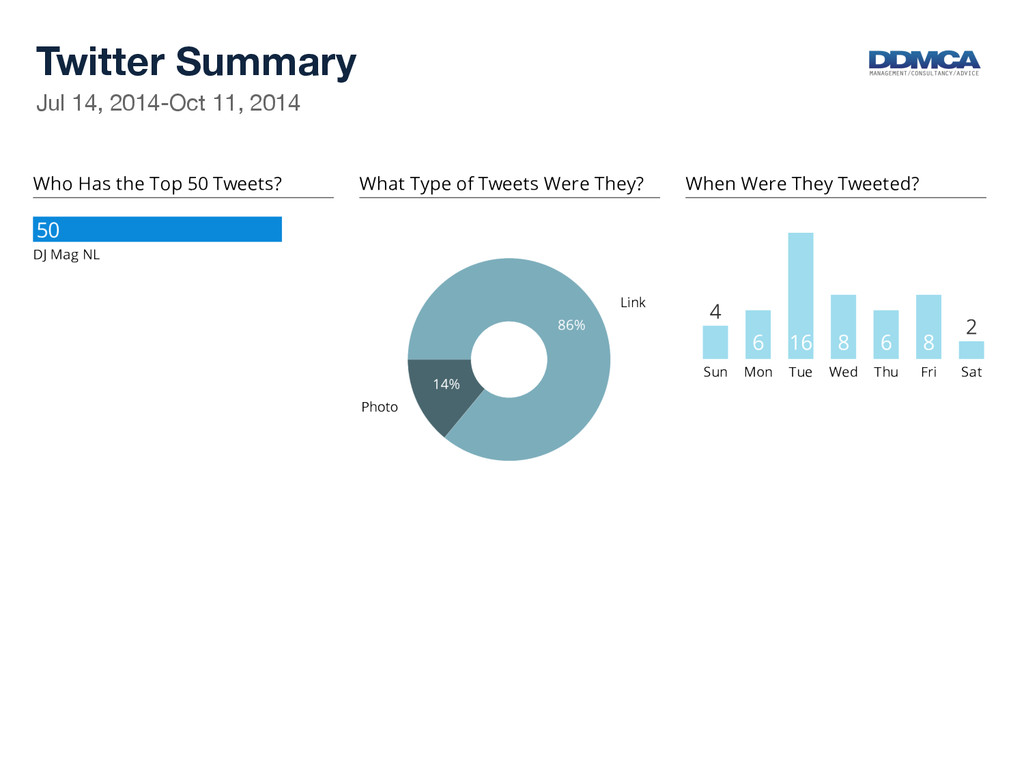
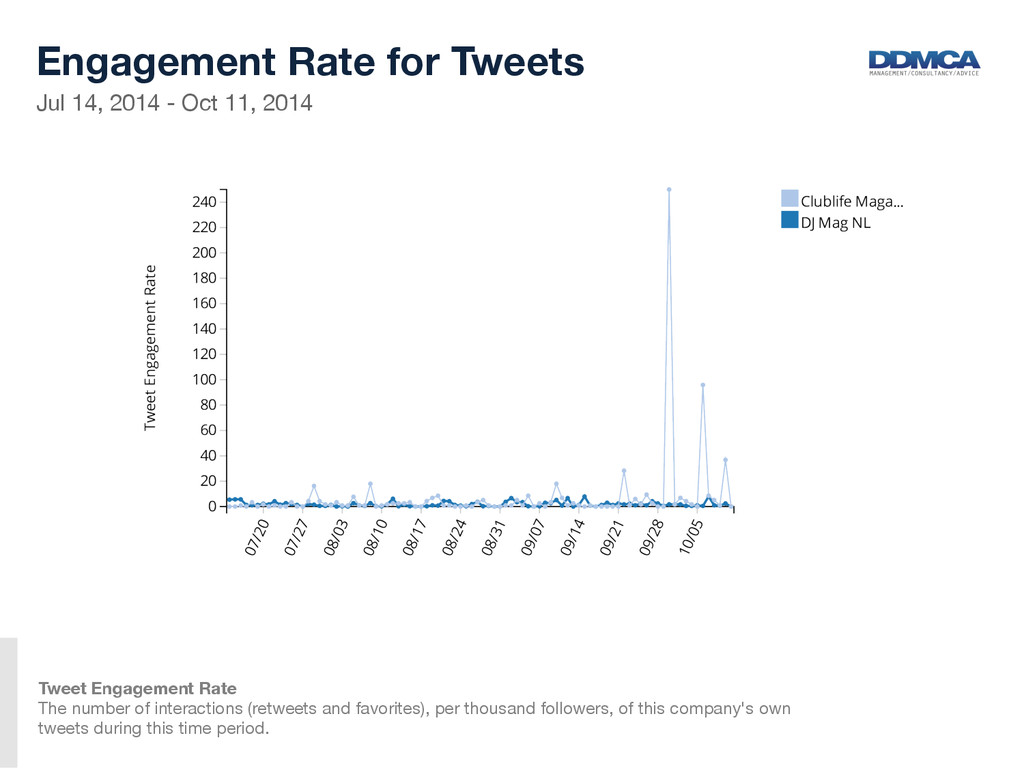
for Tweets Tweet Engagement Rate The number of interactions (retweets and favorites), per thousand followers, of this company's own tweets during this time period.
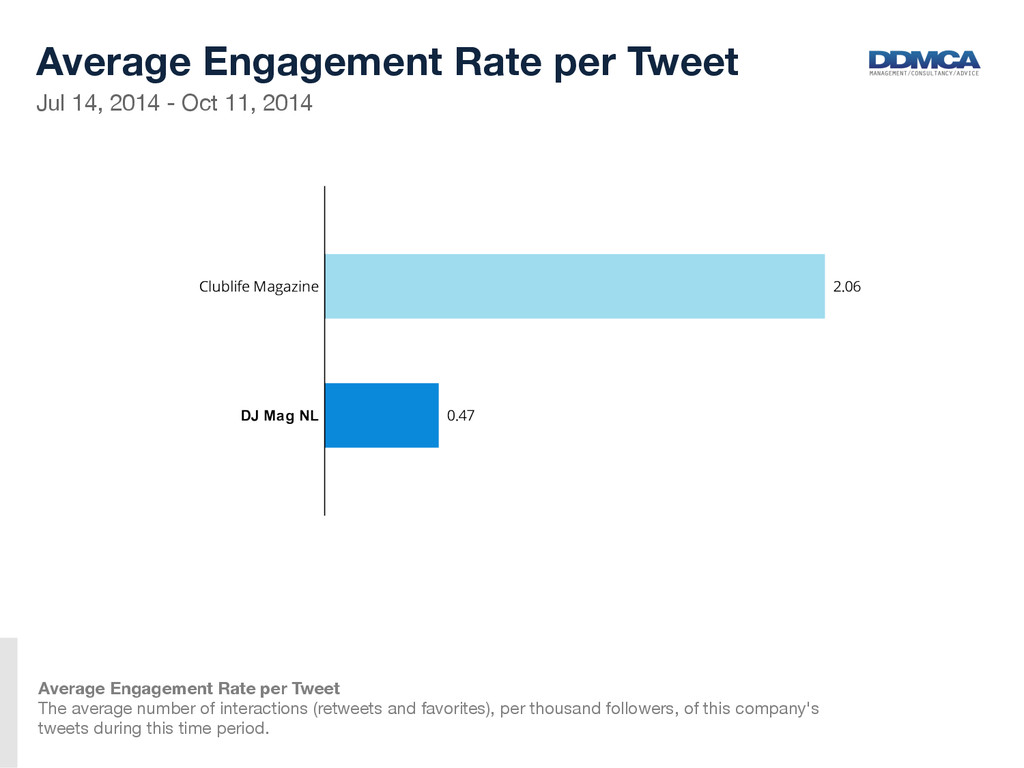
Rate per Tweet Average Engagement Rate per Tweet The average number of interactions (retweets and favorites), per thousand followers, of this company's tweets during this time period.
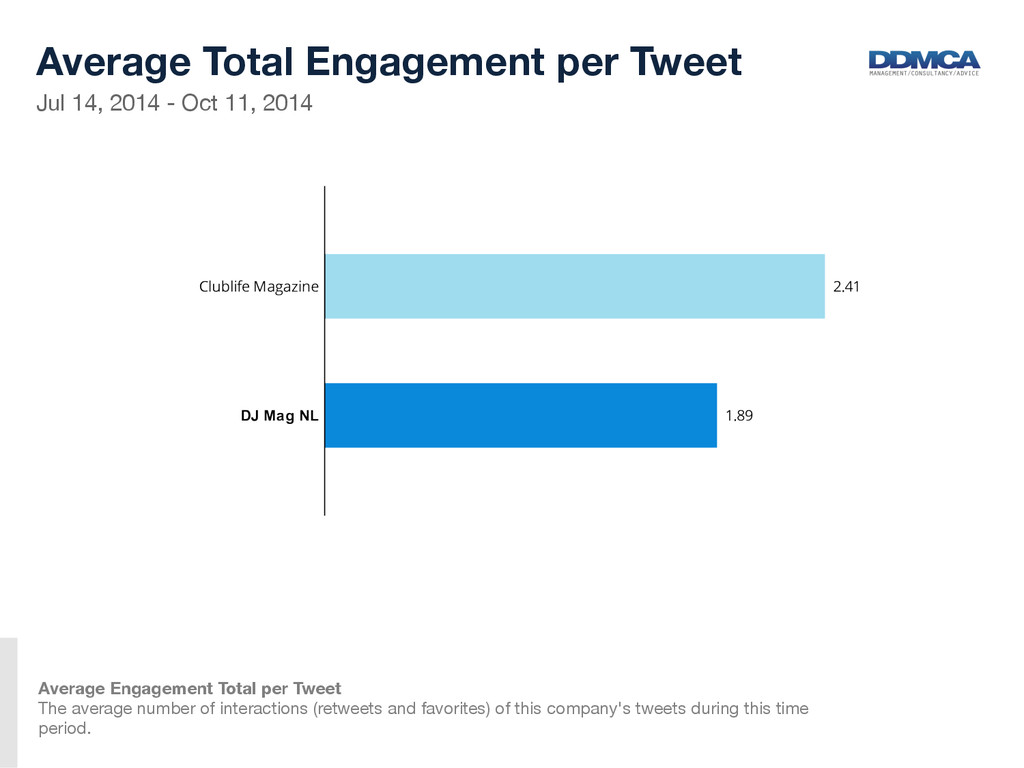
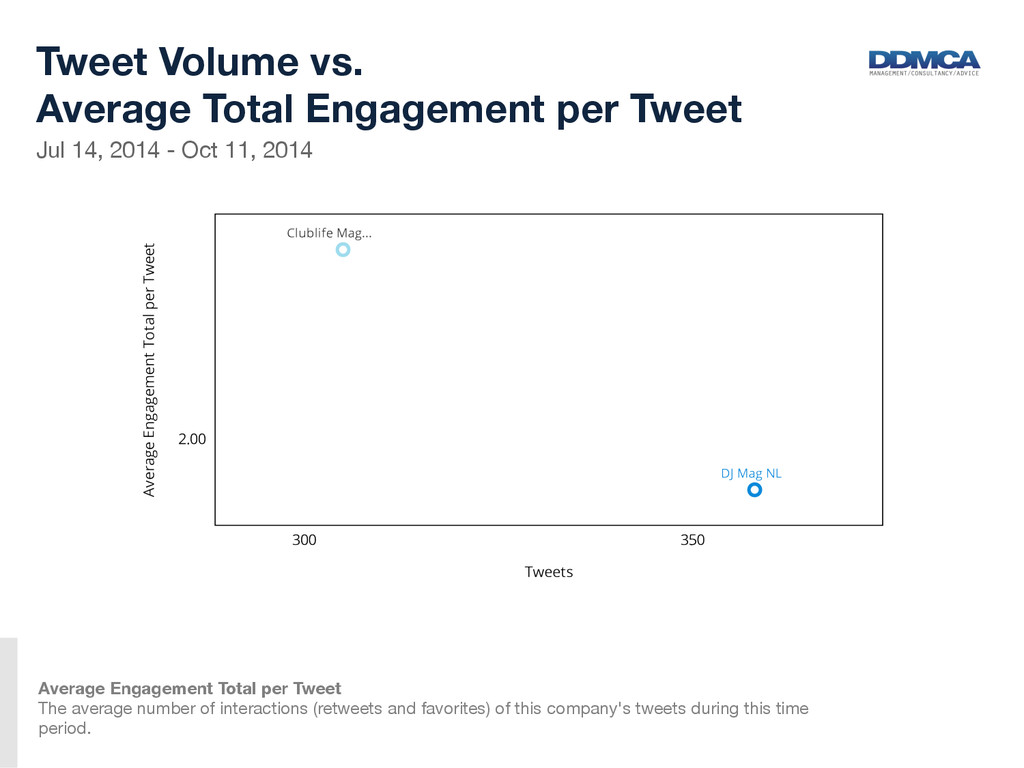
Engagement per Tweet Average Engagement Total per Tweet The average number of interactions (retweets and favorites) of this company's tweets during this time period.
vs. Average Total Engagement per Tweet Average Engagement Total per Tweet The average number of interactions (retweets and favorites) of this company's tweets during this time period.
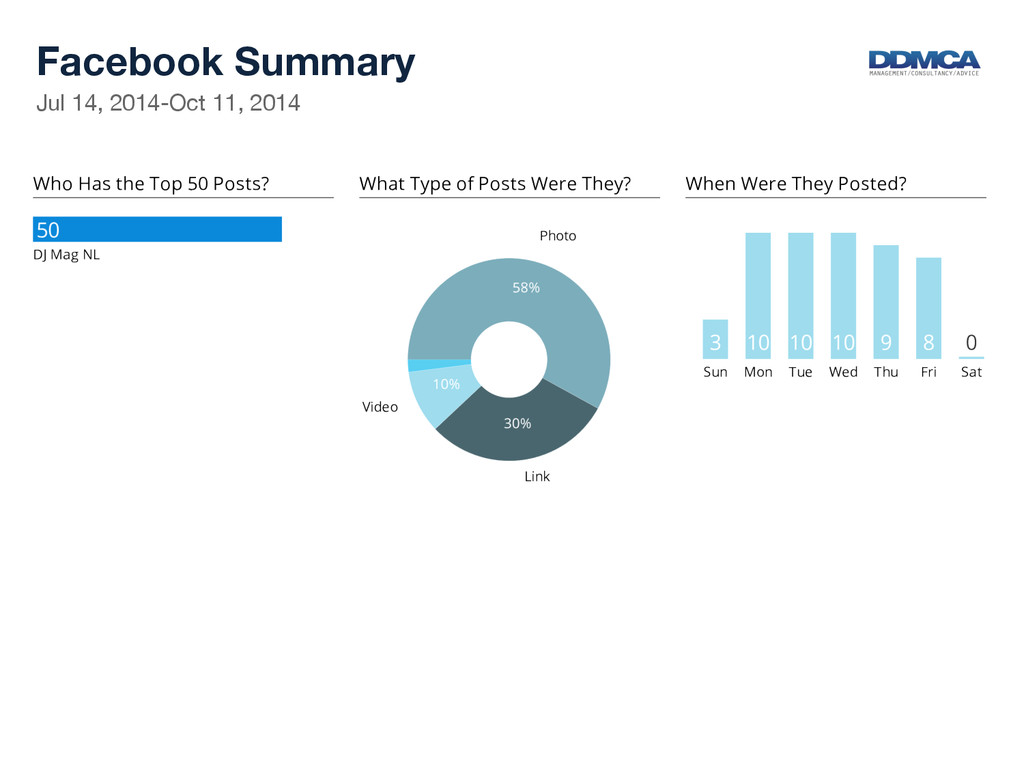
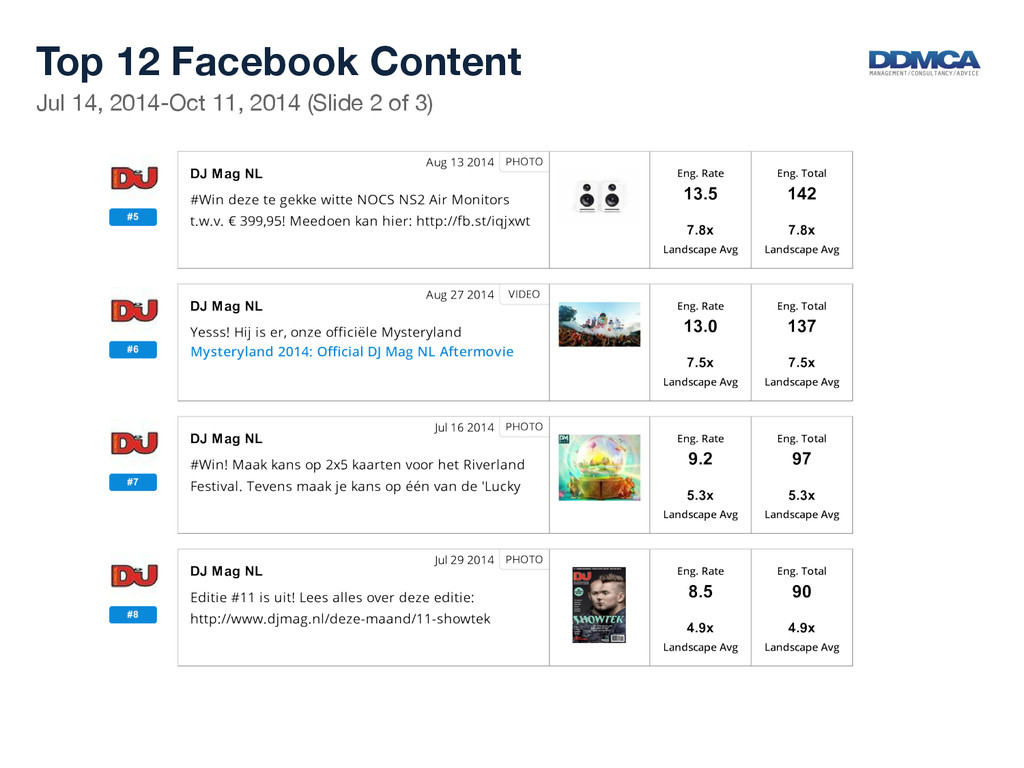
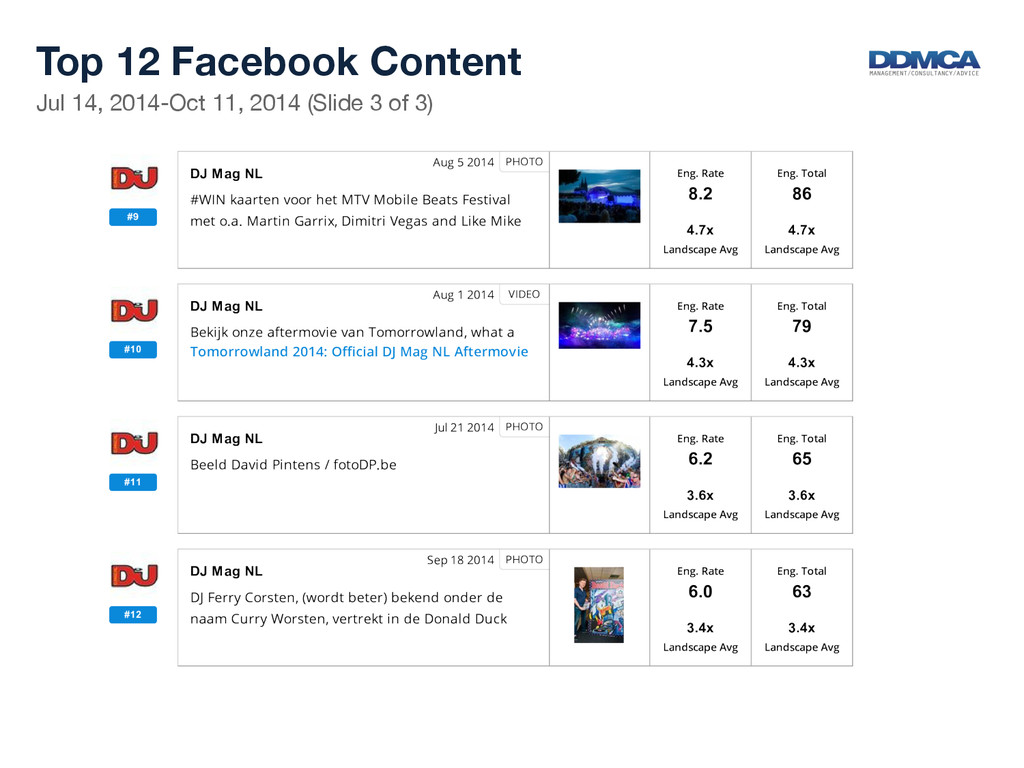
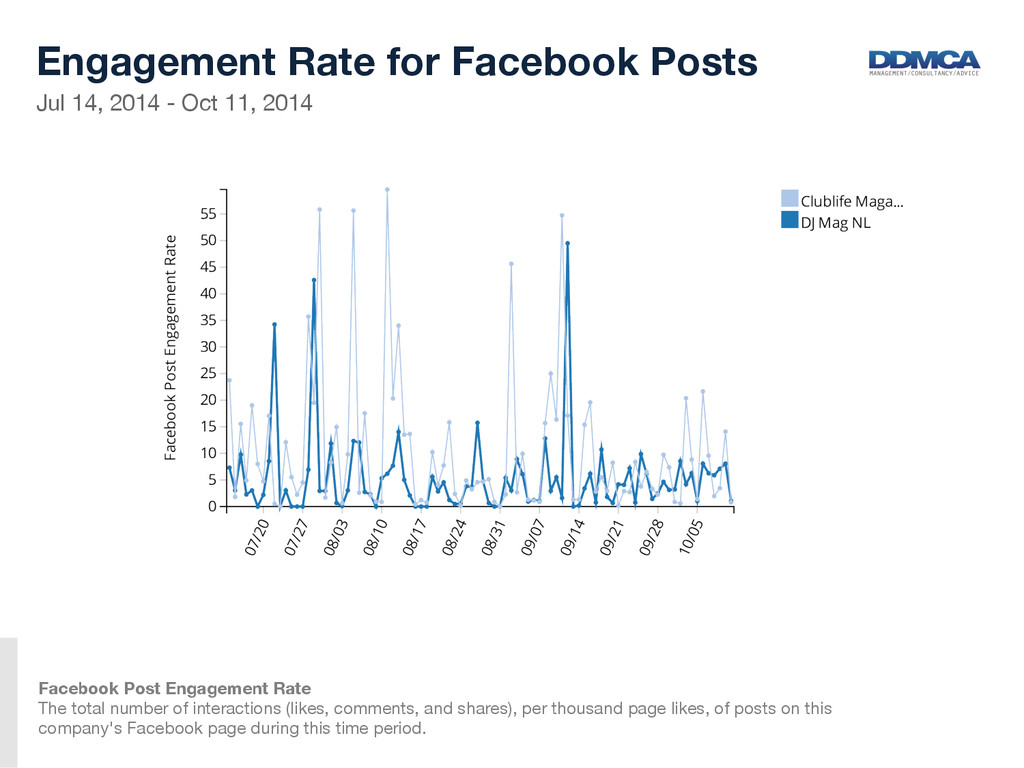
for Facebook Posts Facebook Post Engagement Rate The total number of interactions (likes, comments, and shares), per thousand page likes, of posts on this company's Facebook page during this time period.
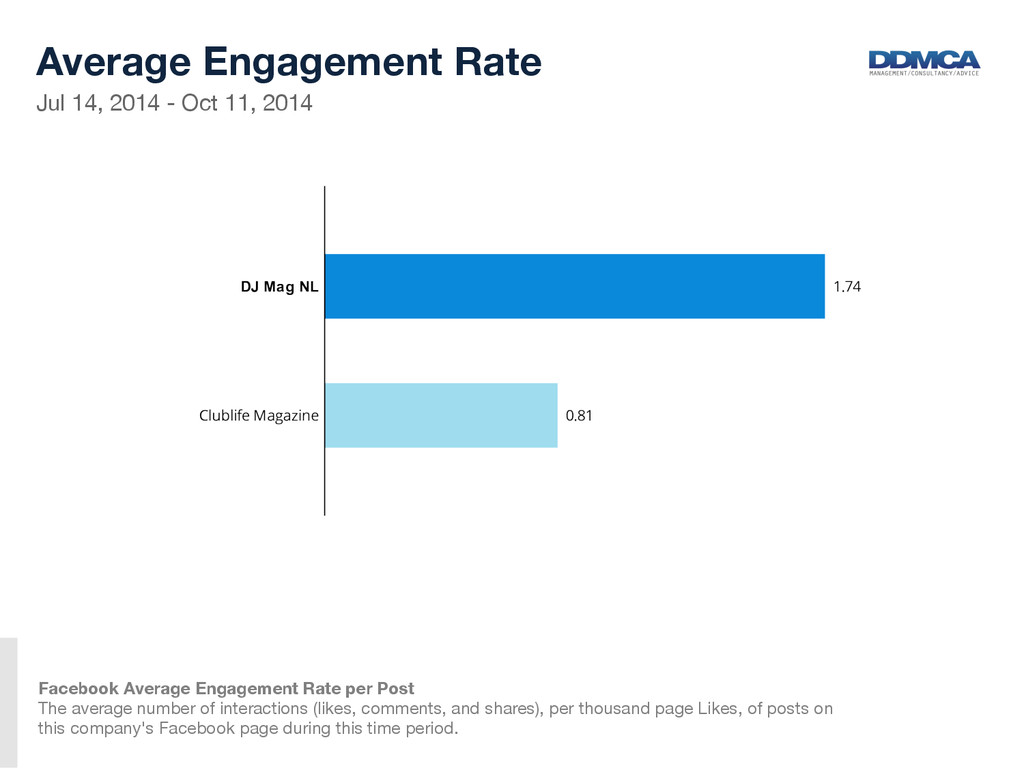
Rate Facebook Average Engagement Rate per Post The average number of interactions (likes, comments, and shares), per thousand page Likes, of posts on this company's Facebook page during this time period.
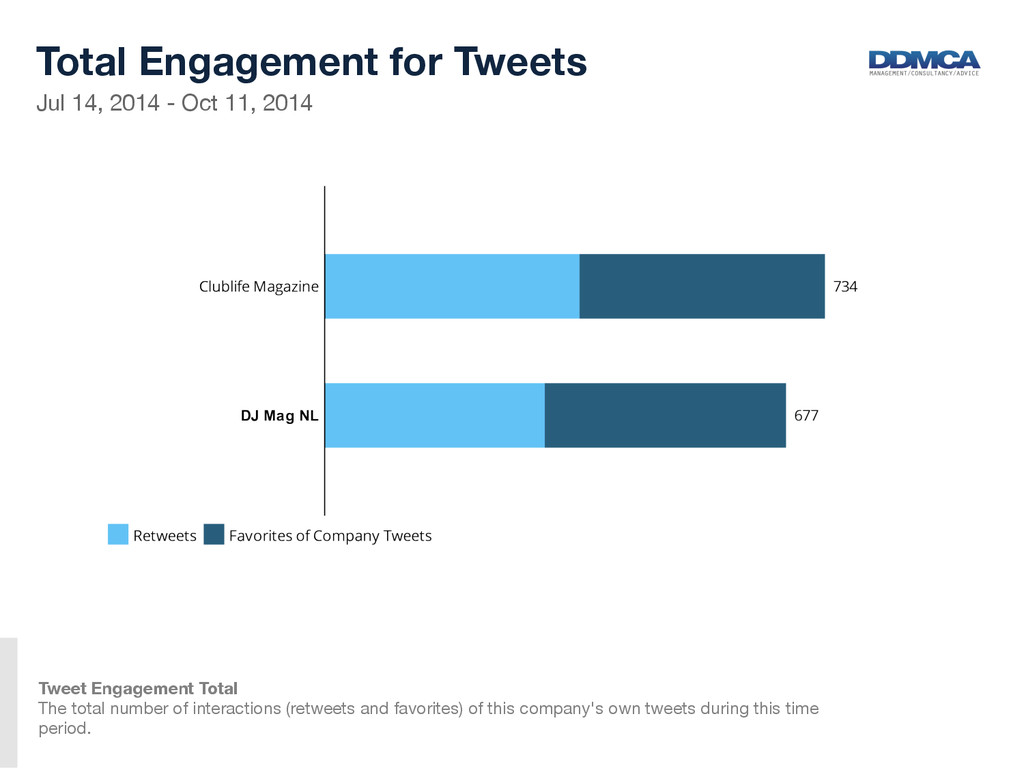
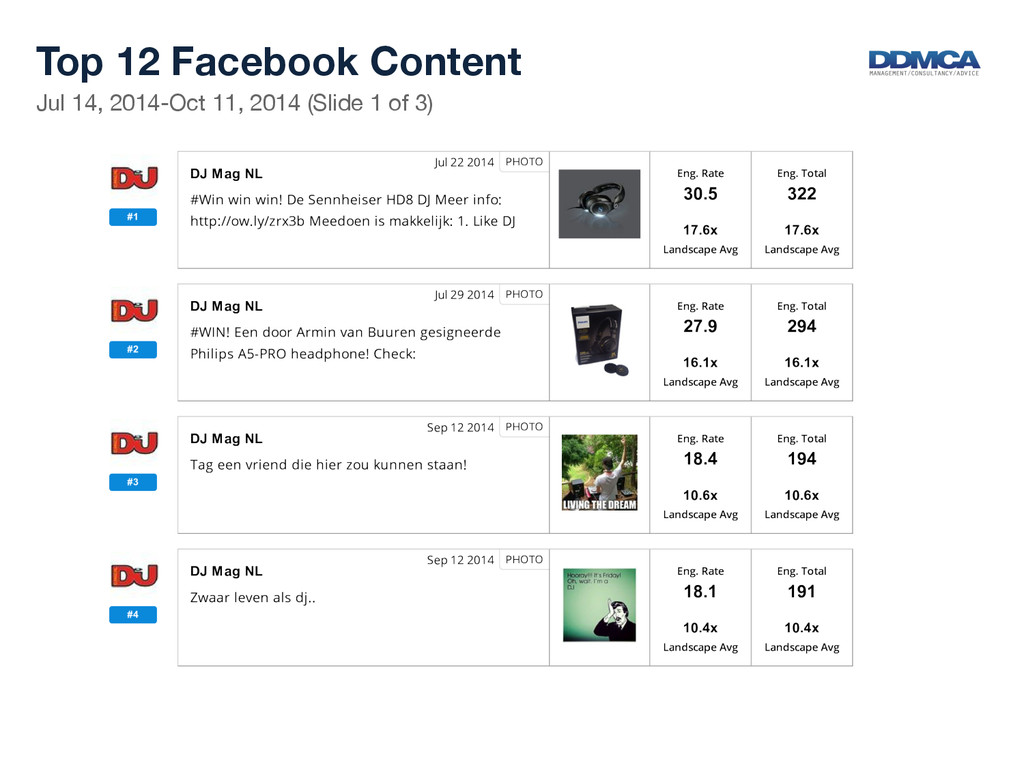
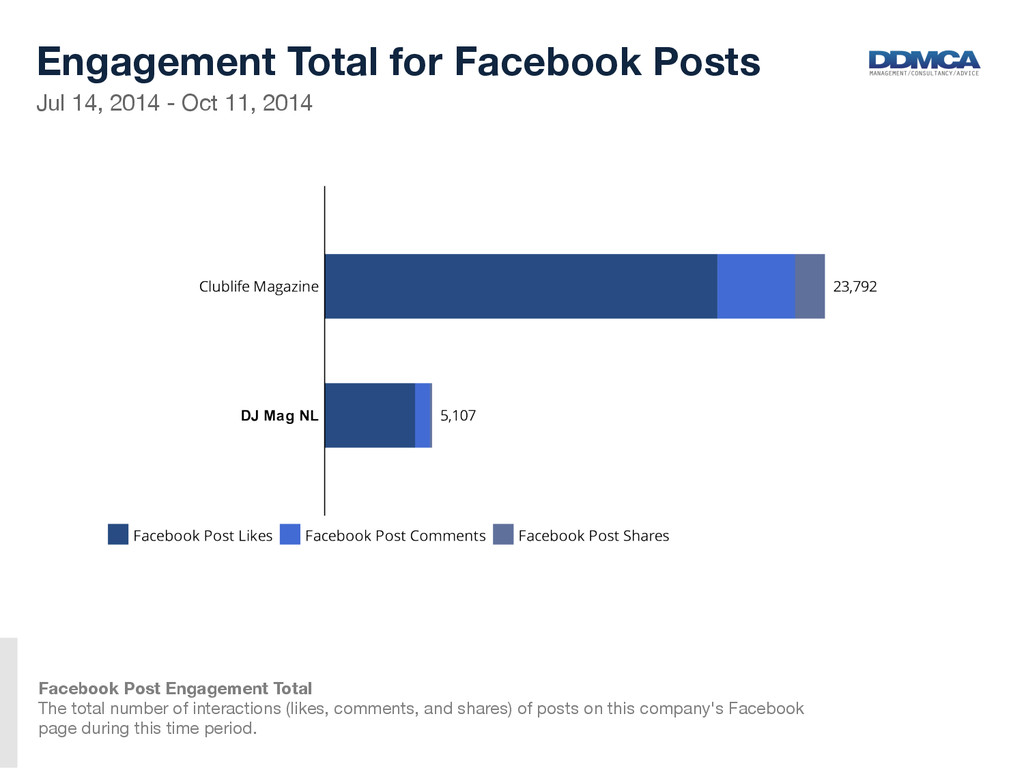
for Facebook Posts Facebook Post Engagement Total The total number of interactions (likes, comments, and shares) of posts on this company's Facebook page during this time period.
Total Facebook Average Engagement Total per Post The average number of interactions (likes, comments, and shares) of posts on this company's Facebook page during this time period.
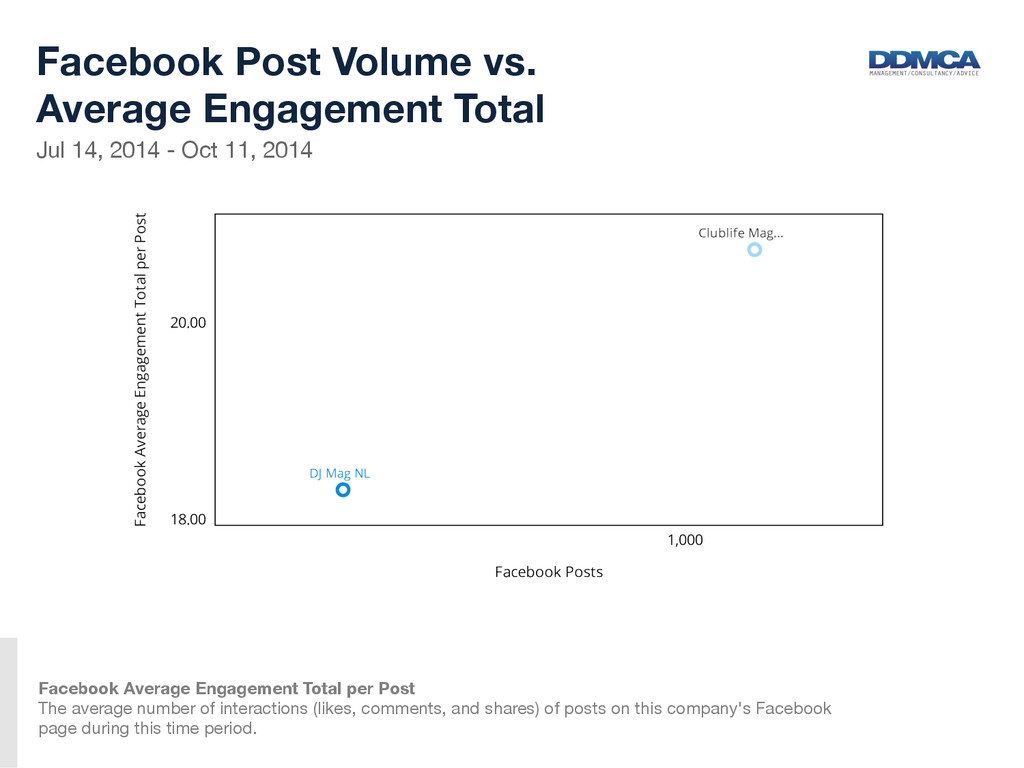
Volume vs. Average Engagement Total Facebook Average Engagement Total per Post The average number of interactions (likes, comments, and shares) of posts on this company's Facebook page during this time period.
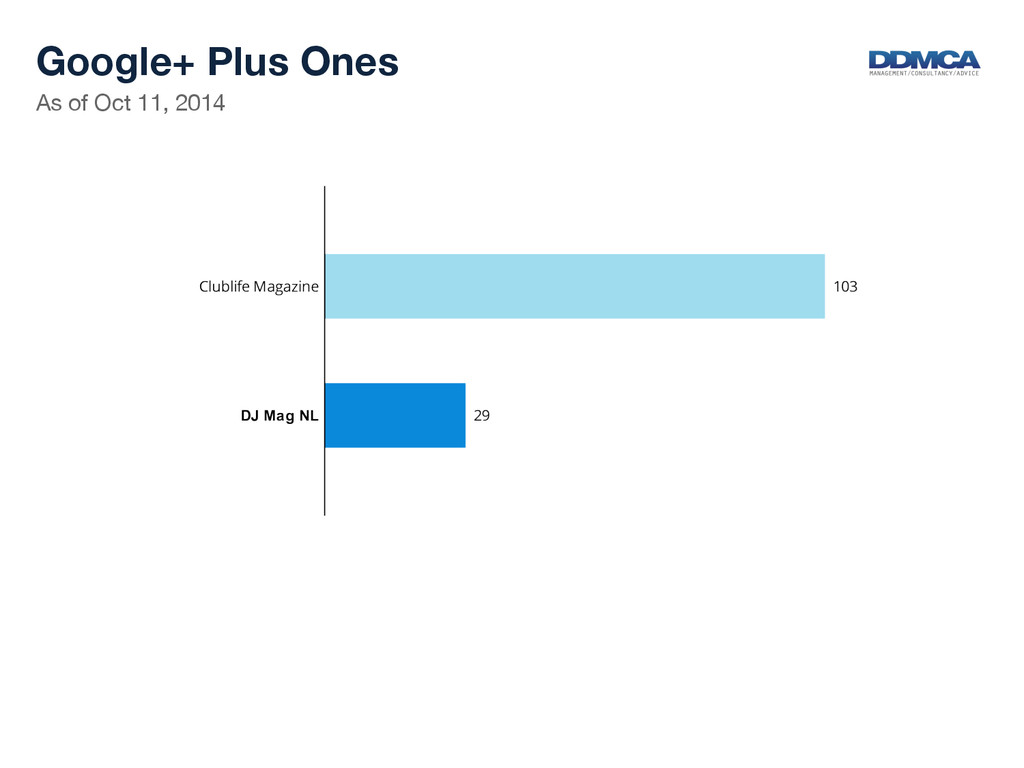
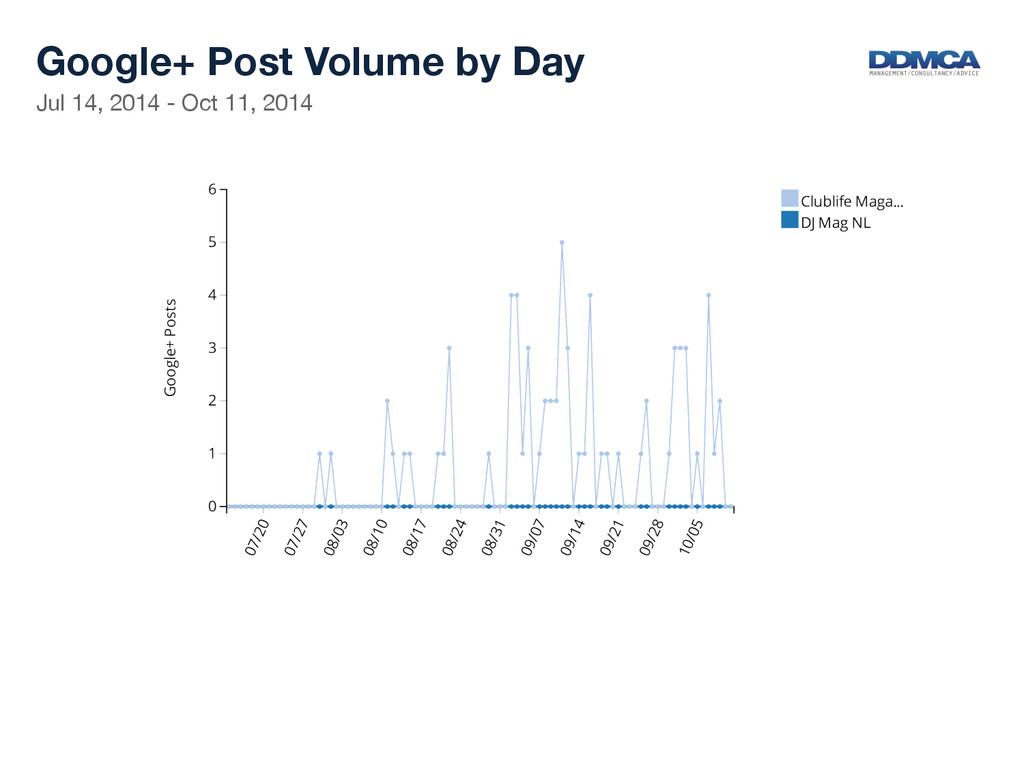
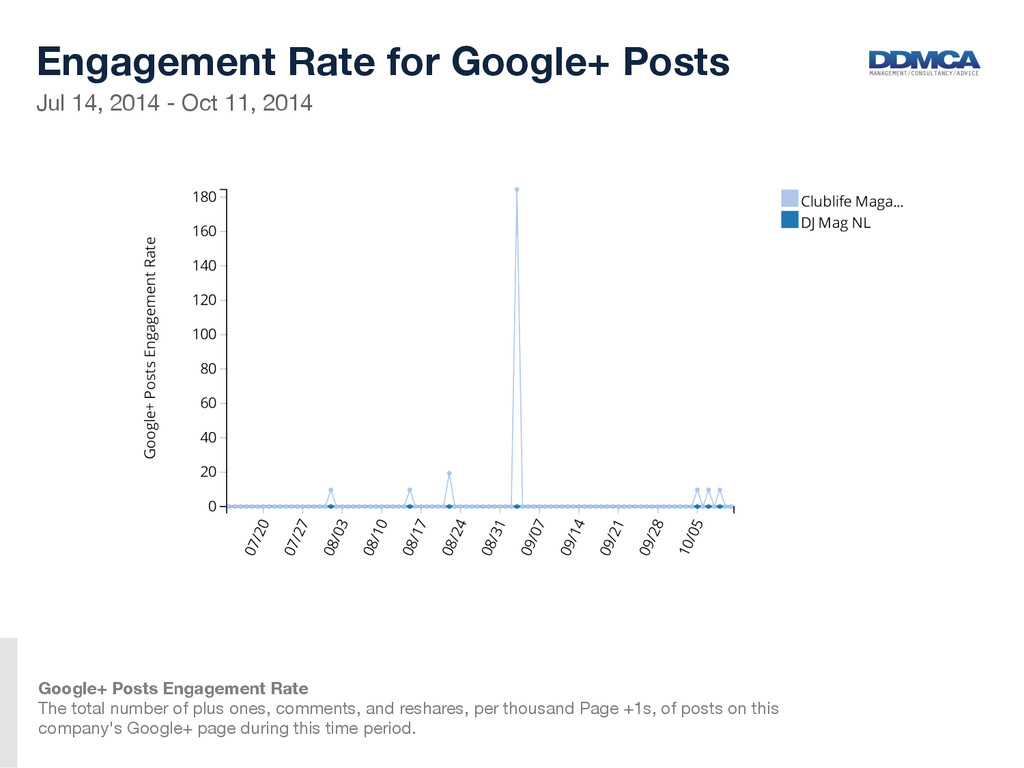
for Google+ Posts Google+ Posts Engagement Rate The total number of plus ones, comments, and reshares, per thousand Page +1s, of posts on this company's Google+ page during this time period.
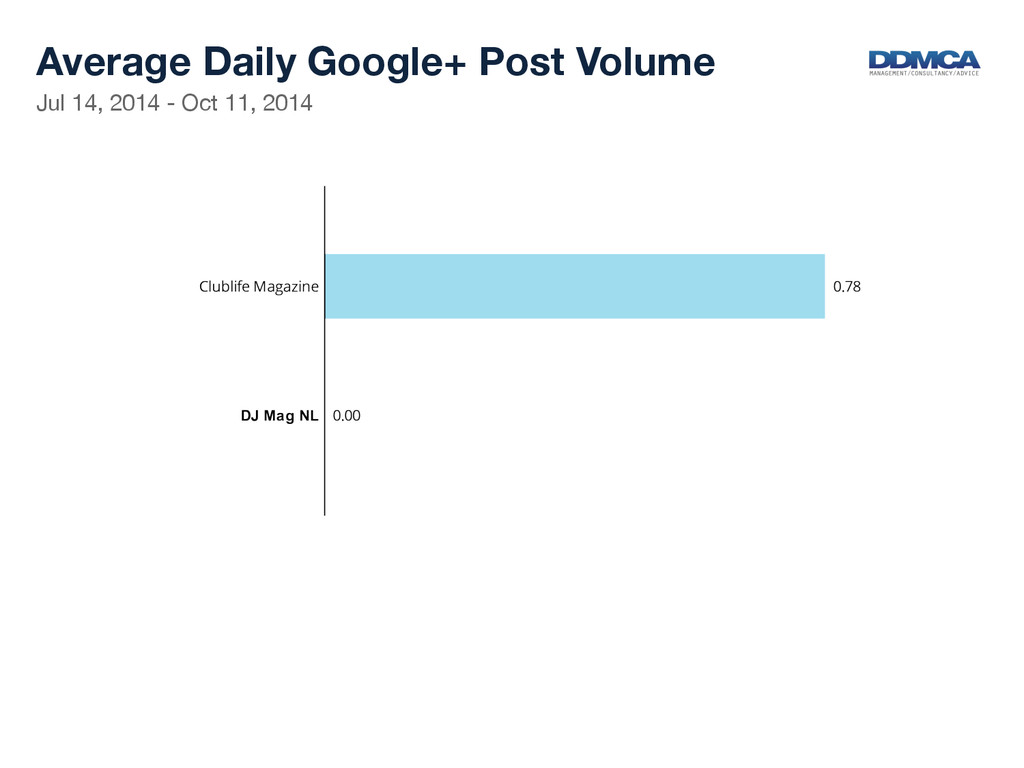
Rate Google+ Average Engagement Rate per Post The average number of interactions(+1s, comments, and reshares), per thousand Page +1s, of posts on this company's Google+ page during this time period.
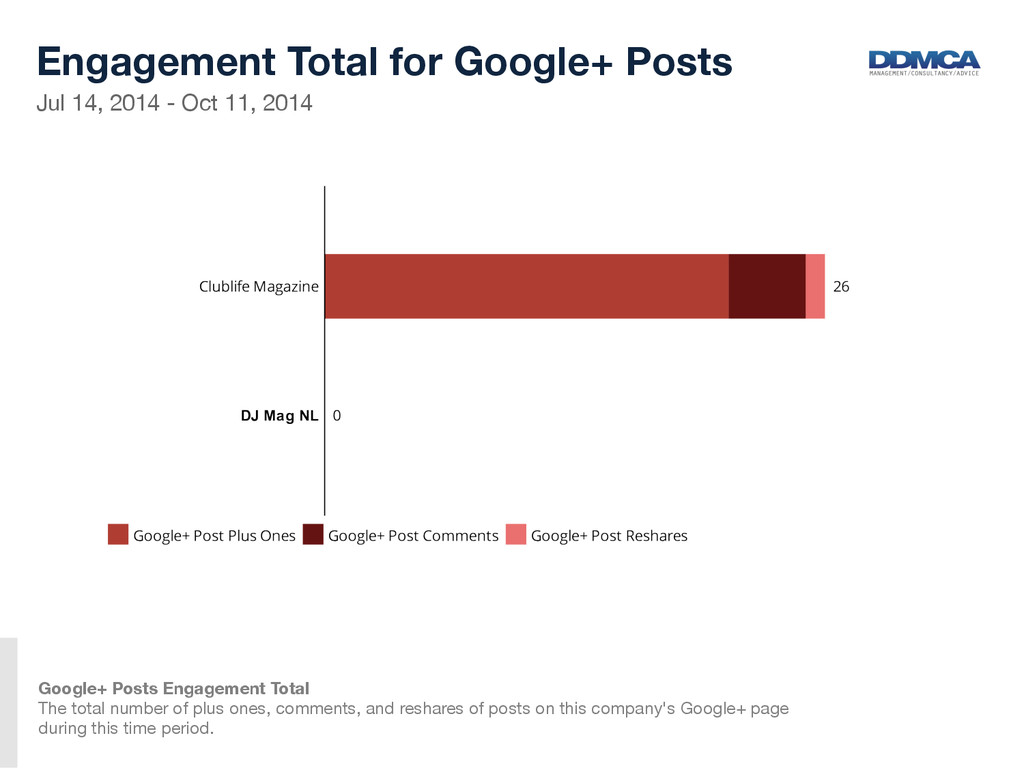
for Google+ Posts Google+ Posts Engagement Total The total number of plus ones, comments, and reshares of posts on this company's Google+ page during this time period.
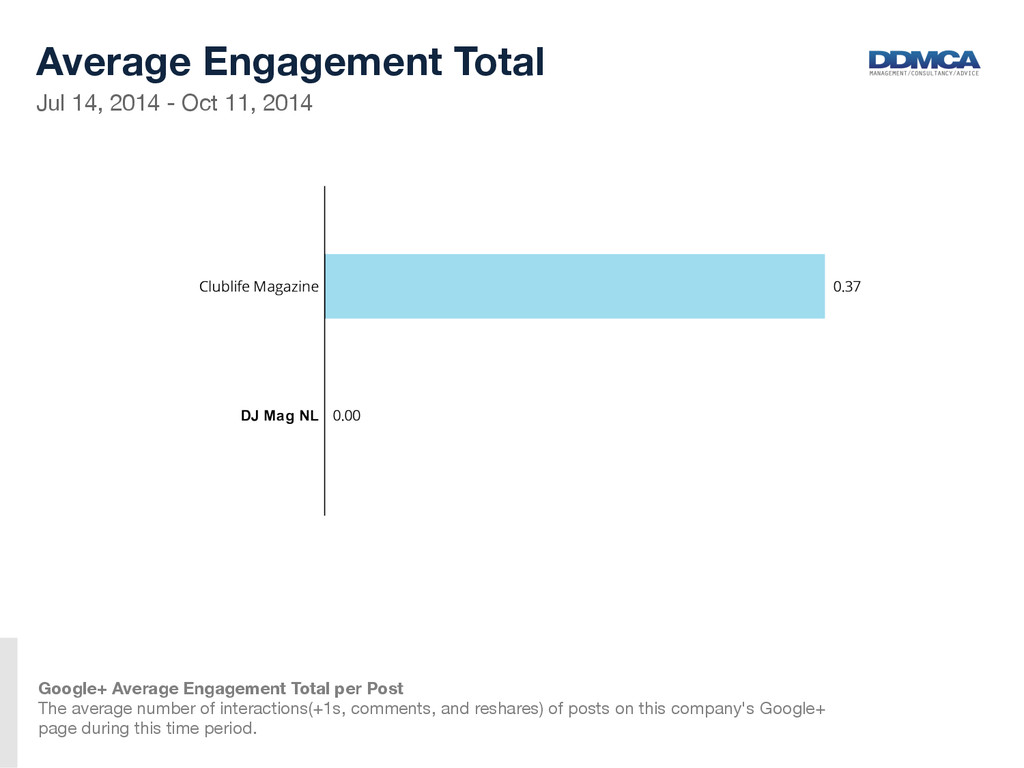
Total Google+ Average Engagement Total per Post The average number of interactions(+1s, comments, and reshares) of posts on this company's Google+ page during this time period.
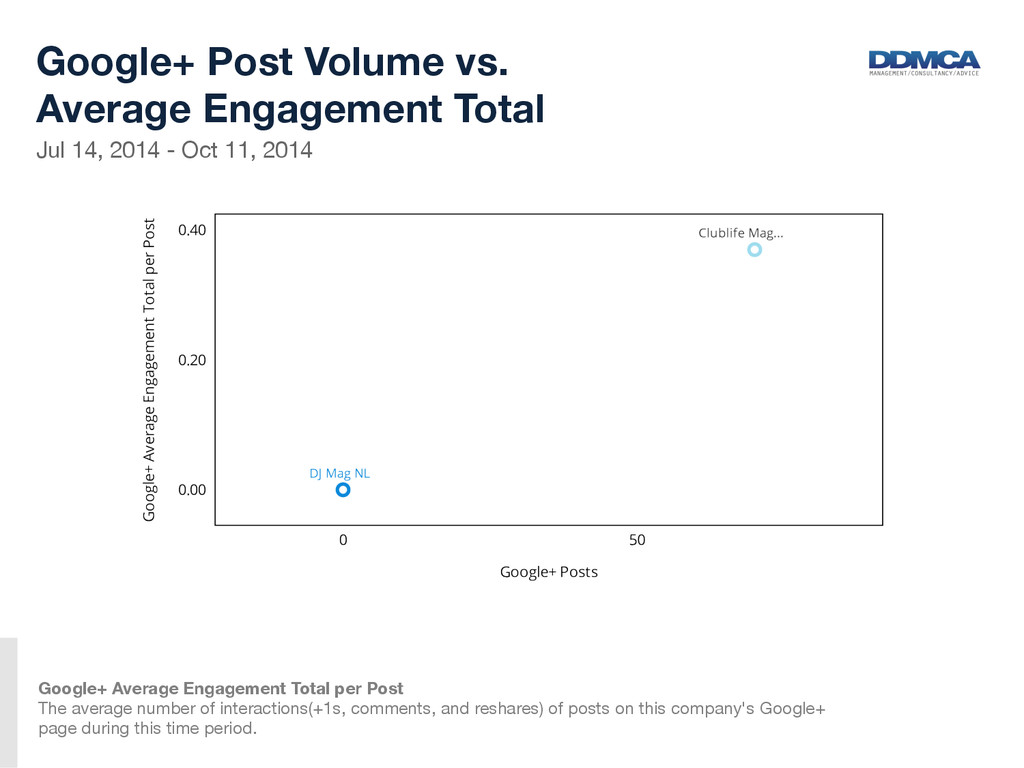
Volume vs. Average Engagement Total Google+ Average Engagement Total per Post The average number of interactions(+1s, comments, and reshares) of posts on this company's Google+ page during this time period.
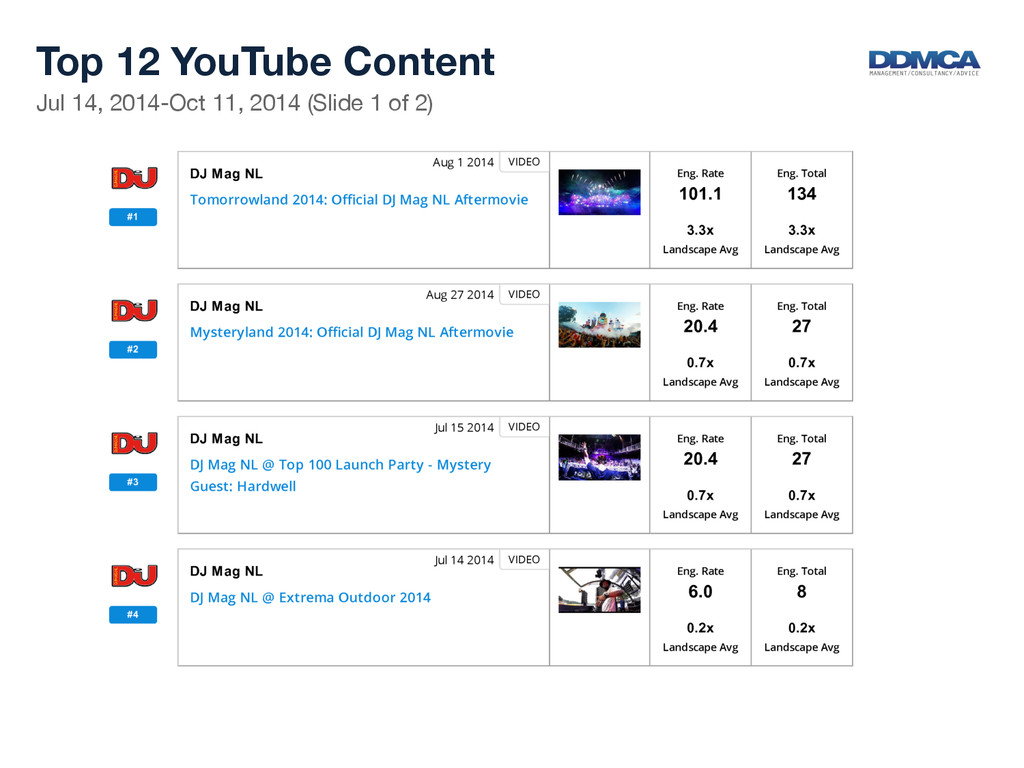
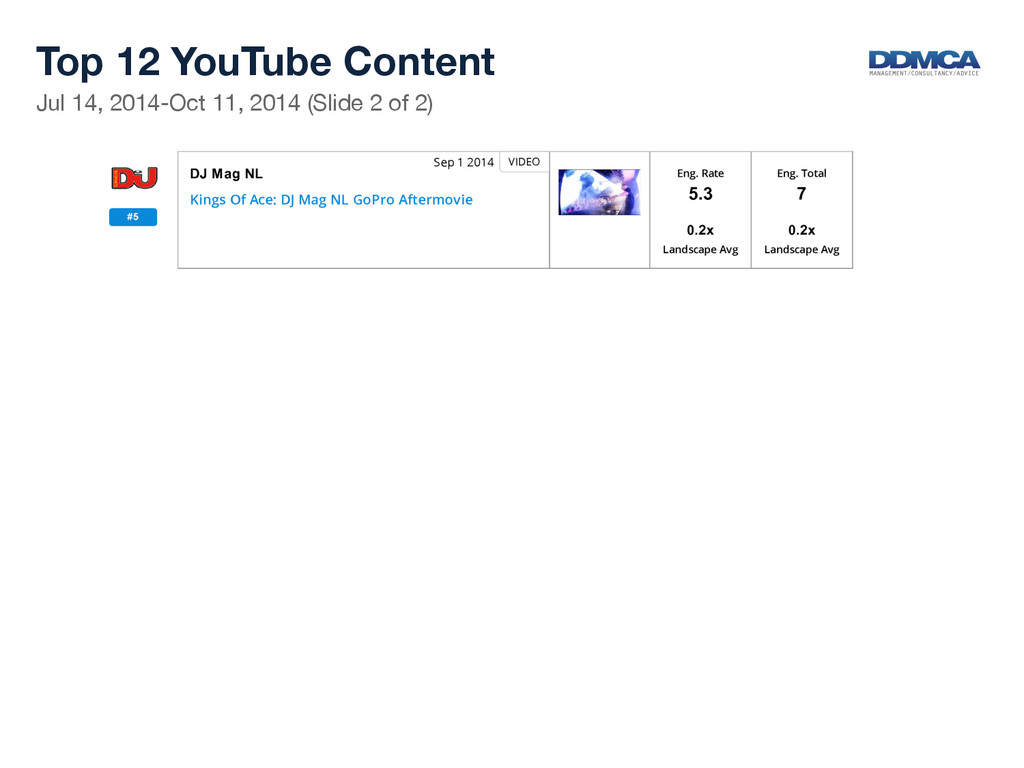
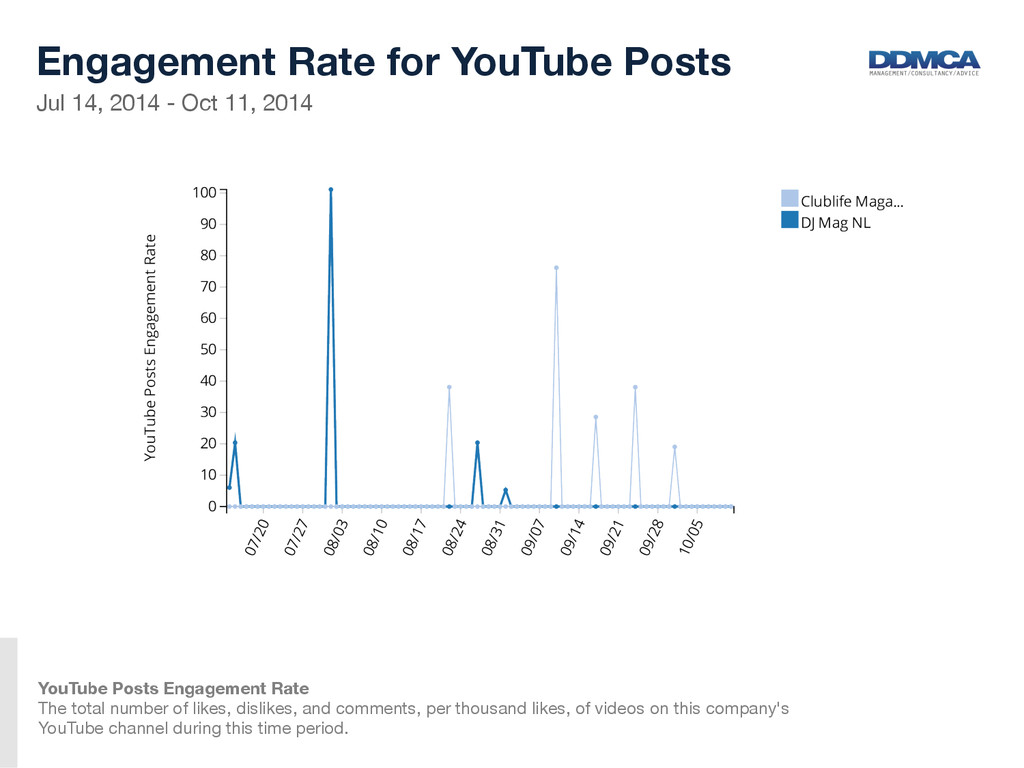
for YouTube Posts YouTube Posts Engagement Rate The total number of likes, dislikes, and comments, per thousand likes, of videos on this company's YouTube channel during this time period.
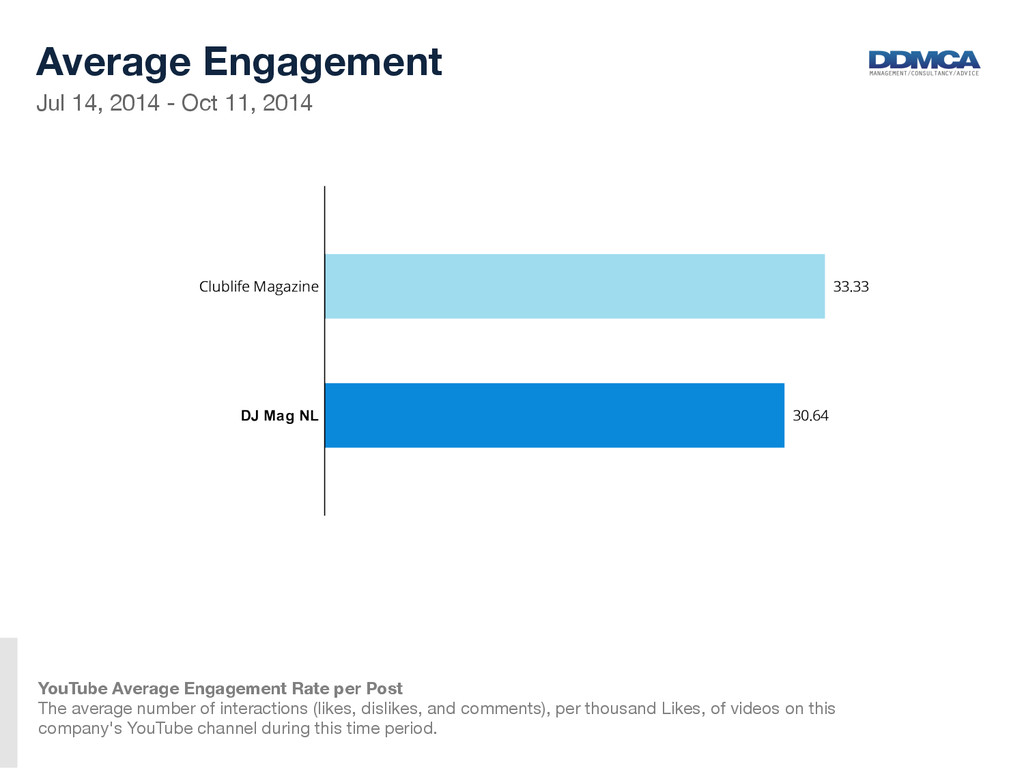
YouTube Average Engagement Rate per Post The average number of interactions (likes, dislikes, and comments), per thousand Likes, of videos on this company's YouTube channel during this time period.
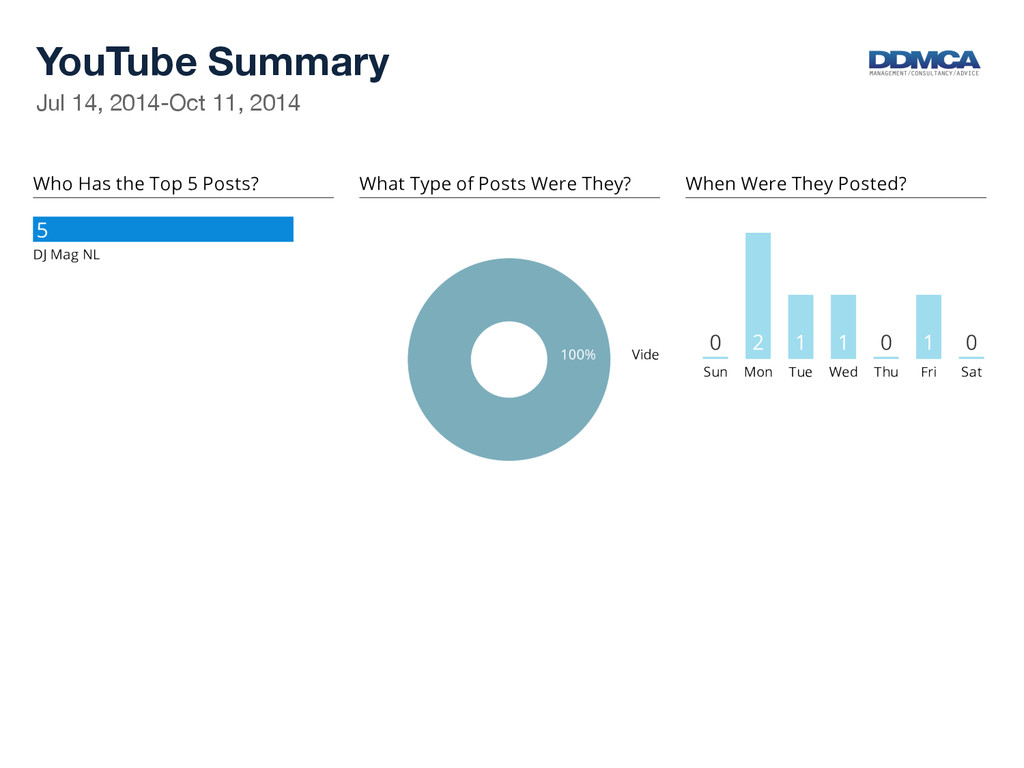
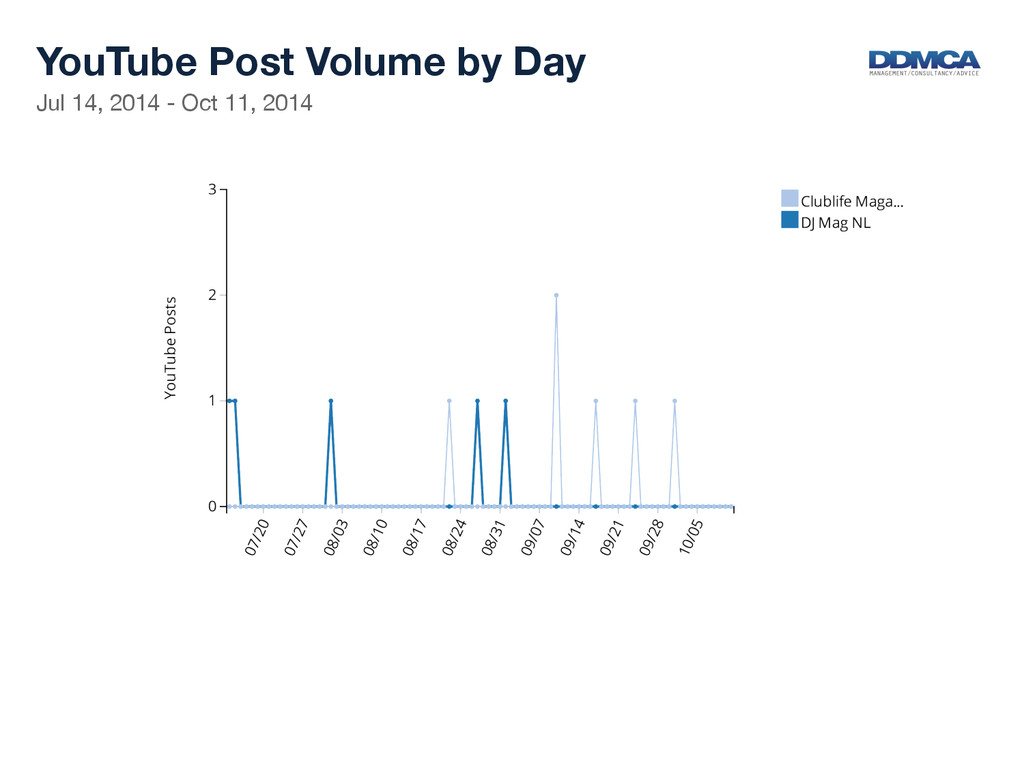
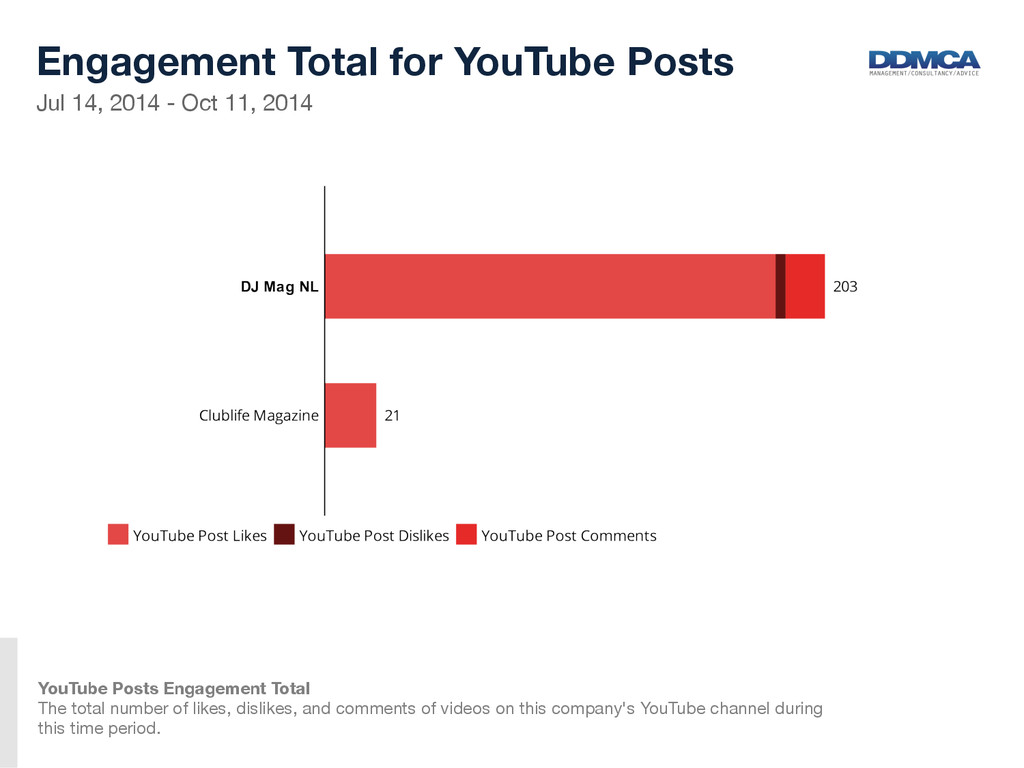
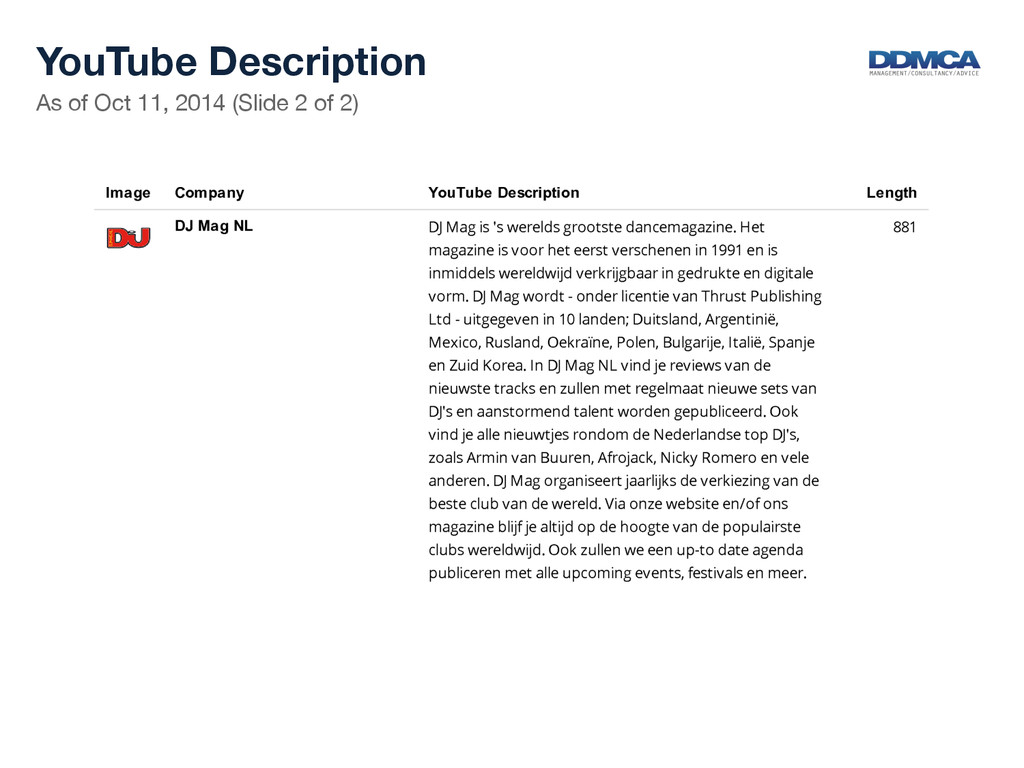
for YouTube Posts YouTube Posts Engagement Total The total number of likes, dislikes, and comments of videos on this company's YouTube channel during this time period.
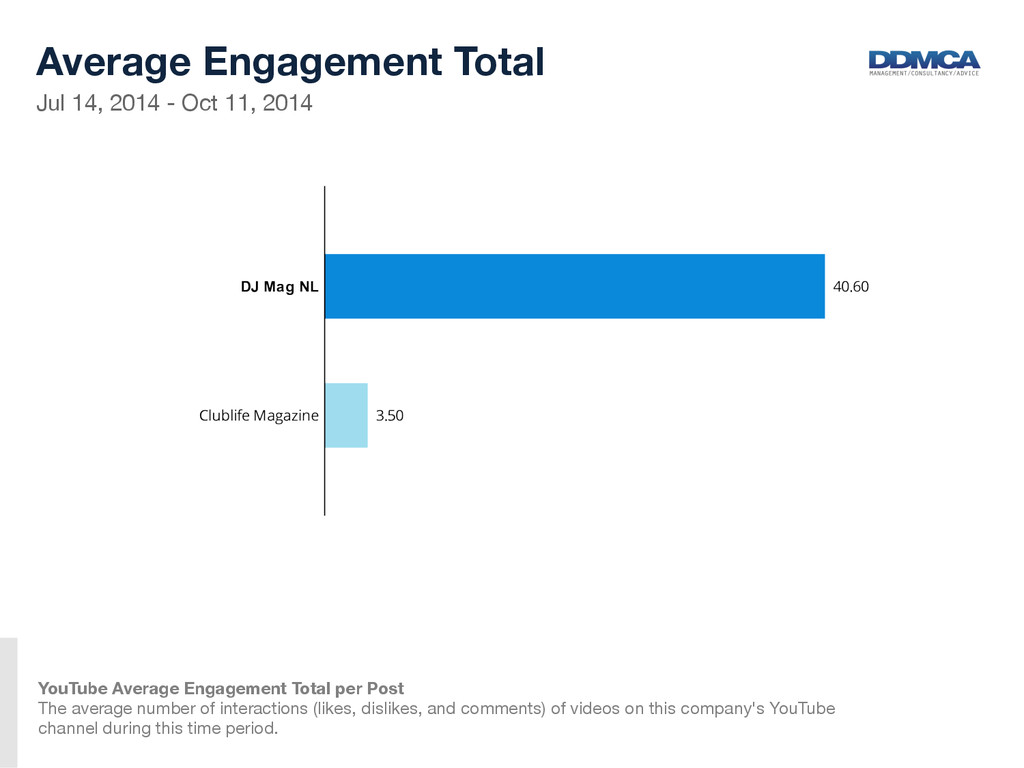
Total YouTube Average Engagement Total per Post The average number of interactions (likes, dislikes, and comments) of videos on this company's YouTube channel during this time period.
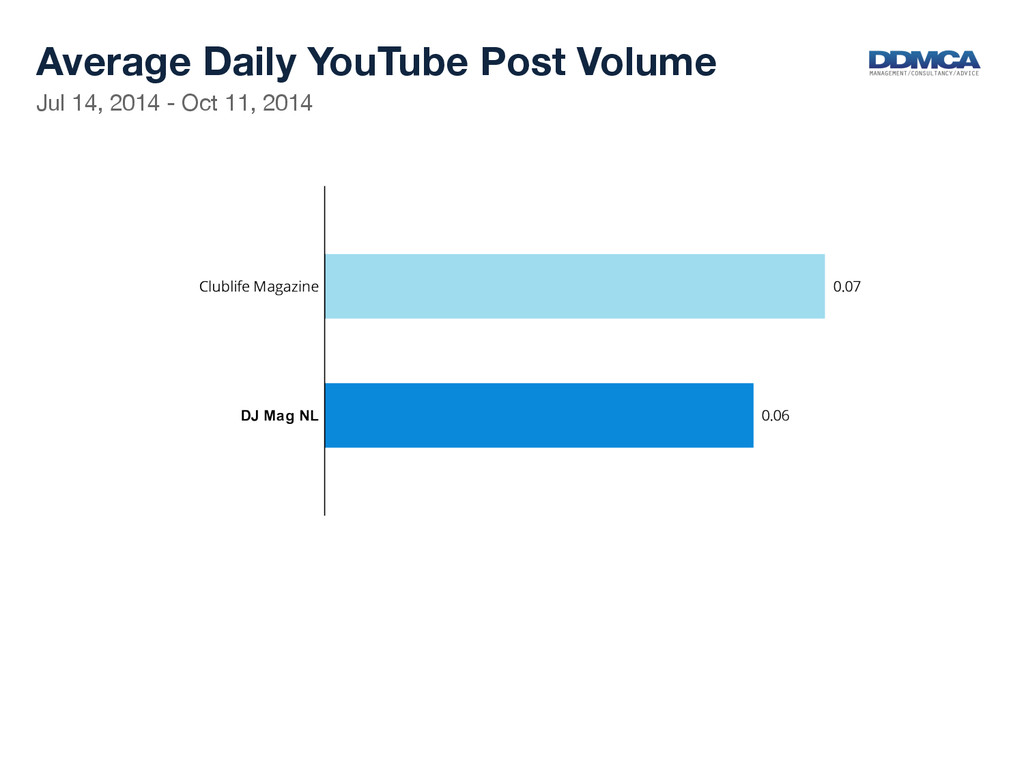
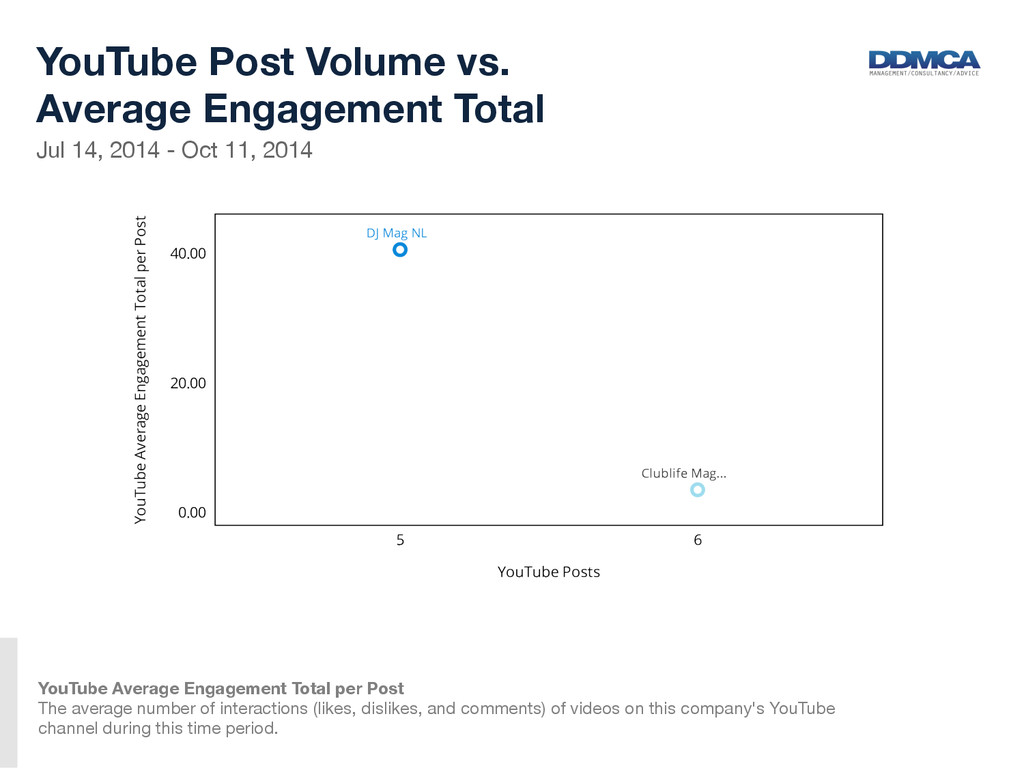
Volume vs. Average Engagement Total YouTube Average Engagement Total per Post The average number of interactions (likes, dislikes, and comments) of videos on this company's YouTube channel during this time period.
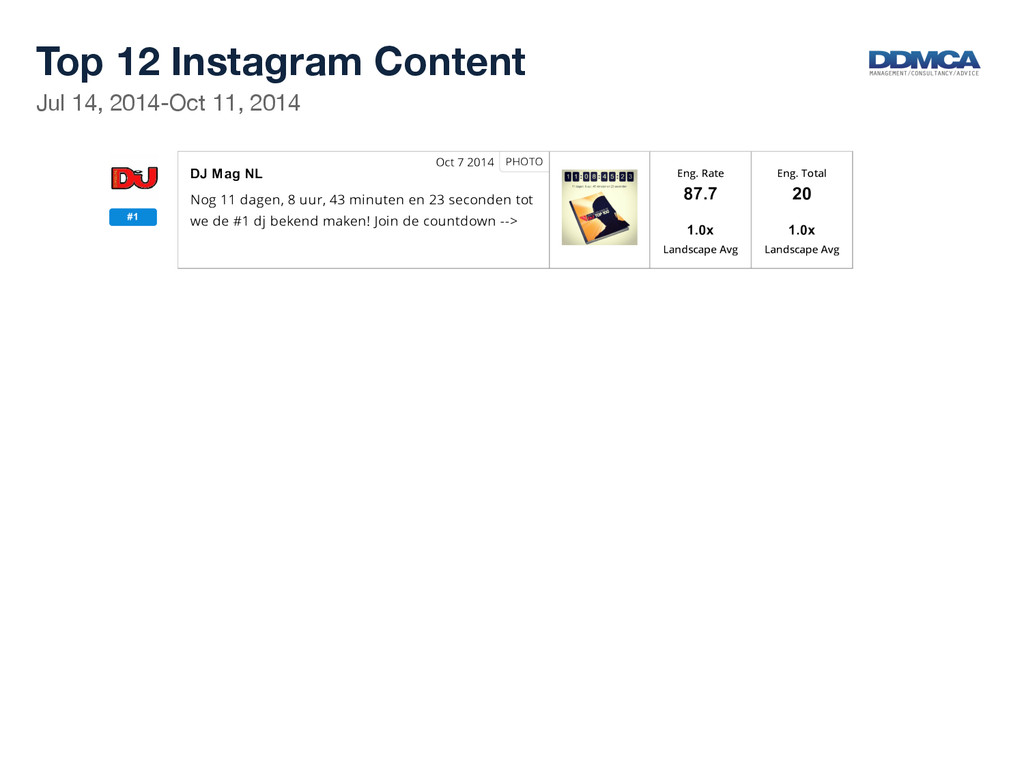
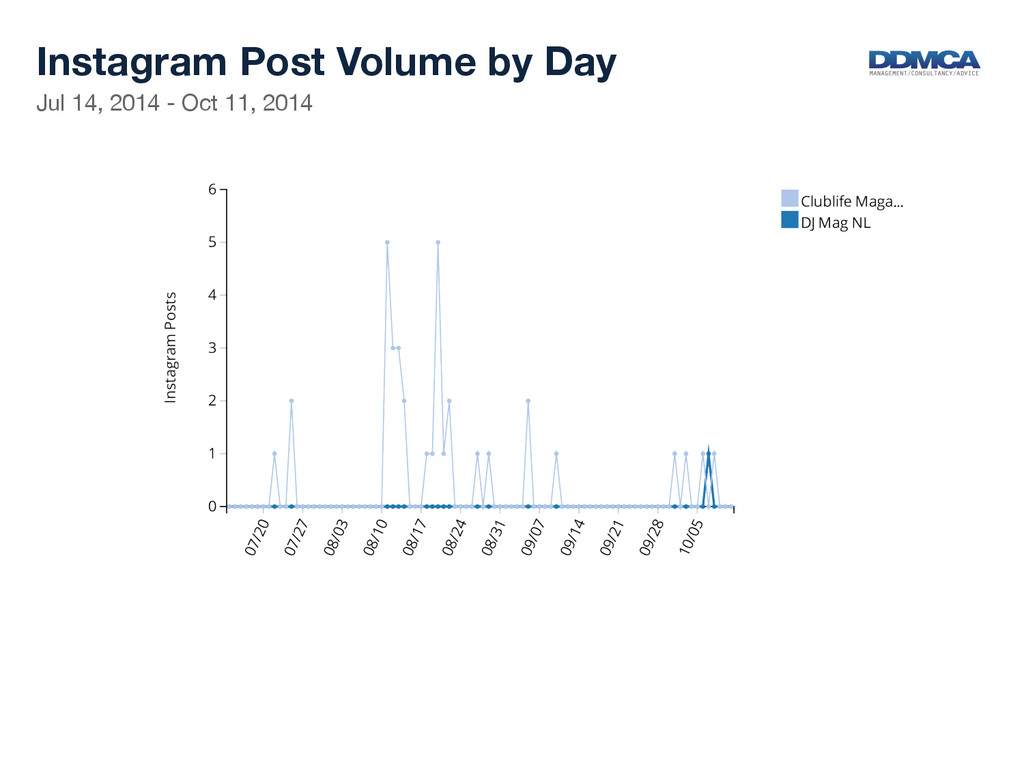
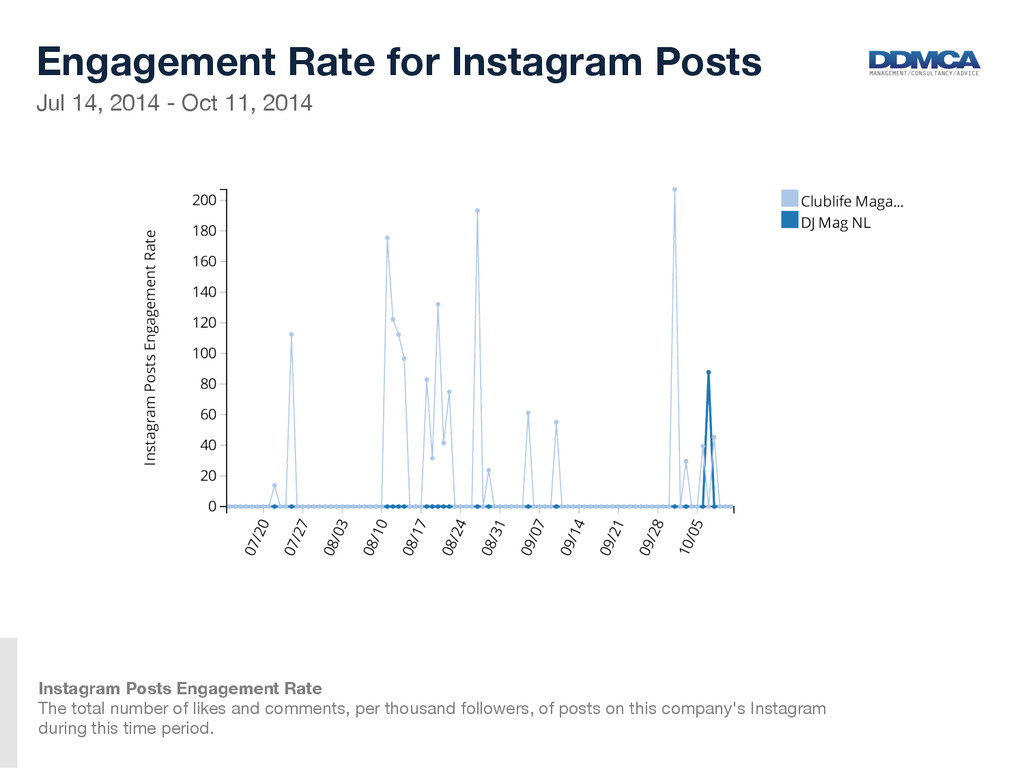
for Instagram Posts Instagram Posts Engagement Rate The total number of likes and comments, per thousand followers, of posts on this company's Instagram during this time period.
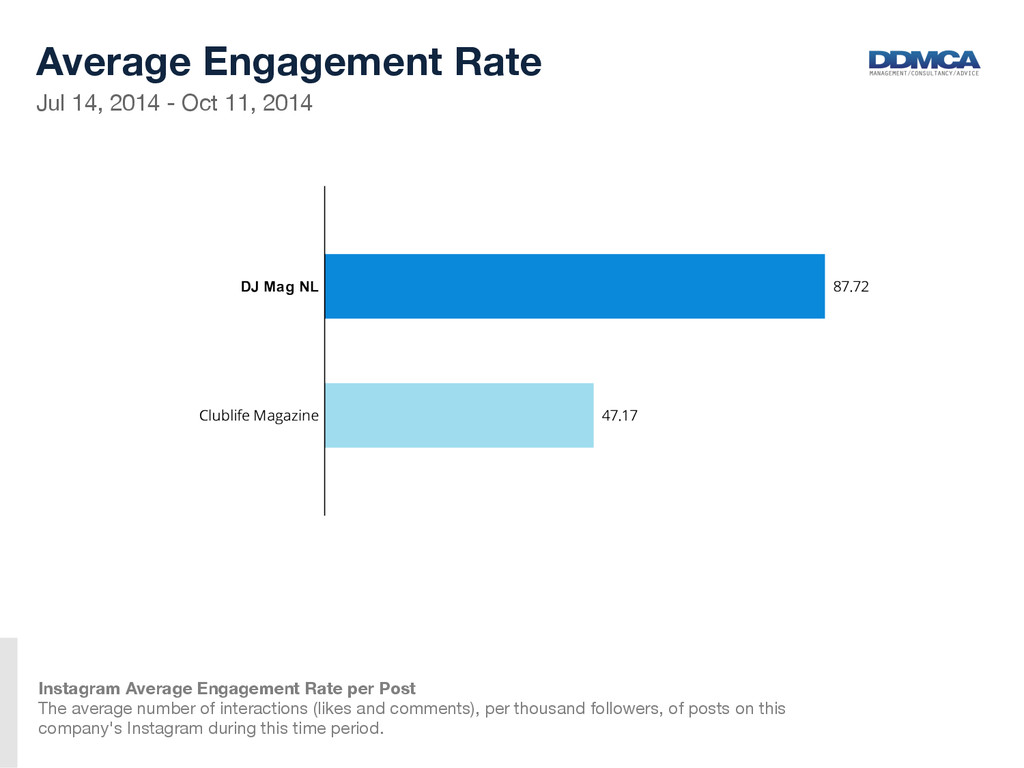
Rate Instagram Average Engagement Rate per Post The average number of interactions (likes and comments), per thousand followers, of posts on this company's Instagram during this time period.
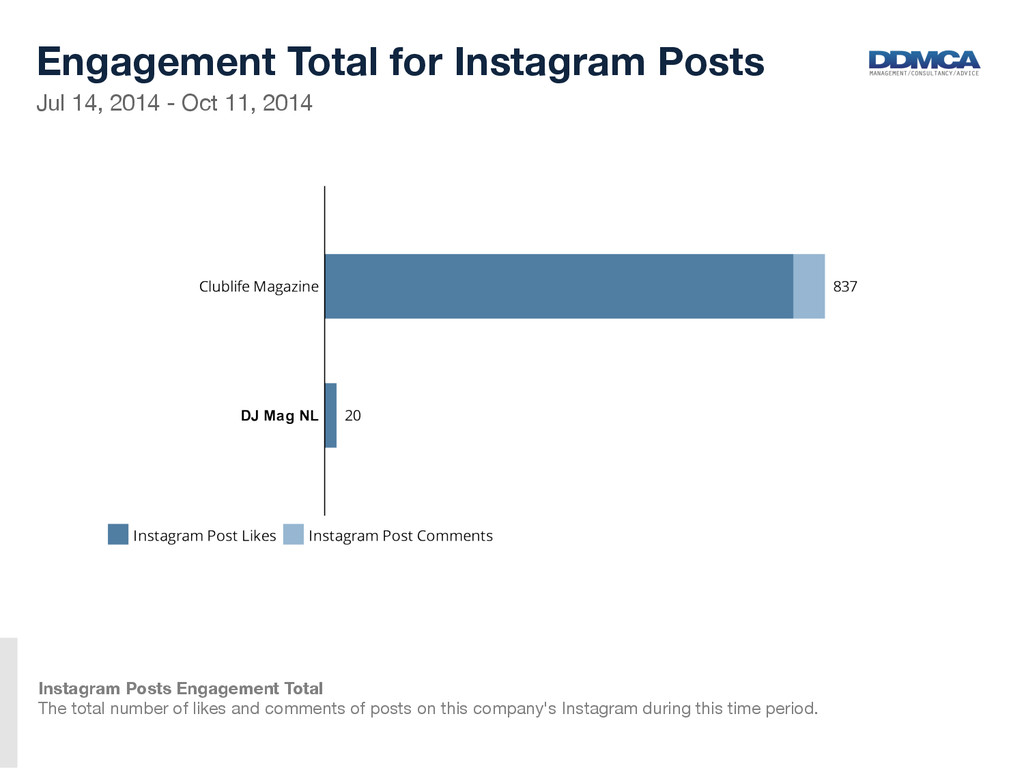
for Instagram Posts Instagram Posts Engagement Total The total number of likes and comments of posts on this company's Instagram during this time period.
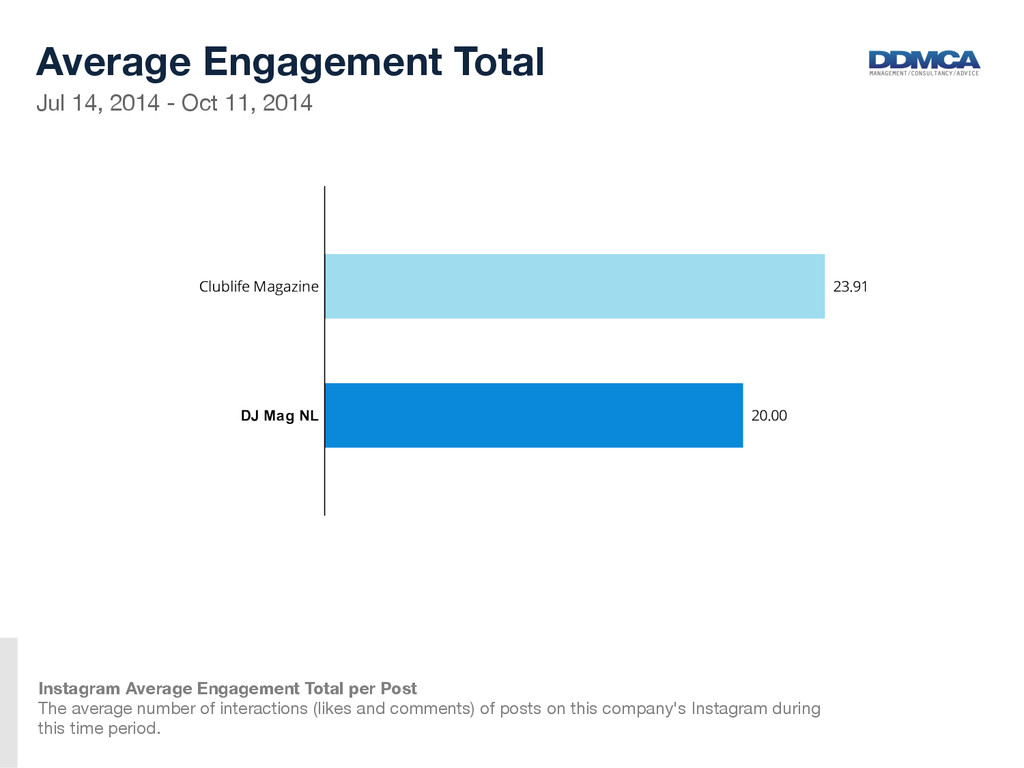
Total Instagram Average Engagement Total per Post The average number of interactions (likes and comments) of posts on this company's Instagram during this time period.
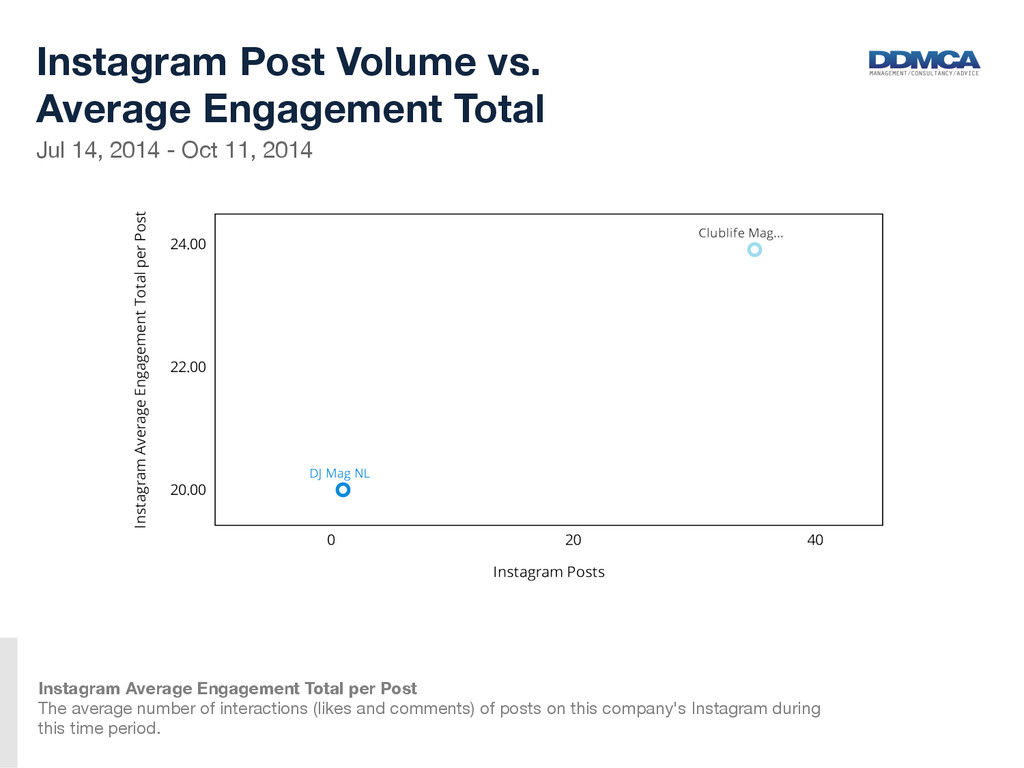
Volume vs. Average Engagement Total Instagram Average Engagement Total per Post The average number of interactions (likes and comments) of posts on this company's Instagram during this time period.
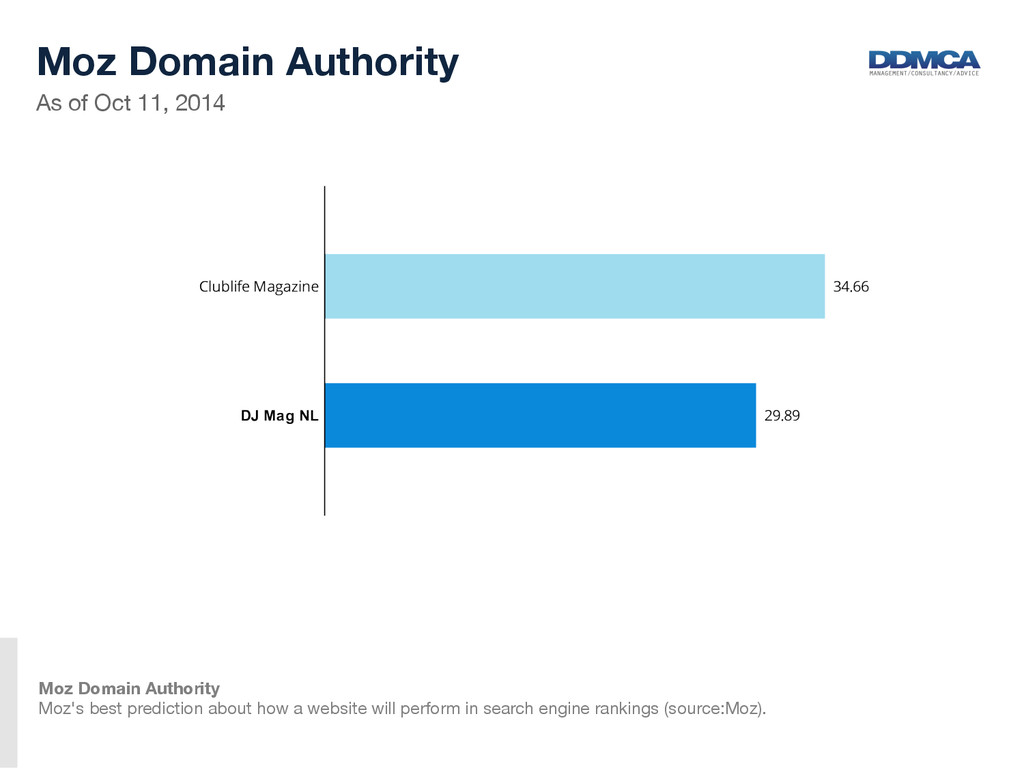
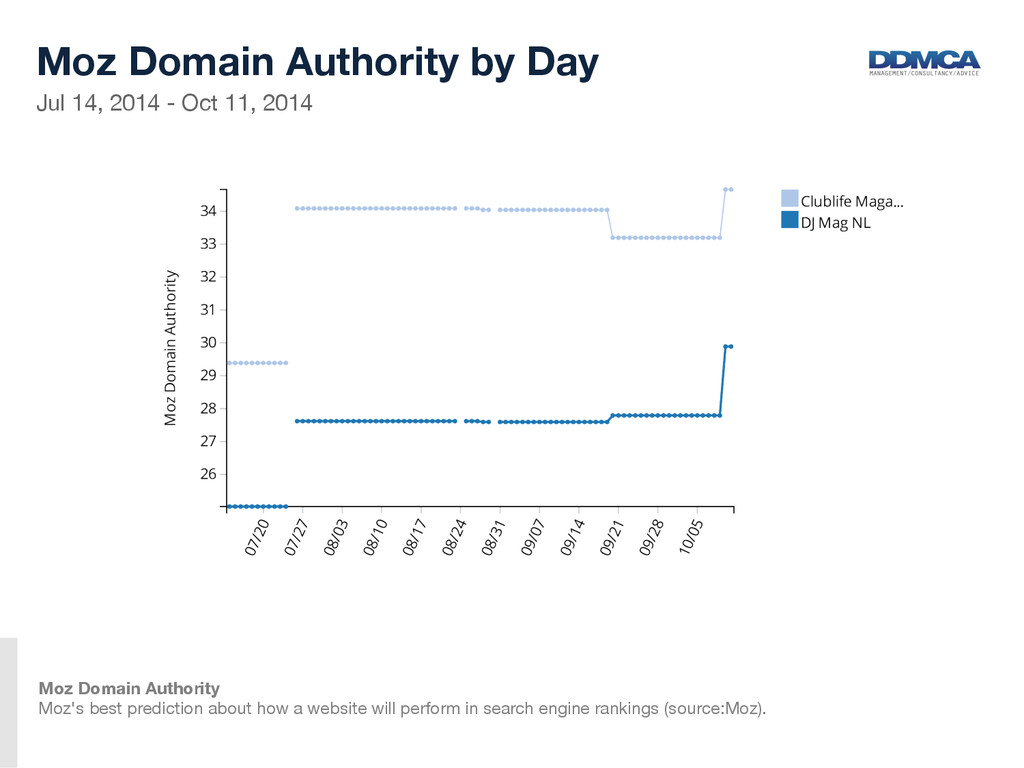
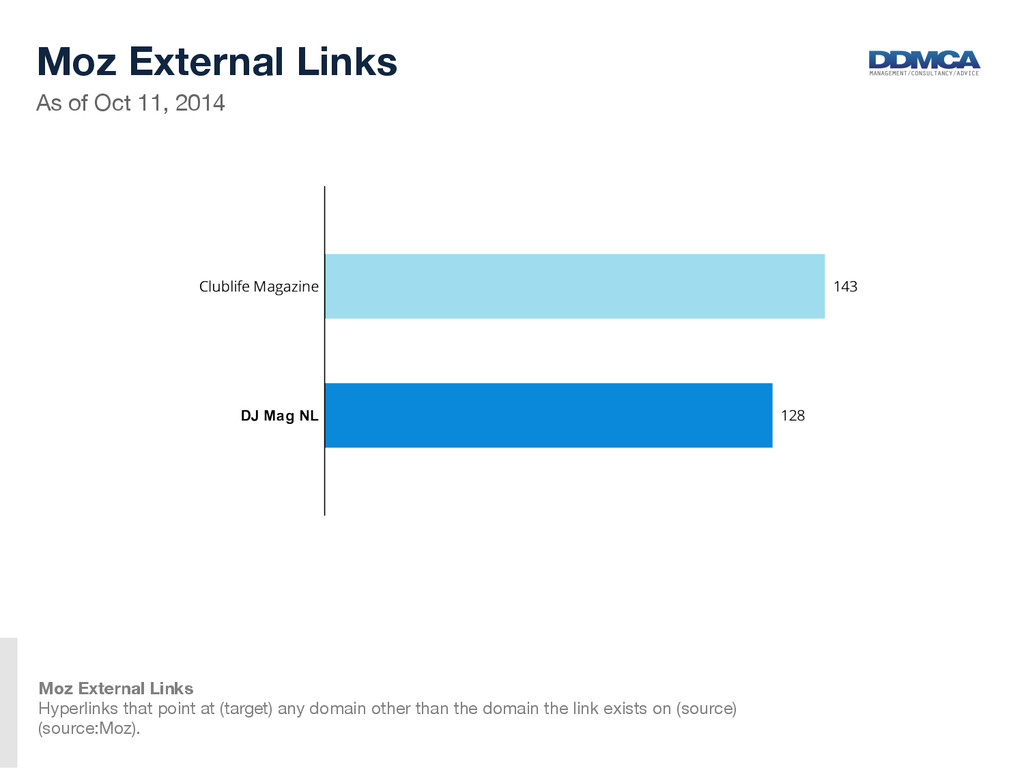
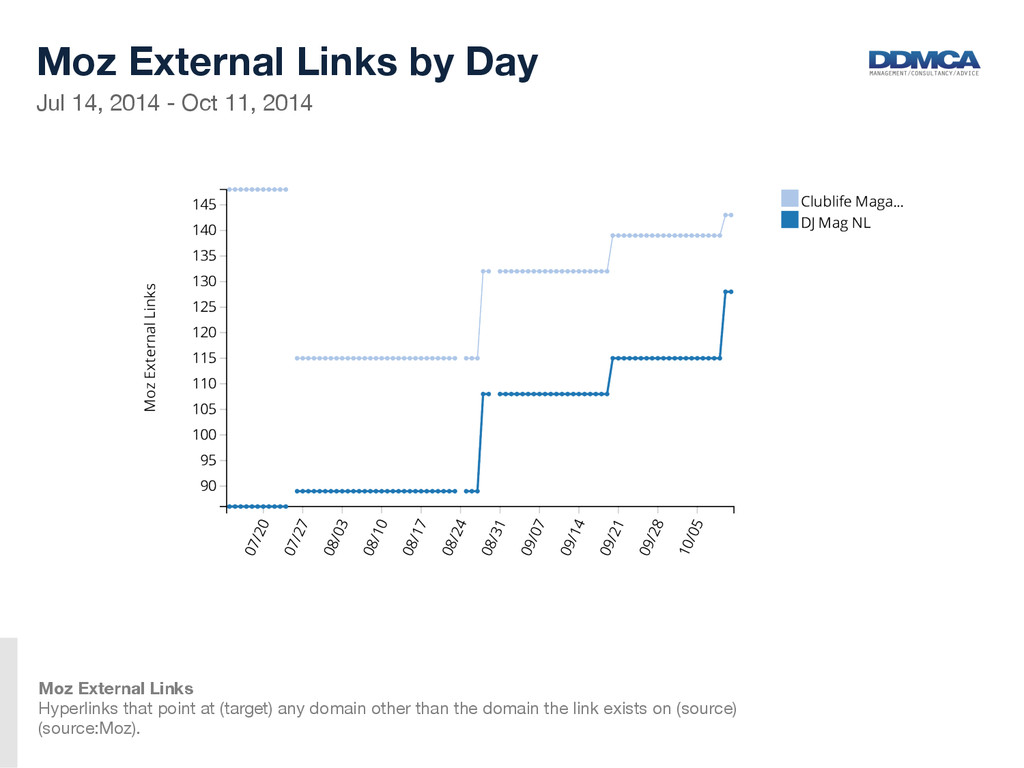
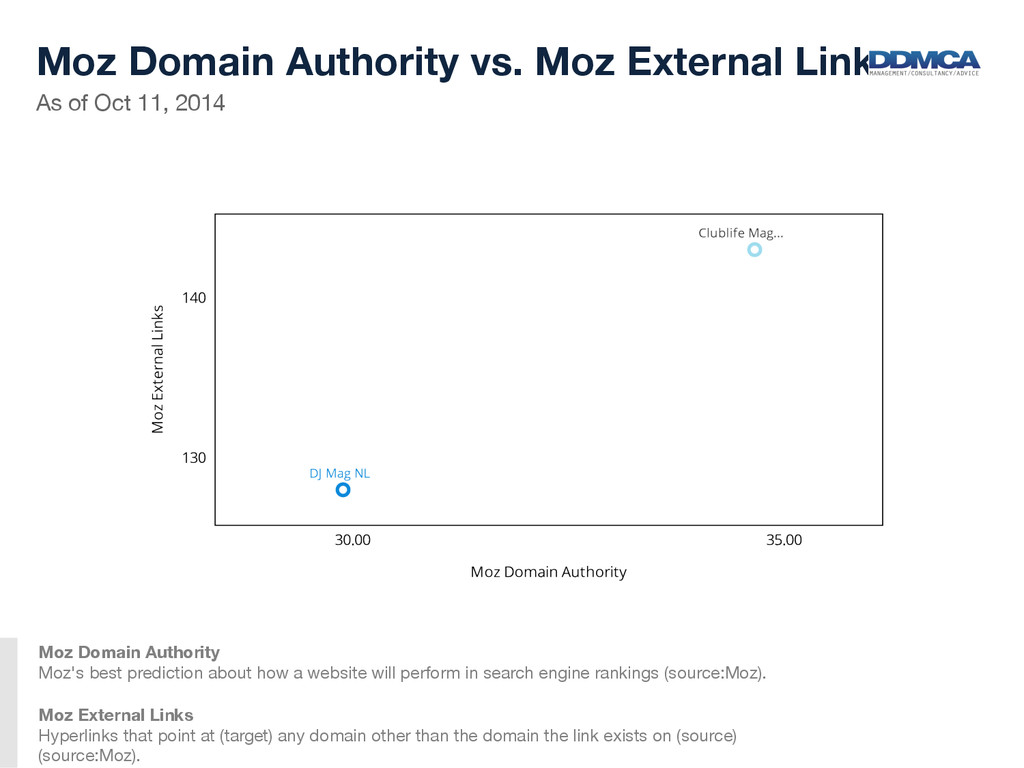
Moz External Links Moz Domain Authority Moz's best prediction about how a website will perform in search engine rankings (source:Moz). Moz External Links Hyperlinks that point at (target) any domain other than the domain the link exists on (source) (source:Moz).
has been carefully reviewed. DDMCA will not be liable in respect of any business, including without limitation loss of or damage to profits, income, revenue, business, contracts, commercial opportunities or goodwill. This report is issued under Dutch copyright law and may not be reproduced, distributed, transmitted, displayed, published or broadcast without the prior written permission of DDMCA the owner of the issued content. You may not alter or remove any trademark, copyright or other notice from copies of the content without prior written permission. DDMCA is currently working to refine the models based on data from several social analytics from different social media channels. Questions how to evaluate a DJ? Need a full report or benchmark for a DJ? An offer for a full complete customized report can be required via the details below. Contact (to order a report or book a seminar) DDMCA Attn. Denis Doeland Keizersgracht 330-b 1016 EZ Amsterdam The Netherlands Mobile | +31 6 13520250 E-mail | [email protected] Web | ddmca.com or denisdoeland.com