Upgrade to Pro — share decks privately, control downloads, hide ads and more …

Overcoming Observer Effects in Memory Managemen...

Overcoming Observer Effects in Memory Management with DAMON

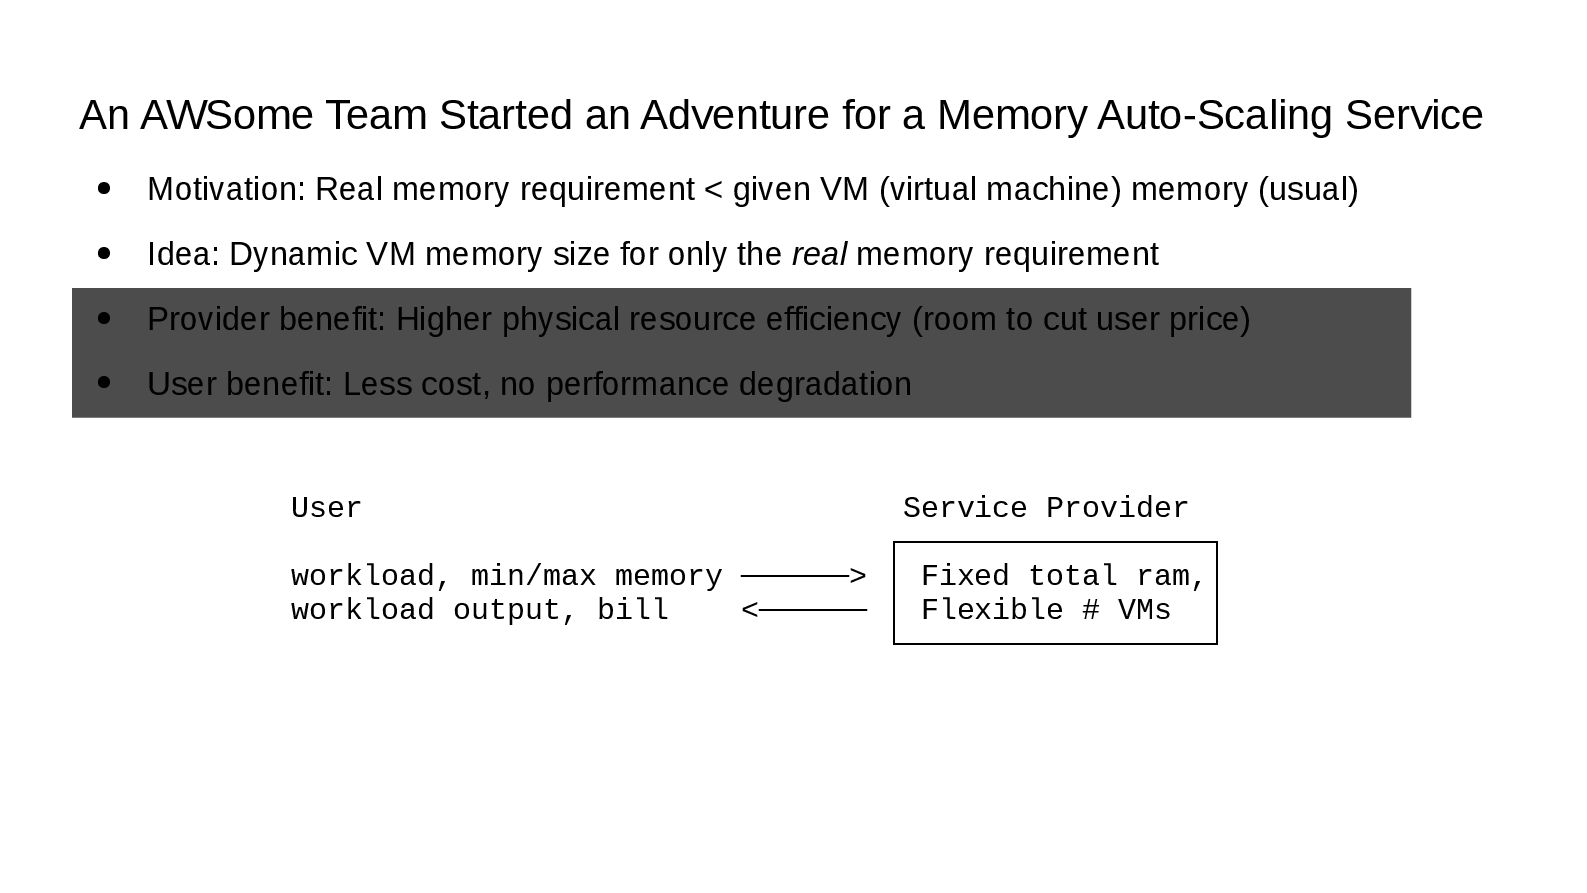
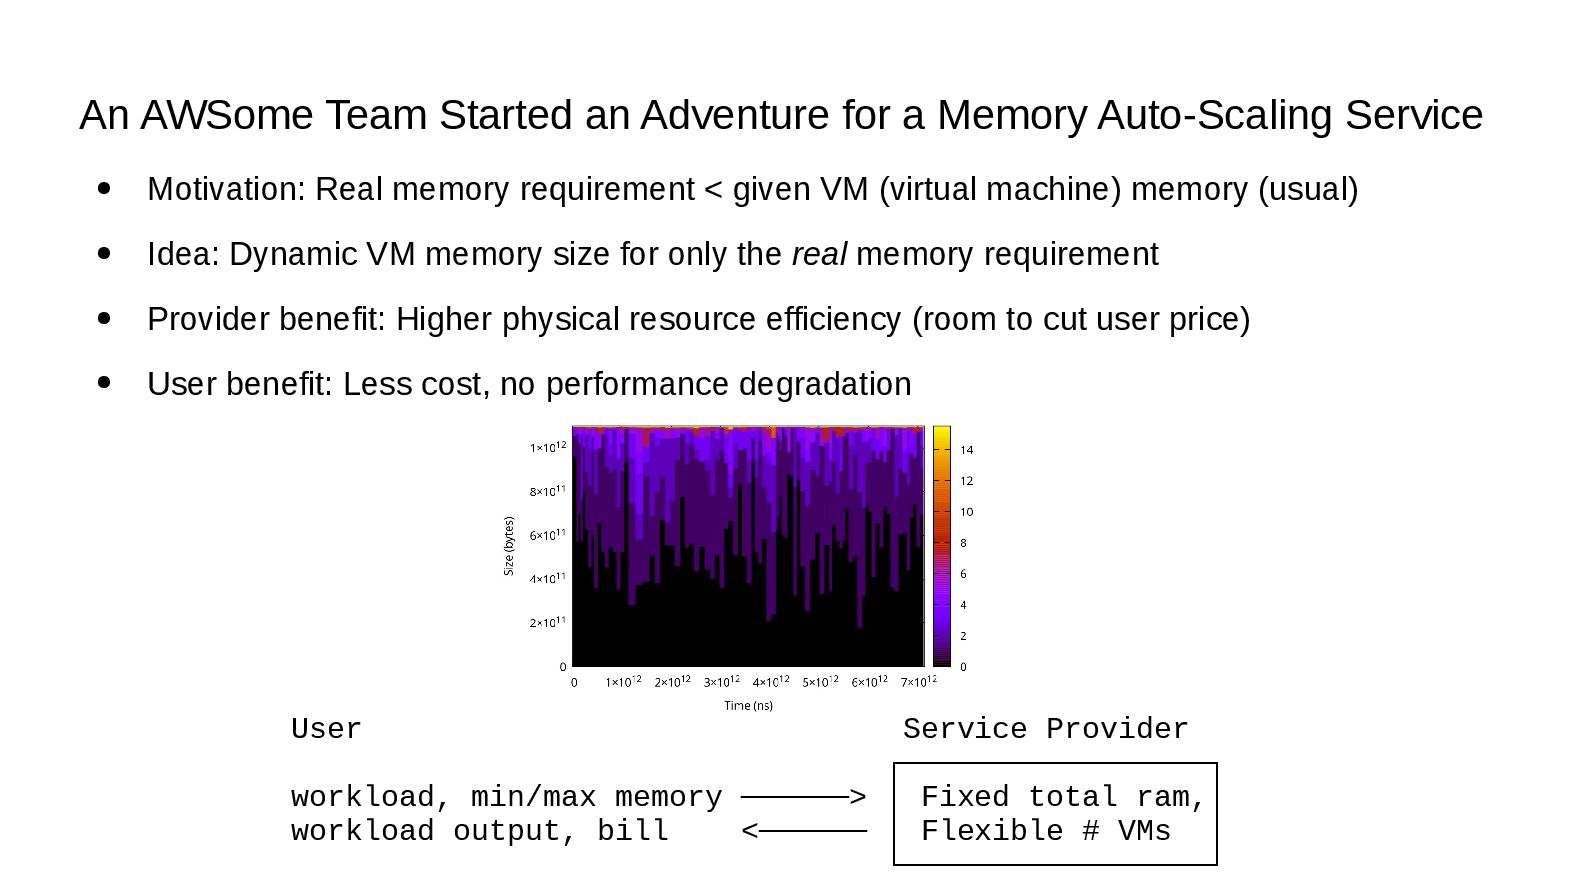
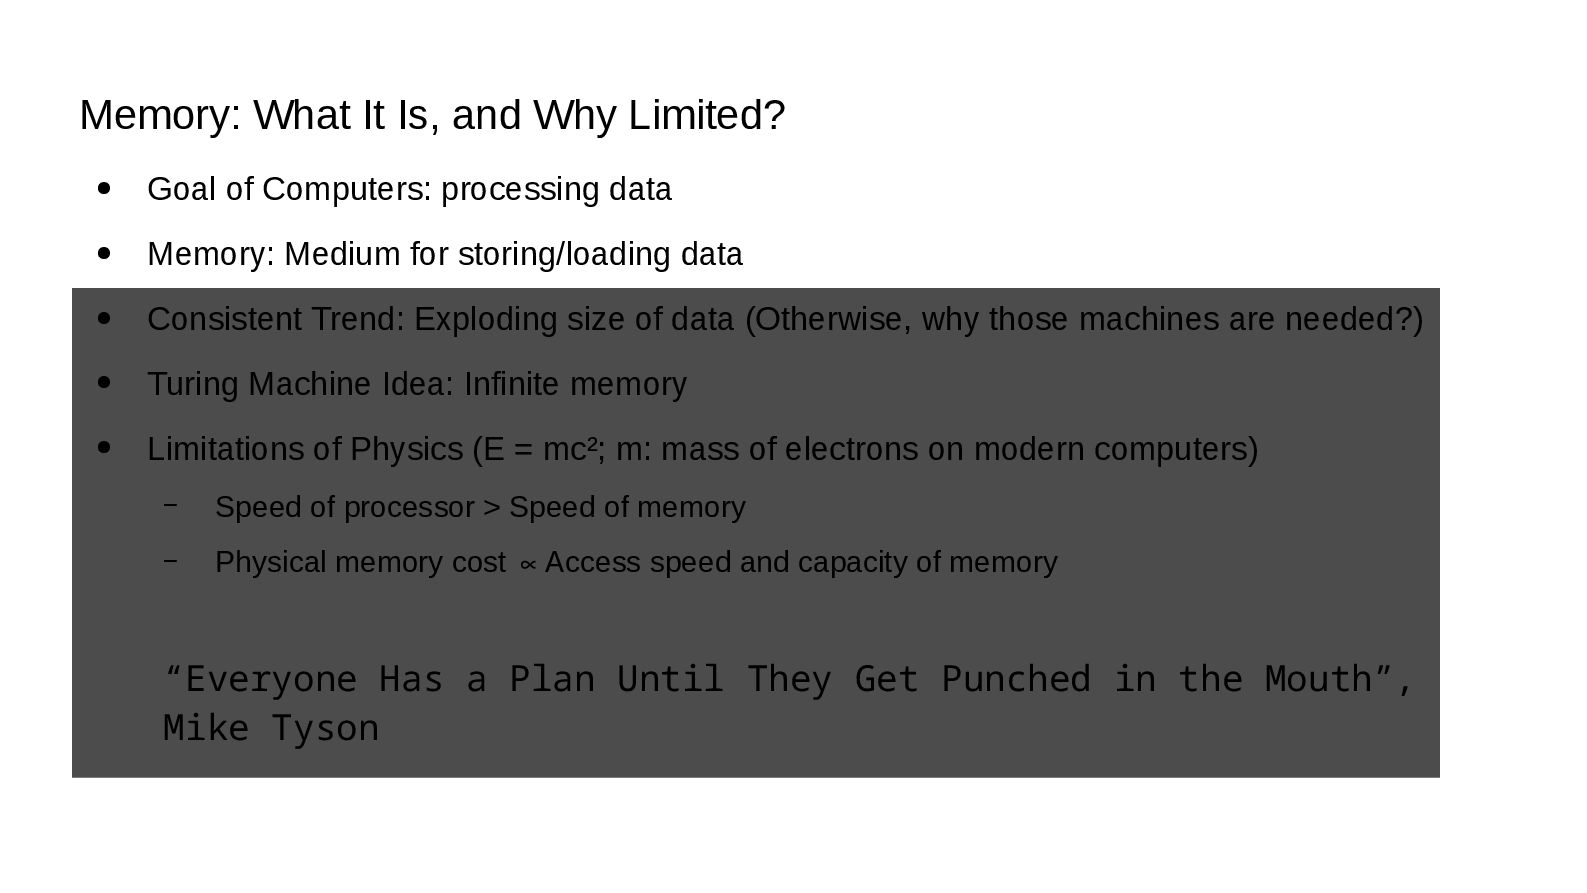
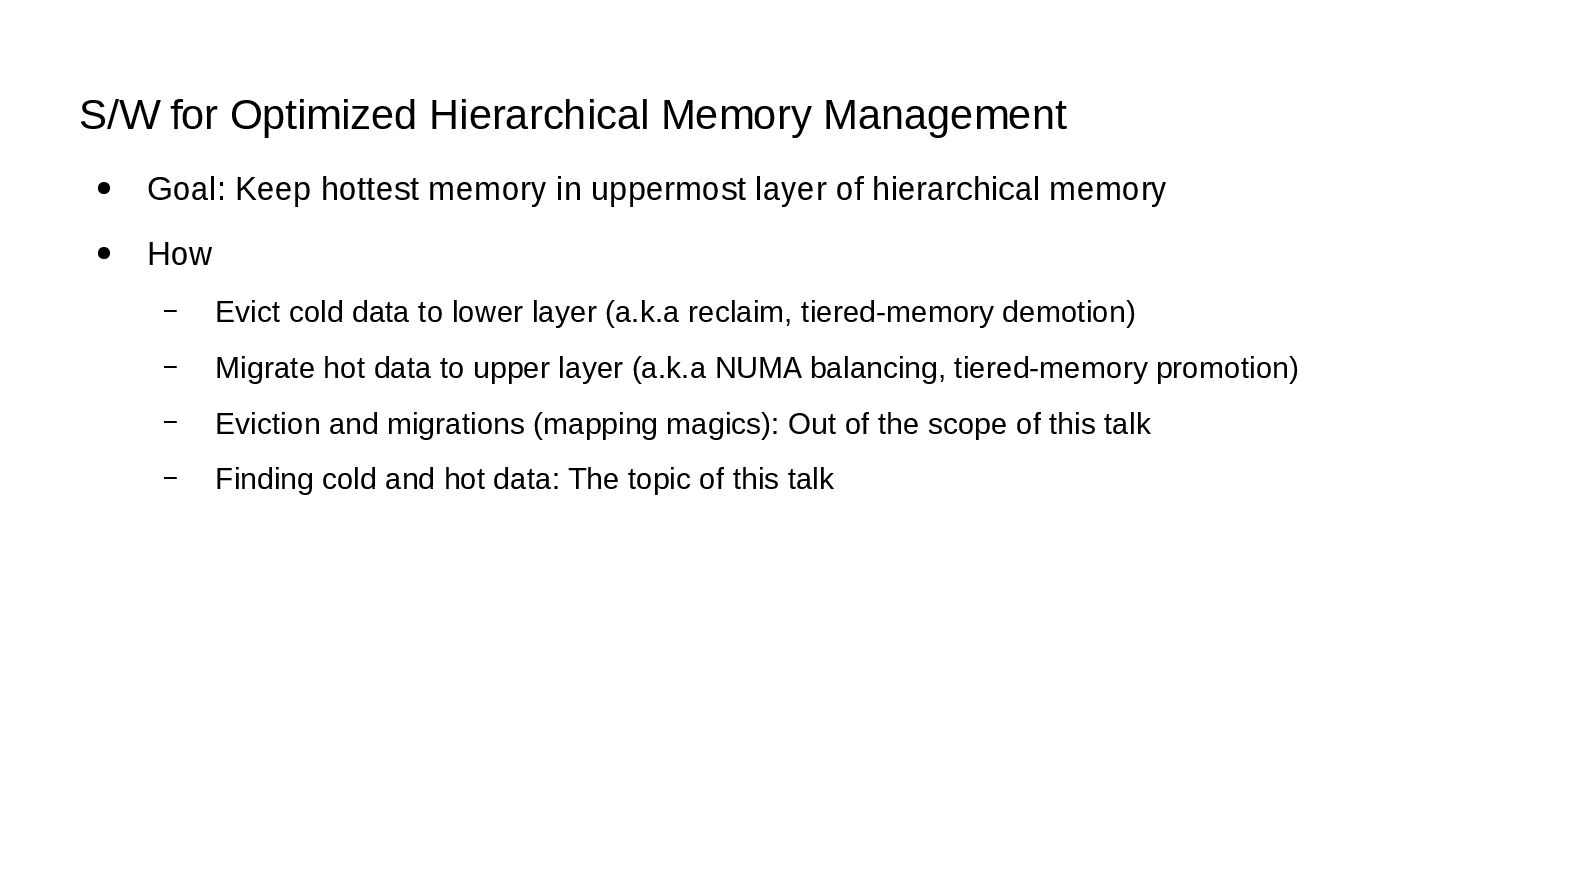
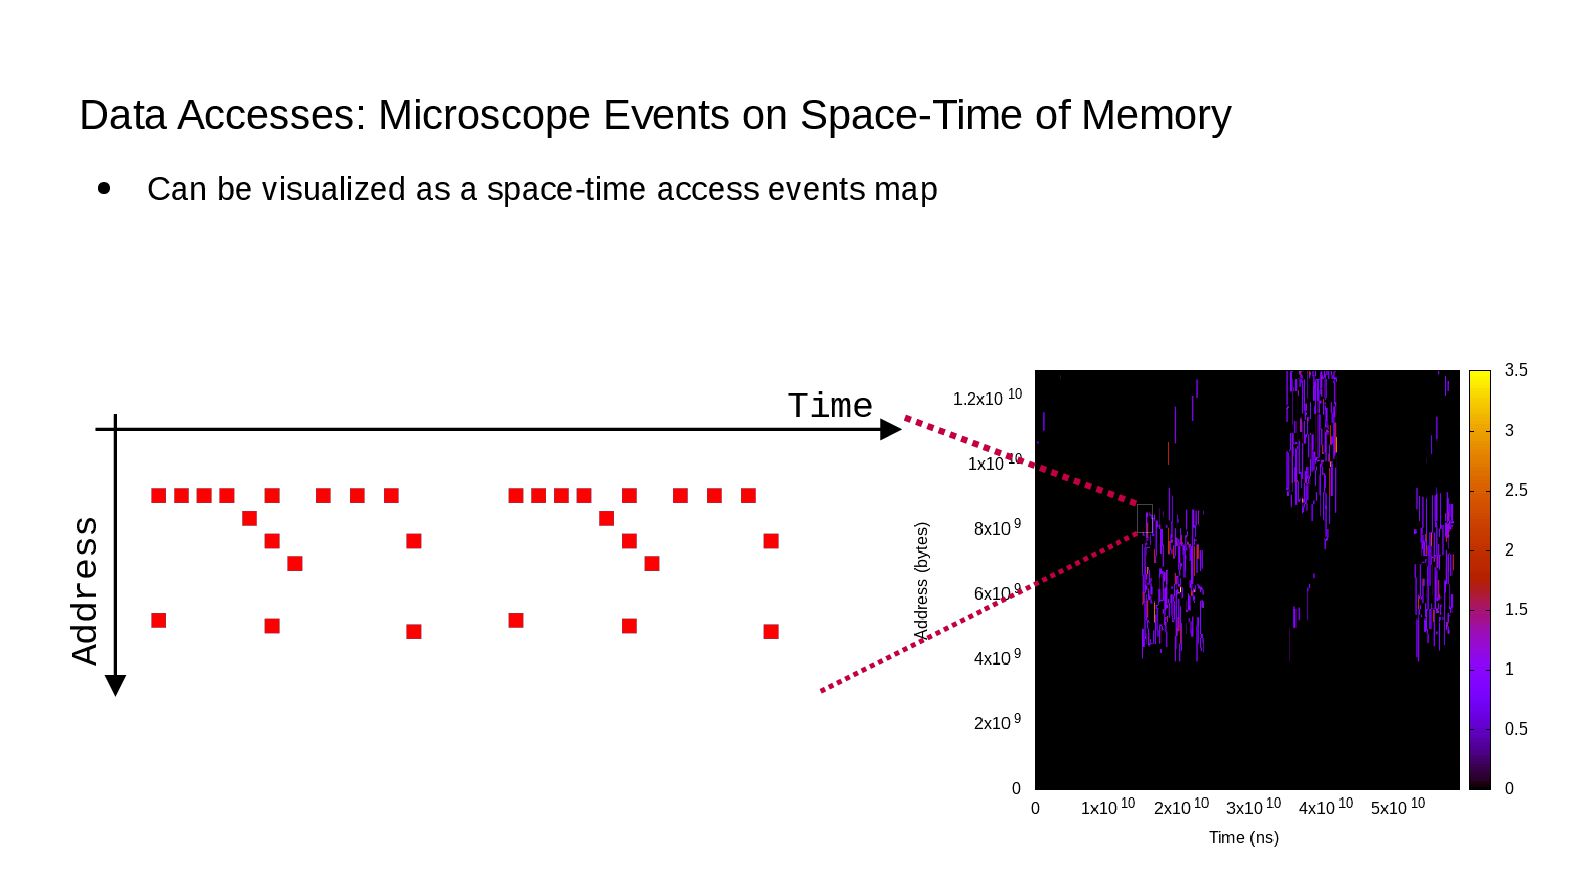
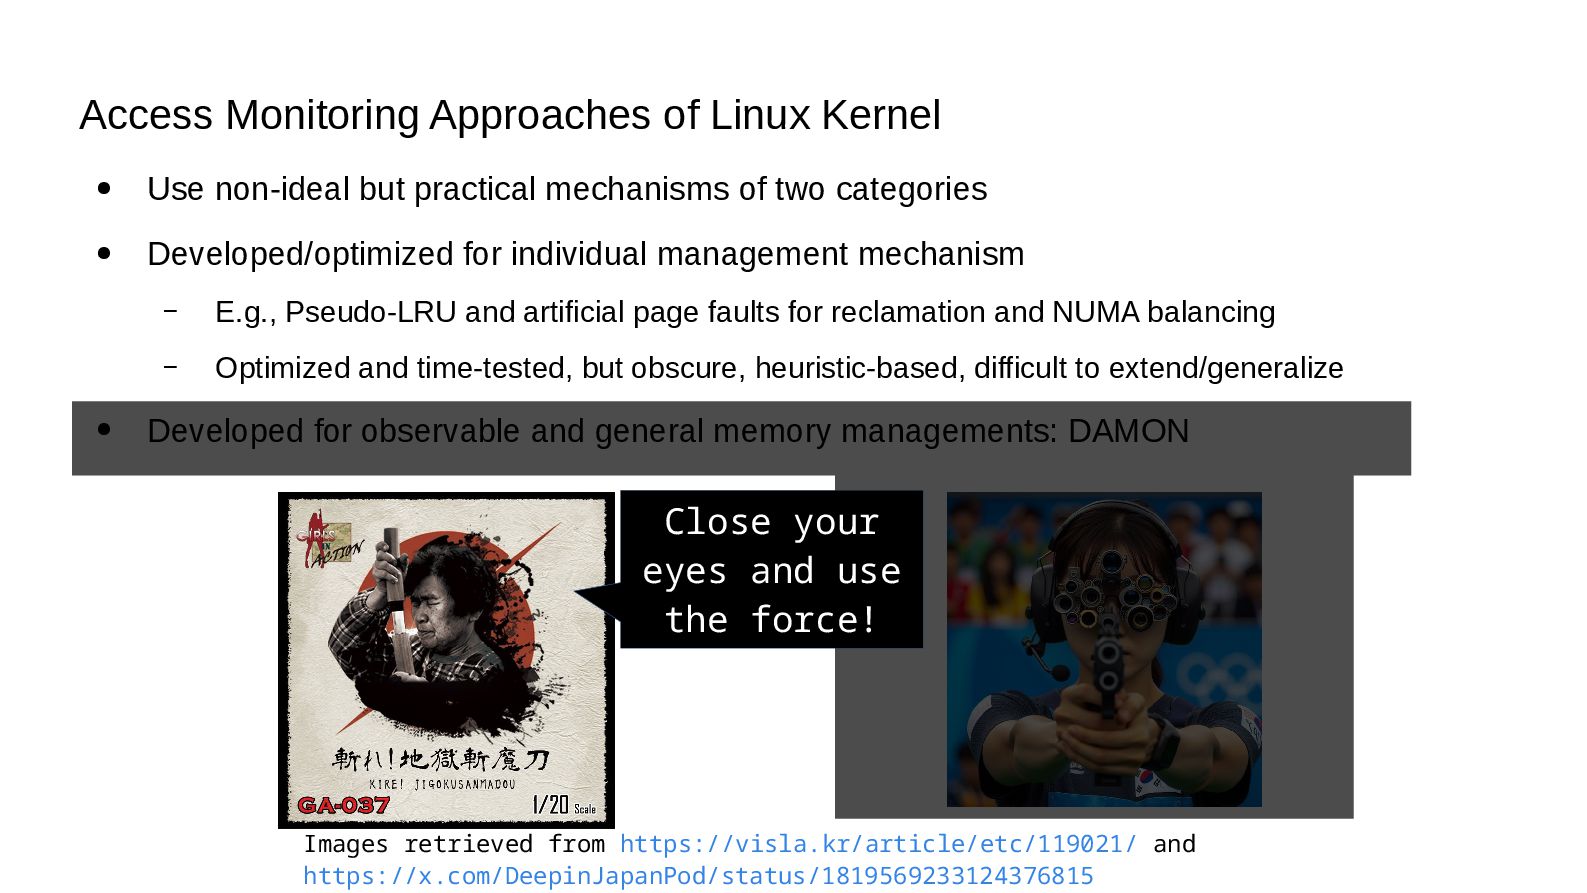
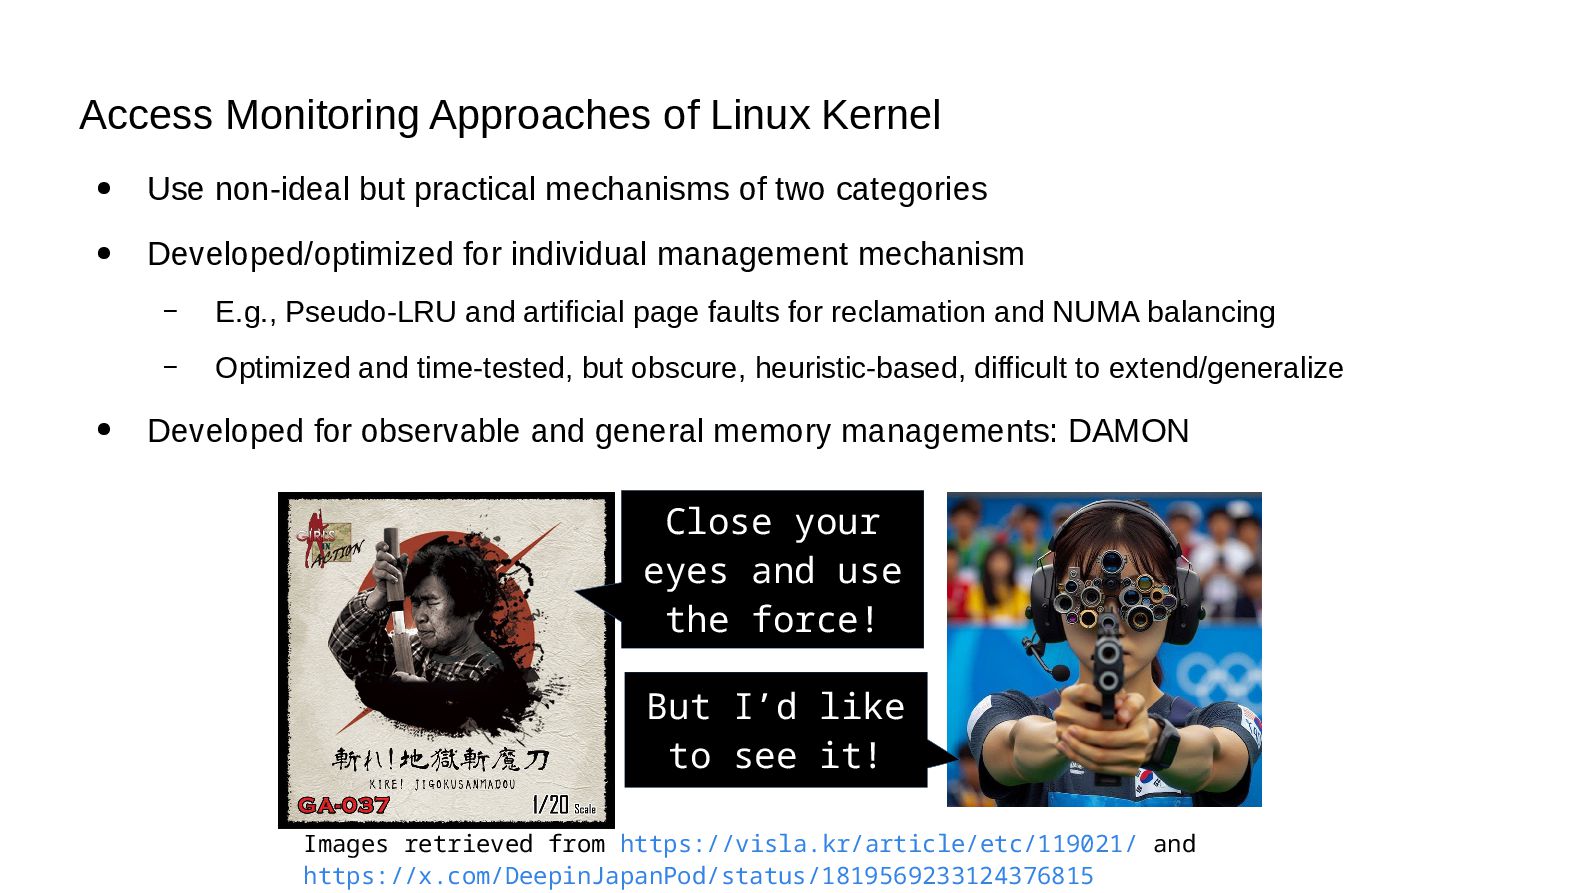
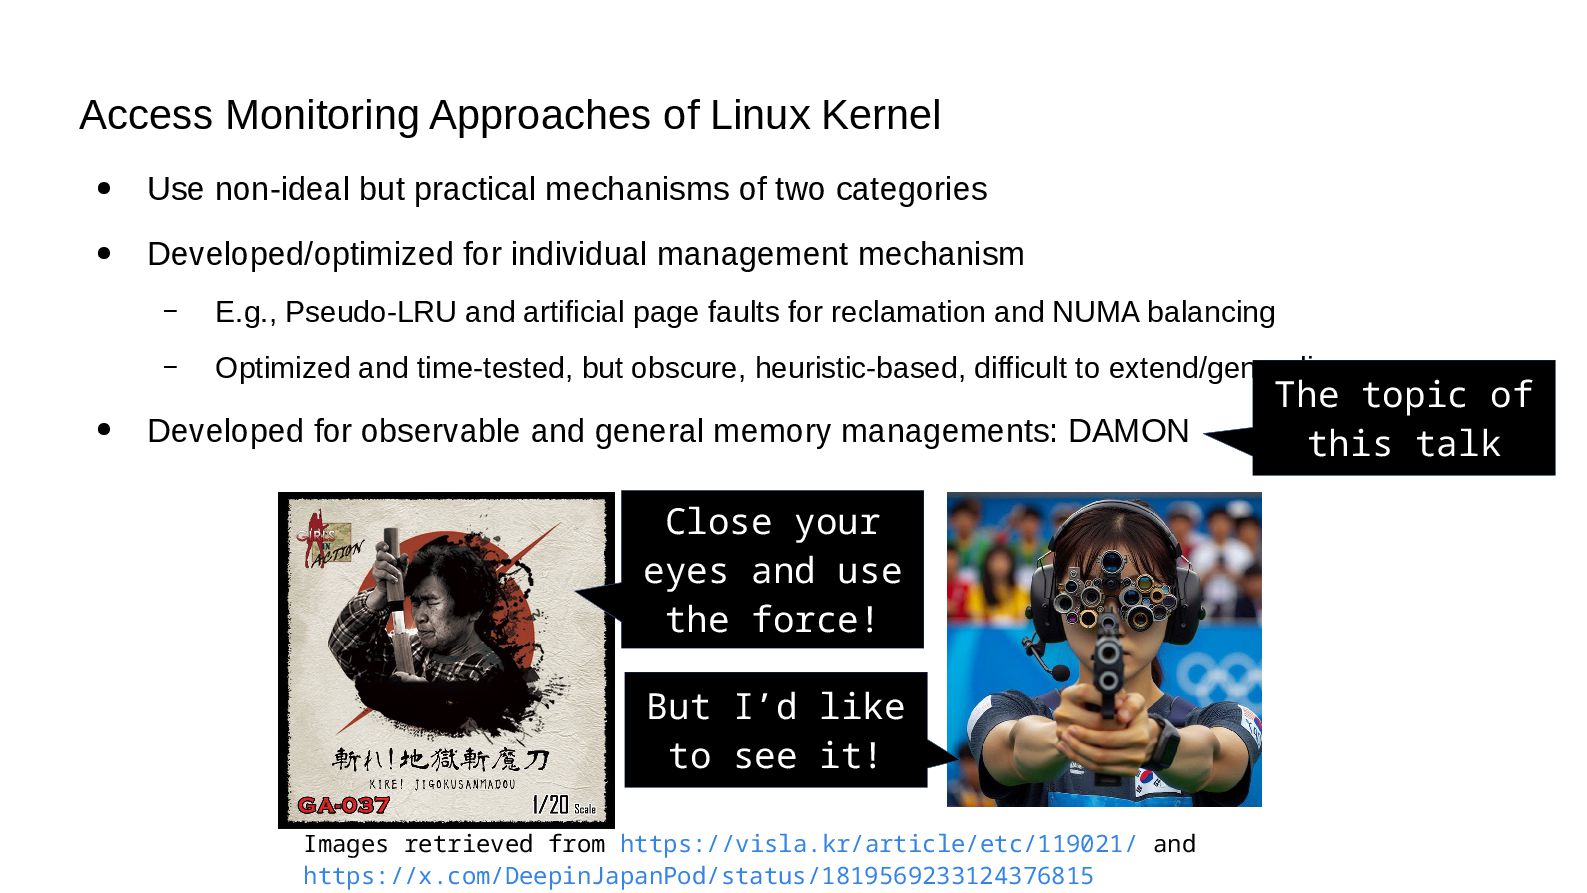
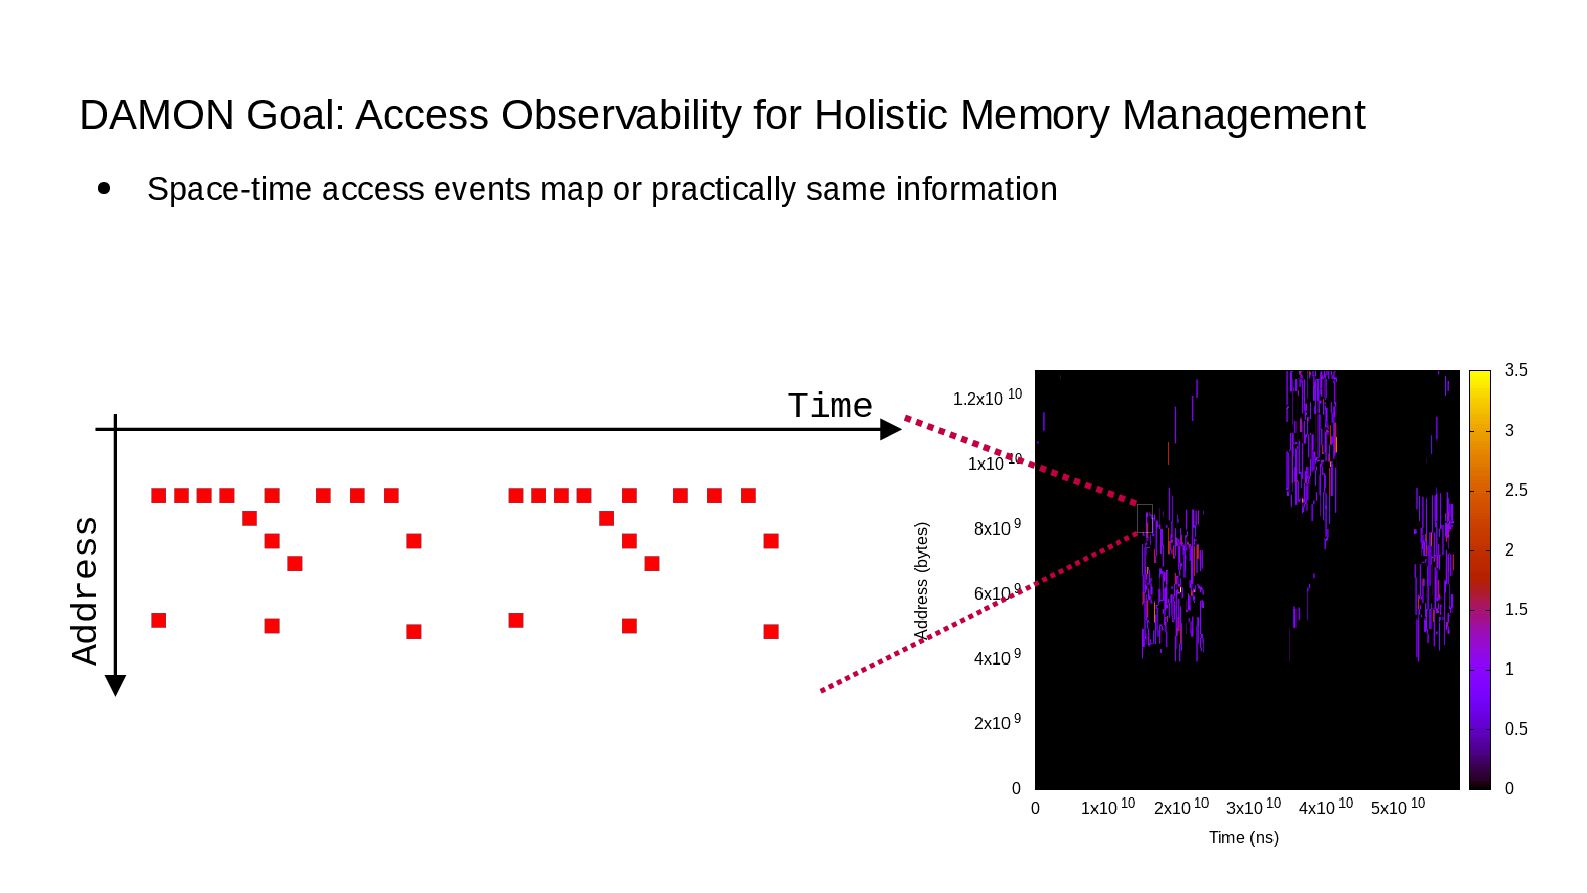
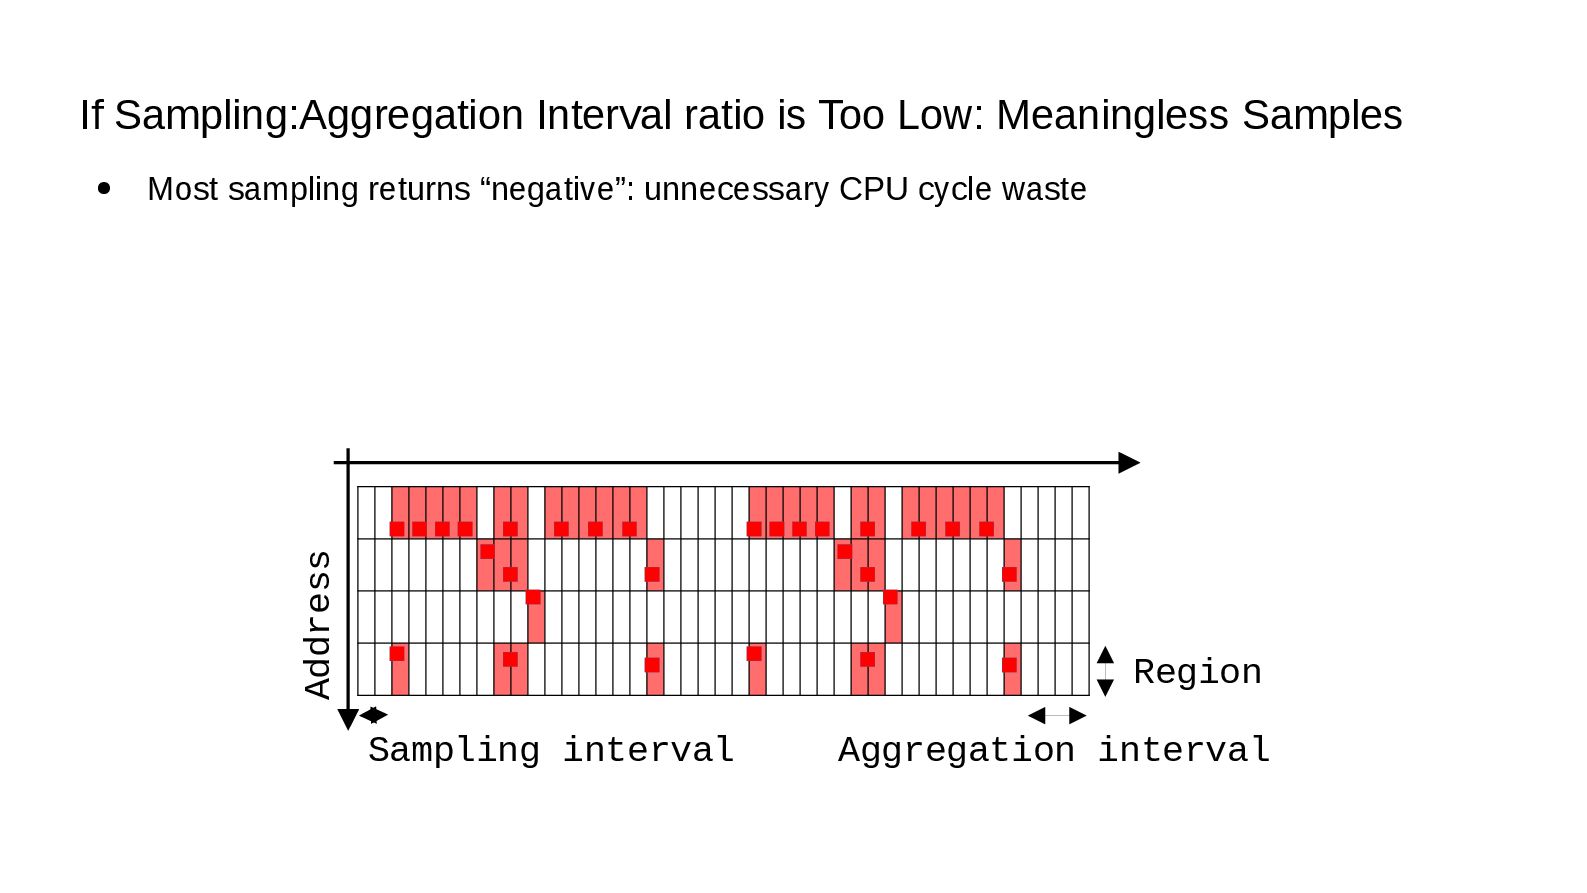
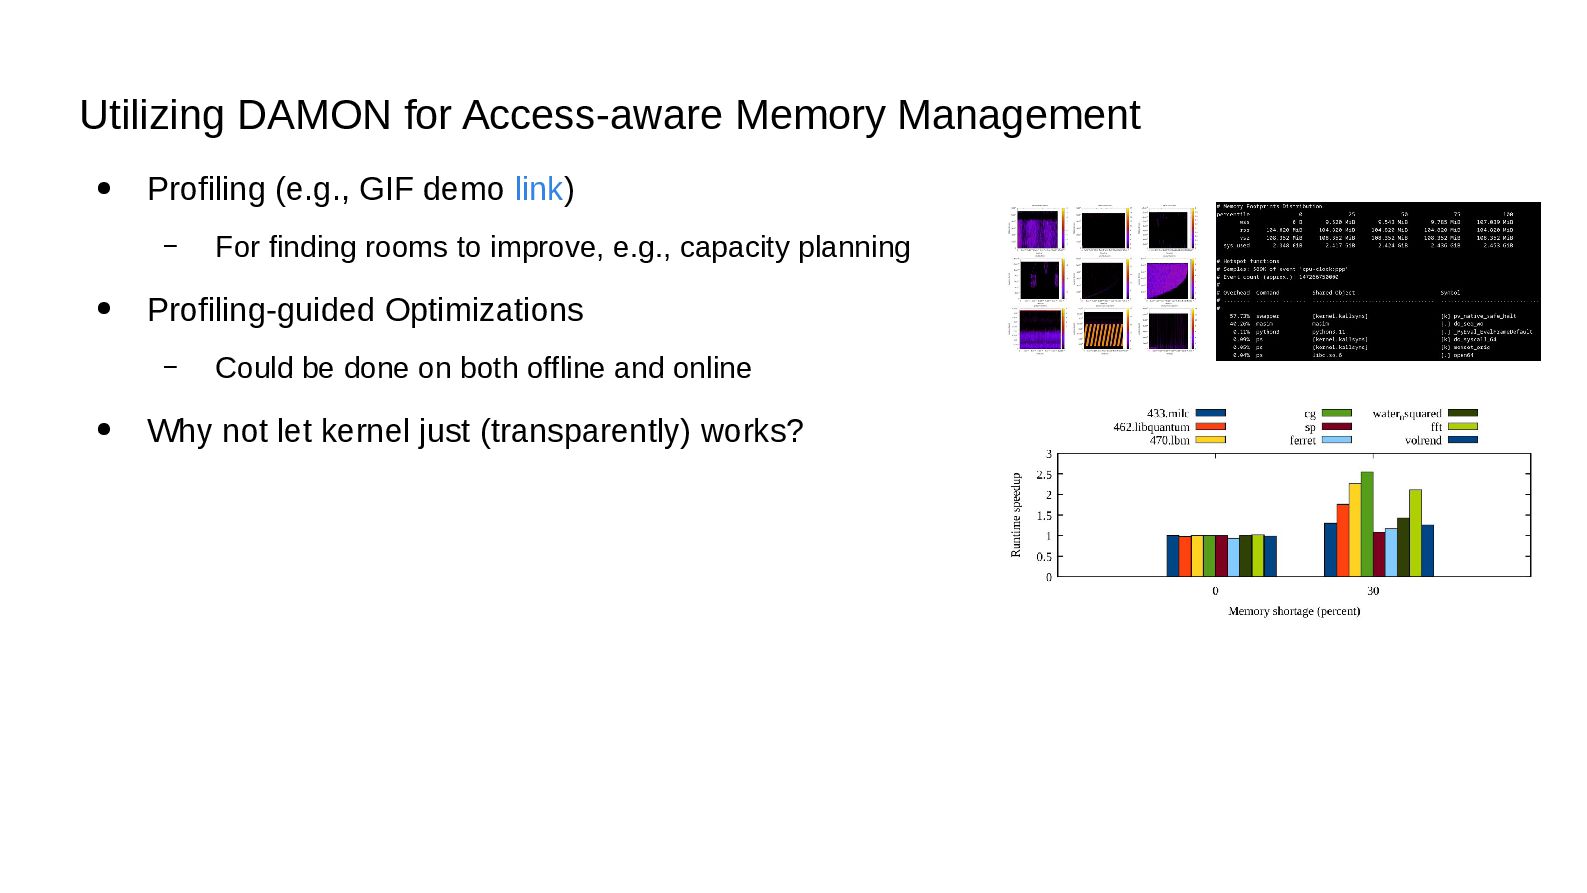
Knowing the data access pattern of a system and its workloads is crucial for efficient memory management. However, accurate measurement can be challenging due to observer effects.

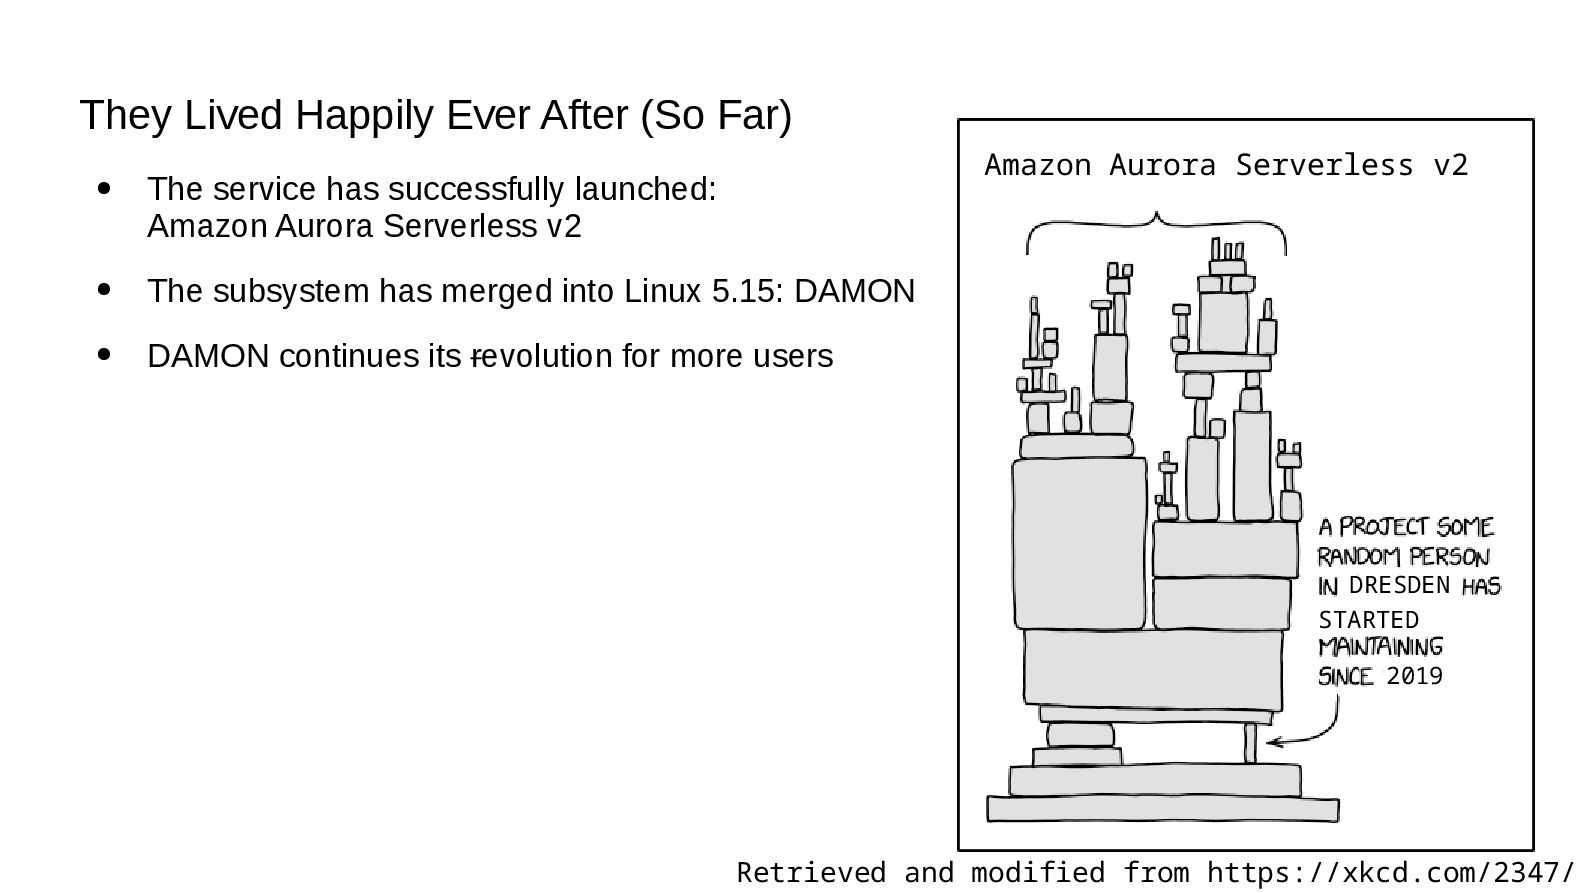
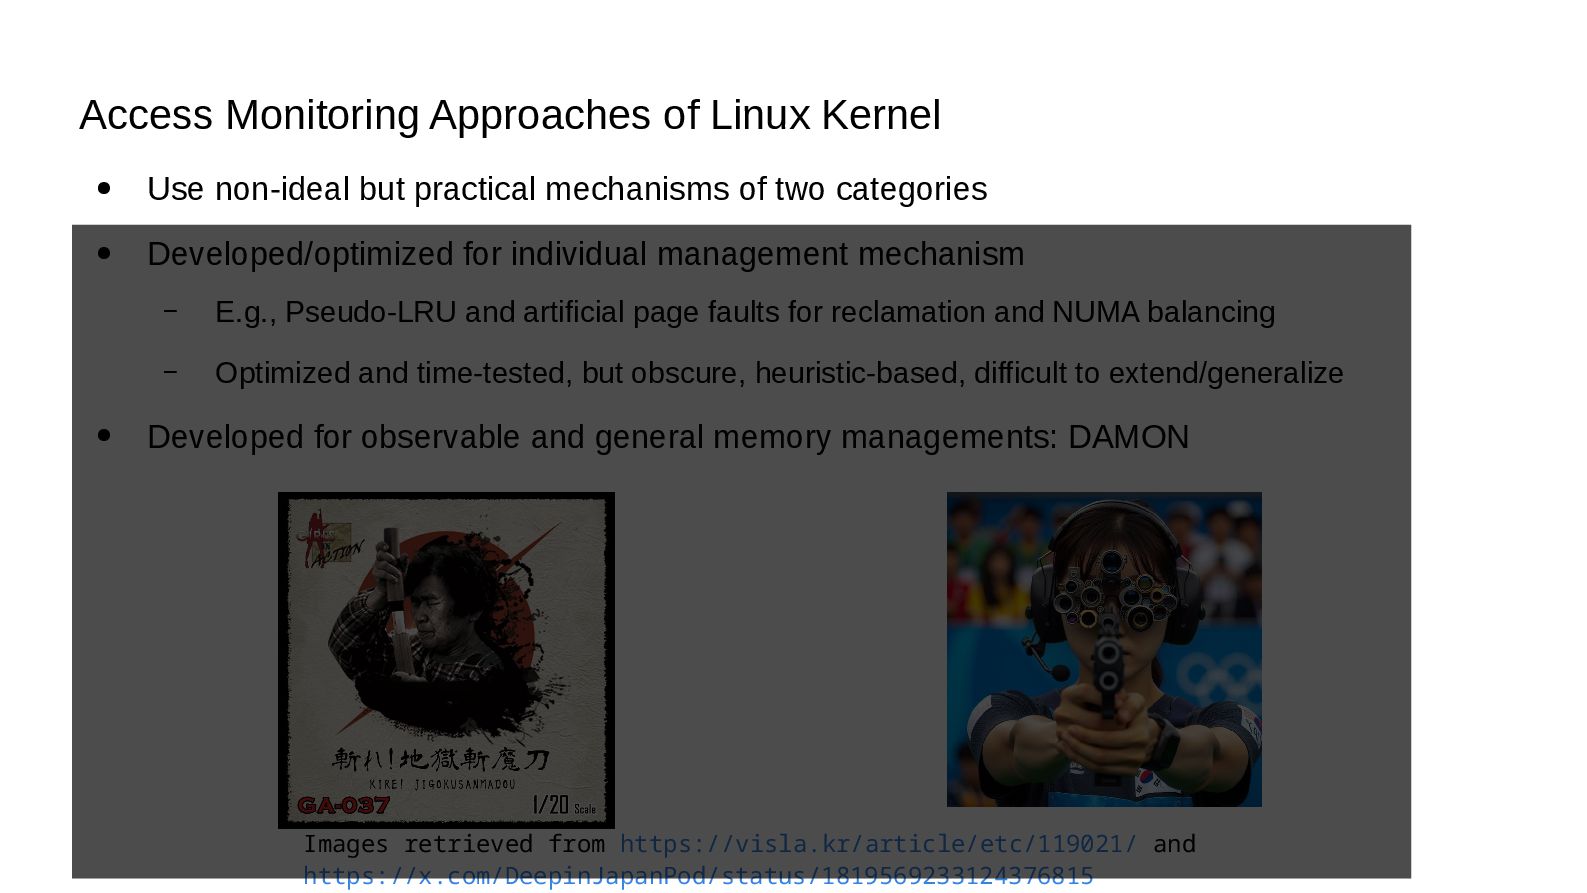
This talk will introduce how the Linux kernel overcomes this problem using the DAMON subsystem and share practical use cases of it for improving memory efficiencies on real world product Linux systems.

SJ Park

Avatar for Kernel Recipes

Kernel Recipes PRO

September 25, 2025
Tweet

More Decks by Kernel Recipes

Other Decks in Technology

Transcript

  1. Overcoming Observer Effects in Memory Management with DAMON SeongJae Park

    (SJ) <[email protected]> <[email protected]> https://damonitor.github.io Sep 23, 2025 Kernel Recipes’25, Paris QR code generated from https://qr.io
  2. Table of Contents • A User Story: A Memory Auto-scaling

    Service Development – 5 mins • Observer Effects in Memory Management – 5 mins • How DAMON Overcomes the Observer Effect – 20 mins • DAMON Use Cases – 5 mins • Getting Started – 2 mins • QnA – 8 mins
  3. An AWSome Team Started an Adventure for a Memory Auto-Scaling

    Service • Motivation: Real memory requirement < given VM (virtual machine) memory (usual) • Idea: Dynamic VM memory size for only the real memory requirement • Provider benefit: Higher physical resource efficiency (room to cut user price) • User benefit: Less cost, no performance degradation
  4. An AWSome Team Started an Adventure for a Memory Auto-Scaling

    Service • Motivation: Real memory requirement < given VM (virtual machine) memory (usual) • Idea: Dynamic VM memory size for only the real memory requirement • Provider benefit: Higher physical resource efficiency (room to cut user price) • User benefit: Less cost, no performance degradation User Service Provider ┌─────────────────┐ workload, min/max memory ──────> │ Fixed total ram,│ workload output, bill <────── │ Flexible # VMs │ └─────────────────┘
  5. An AWSome Team Started an Adventure for a Memory Auto-Scaling

    Service • Motivation: Real memory requirement < given VM (virtual machine) memory (usual) • Idea: Dynamic VM memory size for only the real memory requirement • Provider benefit: Higher physical resource efficiency (room to cut user price) • User benefit: Less cost, no performance degradation User Service Provider ┌─────────────────┐ workload, min/max memory ──────> │ Fixed total ram,│ workload output, bill <────── │ Flexible # VMs │ └─────────────────┘
  6. The Quest: Knowing Real Memory Requirement • Allocated memory !=

    Real (or, critical) memory requirements • Major challenge: Overhead and Accuracy • No good solution was available back then (<Linux 5.15 era) $ sudo damo monitor --report_type holistic $(pidof $MY_WORKLOAD) [...] # Memory Footprints Distribution percentile 0 25 50 75 100 wss 13.539 MiB 13.754 MiB 15.293 MiB 16.605 MiB 16.605 MiB rss 105.102 MiB 105.102 MiB 105.102 MiB 105.102 MiB 105.102 MiB vsz 108.277 MiB 108.277 MiB 108.277 MiB 108.277 MiB 108.277 MiB sys_used 943.090 MiB 943.090 MiB 943.090 MiB 943.090 MiB 943.090 MiB [...]
  7. User Meets Kernel • A kernel programmer in Dresden was

    looking for users of their new kernel feature • The feature was advertised as what the service team was looking for • They eventually met and co-developed the service with the kernel feature <Image captured from the feature’s project website>
  8. They Lived Happily Ever After (So Far) • The service

    has successfully launched: Amazon Aurora Serverless v2 • The subsystem has merged into Linux 5.15: DAMON • DAMON continues its revolution for more users Amazon Aurora Serverless v2 DRESDEN 2019 Retrieved and modified from https://xkcd.com/2347/ STARTED
  9. Table of Contents • A User Story: A Memory Auto-scaling

    Service Development – 5 mins • Observer Effects in Memory Management – 5 mins • How DAMON Overcomes the Observer Effect – 20 mins • DAMON Use Cases – 4 mins • Getting Started – 3 mins • QnA – 8 mins
  10. Memory: What It Is, and Why Limited? • Goal of

    Computers: processing data • Memory: Medium for storing/loading data • Consistent Trend: Exploding size of data (Otherwise, why those machines are needed?) • Turing Machine Idea: Infinite memory • Limitations of Physics (E = mc²; m: mass of electrons on modern computers) – Speed of processor > Speed of memory – Physical memory cost Access speed and capacity of memory ∝ “Everyone Has a Plan Until They Get Punched in the Mouth”, Mike Tyson
  11. Memory: What It Is, and Why Limited? • Goal of

    Computers: processing data • Memory: Medium for storing/loading data • Consistent Trend: Exploding size of data (Otherwise, why those machines are needed?) • Turing Machine Idea: Infinite memory • Limitations of Physics (E = mc²; m: mass of electrons on modern computers) • Speed of processor > Speed of memory • Physical memory cost Access speed and capacity of memory ∝ “Everyone Has a Plan Until They Get Punched in the Mouth”, Mike Tyson Image was retrieved from https://explodingtopics.com/blog/data-generated-per-day
  12. Memory: What It Is, and Why Limited? • Goal of

    Computers: processing data • Memory: Medium for storing/loading data • Consistent Trend: Exploding size of data • Turing Machine Idea: Infinite memory • Limitations of Physics (E = mc²; m: mass of electrons on modern computers) – Speed of processor > Speed of memory – Physical memory cost Access speed and capacity of memory ∝ “Everyone Has a Plan Until They Get Punched in the Mouth”, Mike Tyson x Image was retrieved from https://lifeiscomputation.com/can-a-finite-physical-device-be-turing-equivalent/
  13. Memory: What It Is, and Why Limited? • Goal of

    Computers: processing data • Memory: Medium for storing/loading data • Consistent Trend: Exploding size of data • Turing Machine Idea: Infinite memory • Limitations of Physics (E = mc²; m: mass of electrons on modern computers) – Speed of processor > Speed of memory – Physical memory cost Access speed and capacity of memory ∝ “Everyone Has a Plan Until They Get Punched in the Mouth”, Mike Tyson
  14. H/W Solution for Memory Limitation: Hierarchical Memory System • Hierarchical

    memory: construct memory with different cost/performance devices – Fastest (smallest) device on uppermost layer (nearest to the processor) – More frequently accessed (hot) data on upper layer – H/W cannot save the world alone! (many too complicated, large scale cases) Cache DRAM SSD HDD Hot Data Warm Data Cold Data Frozen Data
  15. S/W for Optimized Hierarchical Memory Management • Goal: Keep hottest

    memory in uppermost layer of hierarchical memory • How – Evict cold data to lower layer (a.k.a reclaim, tiered-memory demotion) – Migrate hot data to upper layer (a.k.a NUMA balancing, tiered-memory promotion) – Eviction and migrations (mapping magics): Out of the scope of this talk – Finding cold and hot data: The topic of this talk
  16. Data Accesses: Microscope Events on Space-Time of Memory • Can

    be visualized as a space-time access events map Time Address
  17. Observer Effects in Data Access Monitoring • Ideal goal: Precise

    (every bit), Complete (every moment), Light (prod online) • Promising Idea: Record every access whenever it is made • Bad reality: Inevitable observer effects – Add monitoring-purpose memory accesses and assignments for each memory access • Good reality: We’re open to negotiate – For practical memory management, a high level view can be enough “any data within the system representing state in the real world outside of the system is always and forever outdated” - Paul E. McKenney, Chapter 9.5, “Is Parallel Programming Hard, And, If So, What Can You Do About It?”
  18. Access Monitoring Approaches of Linux Kernel • Use non-ideal but

    practical mechanisms of two categories • Developed/optimized for individual management mechanism – E.g., Pseudo-LRU and artificial page faults for reclamation and NUMA balancing – Optimized and time-tested, but obscure, heuristic-based, difficult to extend/generalize • Developed for observable and general memory managements: DAMON Images retrieved from https://visla.kr/article/etc/119021/ and https://x.com/DeepinJapanPod/status/1819569233124376815
  19. Access Monitoring Approaches of Linux Kernel • Use non-ideal but

    practical mechanisms of two categories • Developed/optimized for individual management mechanism – E.g., Pseudo-LRU and artificial page faults for reclamation and NUMA balancing – Optimized and time-tested, but obscure, heuristic-based, difficult to extend/generalize • Developed for observable and general memory managements: DAMON Images retrieved from https://visla.kr/article/etc/119021/ and https://x.com/DeepinJapanPod/status/1819569233124376815 Close your eyes and use the force!
  20. Access Monitoring Approaches of Linux Kernel • Use non-ideal but

    practical mechanisms of two categories • Developed/optimized for individual management mechanism – E.g., Pseudo-LRU and artificial page faults for reclamation and NUMA balancing – Optimized and time-tested, but obscure, heuristic-based, difficult to extend/generalize • Developed for observable and general memory managements: DAMON Images retrieved from https://visla.kr/article/etc/119021/ and https://x.com/DeepinJapanPod/status/1819569233124376815 Close your eyes and use the force! But I’d like to see it!
  21. Access Monitoring Approaches of Linux Kernel • Use non-ideal but

    practical mechanisms of two categories • Developed/optimized for individual management mechanism – E.g., Pseudo-LRU and artificial page faults for reclamation and NUMA balancing – Optimized and time-tested, but obscure, heuristic-based, difficult to extend/generalize • Developed for observable and general memory managements: DAMON Images retrieved from https://visla.kr/article/etc/119021/ and https://x.com/DeepinJapanPod/status/1819569233124376815 The topic of this talk Close your eyes and use the force! But I’d like to see it!
  22. DAMON Goal: Access Observability for Holistic Memory Management • Space-time

    access events map or practically same information Time Address
  23. DAMON Challenges: Overhead • Time Overhead – For generating each

    snapshot of the map – O(memory size) • Space Overhead – For saving the entire access events map – O(memory size * total monitoring time) • Memory size and monitoring time: arbitrarily huge (unscalable)
  24. Region: Access Monitoring Unit for DAMON • Defined as a

    reasonably-atomic unit of data access – A sub-area of the space-time access events map – A collection of adjacent elements that having similar access pattern • By the definition, access check of one element per region is enough • e.g., “This page is accessed within last 1 second; I saw a cacheline in it is accessed!” $ cat wonder_region_1 We’re all mad [un]accessed here
  25. Fixed Space/Time Granularity, Boolean Access Frequency • Time overhead: “memory

    size / space granularity” • Space overhead: “time overhead * monitoring time / time granularity” • Overhead is reducible and controllable • Still ruled by memory size and monitoring time Time Address Sampling interval Region We’re all mad accessed here We’re all mad unaccessed here
  26. Fixed Space/Time Granularity, <=N Access Frequency • Accumulate (sampled) access

    check results via per-region counter 1 0 0 1 Address Sampling interval Region Aggregate interval Now Time
  27. Fixed Space/Time Granularity, <=N Access Frequency • Accumulate (sampled) access

    check results via per-region counter 1 2 0 1 0 0 1 2 Address Sampling interval Region Aggregate interval Time Now
  28. Fixed Space/Time Granularity, <=N Access Frequency • Accumulate (sampled) access

    check results via per-region counter 1 2 3 0 1 1 0 0 1 1 2 2 Address Sampling interval Region Aggregate interval Time Now
  29. Fixed Space/Time Granularity, <=N Access Frequency • Accumulate (sampled) access

    check results via per-region counter 1 2 3 0 0 1 1 0 0 0 1 0 1 2 2 0 Address Sampling interval Region Aggregate interval Time Now
  30. Fixed Space/Time Granularity, <=N Access Frequency • Accumulate (sampled) access

    check results via per-region counter 1 2 3 0 1 2 3 0 1 1 0 1 1 1 0 0 1 0 0 0 0 1 2 2 0 1 2 3 Address Sampling interval Region Aggregate interval Time Now
  31. Fixed Space/Time Granularity, <=N Access Frequency • Accumulate (sampled) access

    check results via per-region counter 1 2 3 0 1 2 3 0 1 2 2 0 1 1 0 1 1 1 0 1 1 2 0 0 1 0 0 0 0 0 1 1 1 1 2 2 0 1 2 3 0 1 1 2 Address Sampling interval Region Aggregate interval Time Now
  32. Fixed Space/Time Granularity, <=N Access Frequency • Accumulate access checks

    via per-region counter • Reduce space overhead to “1/N” • Still, O(memory size * total monitoring time) Time Address Region Aggregate interval 3 3 2 1 1 2 1 0 1 2 3 2
  33. Problems of Fixed Space Granularity • Wasteful adjacent regions of

    similar hotness • Restrict fine-grained space monitoring Time Address Region Aggregate interval 3 3 2 1 1 2 1 0 1 2 3 2
  34. Auto-tuned Dynamic Space Granularity: Mechanisms (1/2) • Repeat merging the

    wasteful regions and randomly splitting regions – The number of region == number of different access patterns • Let user set min/max number of total regions (10 and 1000 are defaults and recommended) Time Address Region Aggregate interval 3 3 2 1 1 0 1 2 3 2
  35. Auto-tuned Dynamic Space Granularity: Mechanisms (2/2) • Repeat merging the

    wasteful regions and randomly splitting regions – The number of region == number of different access patterns • Let user set min/max number of total regions (10 and 1000 are defaults and recommended) Time Address Region Aggregate interval 3 3 2 1 1 0 1 2 3 2
  36. Auto-tuned Dynamic Space Granularity: Overhead/Accuracy • Time overhead: min(different access

    patterns, max number of regions) – No more ruled by memory size, fully controlled and auto-tuned • Accuracy: best-effort high – Auto-tuned dynamic granularity can find accesses to small memory area Time Address Region Aggregate interval 3 3 2 1 1 0 1 2 3 2
  37. Problems of Fixed Time Granularity Regions (1/2) • The definition

    of regions: about not only space, but also time Time Address Region Aggregate interval
  38. Inefficiency of Fixed Time Granularity Regions (2/2) • The definition

    of regions: about not only space, but also time • Multiple time-adjacent regions of similar hotness: only waste Time Address Region Aggregate interval
  39. Dynamic Time Granularity (1/3) • Count how long the hotness

    has kept • Snapshot contains history of useful length Time Address Region Aggregate interval 1 1 1 1 Now
  40. Dynamic Time Granularity (2/3) • Count how long the hotness

    has kept • Snapshot contains history of useful length Time Address Region Aggregate interval 1 2 1 2 1 1 1 1 Now This snapshot can be discarded
  41. Dynamic Time Granularity (3/3) • Count how long the hotness

    has kept • Snapshot contains history of useful length Time Address Region Aggregate interval 1 2 1 1 2 3 1 1 1 1 1 1 Now This snapshot can be discarded This snapshot can be discarded
  42. Snapshot: The Output of DAMON • O(max_nr_regions) time/space overhead •

    Both time/space overheads are not ruled by memory size/monitoring time
  43. If Intervals Are Appropriate: Meaningful Hot/Cold Regions • Meaningful enough

    to make some memory management decisions 1 2 3 1 2 3 1 2 2 0 1 1 1 1 1 1 1 2 0 0 1 0 0 0 1 1 1 1 2 2 1 2 3 1 1 2 Time Address Aggregation interval Region Sampling interval
  44. If Intervals Are Too Short: Everything Looks Cold 1 1

    1 0 1 1 0 1 1 0 0 0 0 0 0 0 0 0 0 0 0 0 0 0 0 0 0 1 1 1 0 0 0 0 0 0 Time Address Region Aggregation interval Sampling interval
  45. If Intervals Are Too Long: Everything Looks Hot 1 2

    3 1 2 3 1 2 3 1 2 3 1 2 3 1 2 3 1 2 3 1 1 2 1 2 3 1 2 3 1 2 3 1 2 3 Address Region Aggregation interval Sampling interval
  46. If Sampling:Aggregation Interval ratio is Too Low: Meaningless Samples •

    Most sampling returns “negative”: unnecessary CPU cycle waste Address Region Aggregation interval Sampling interval
  47. Aimed Monitoring Output-oriented Intervals Auto-tuning • Change Question: How to

    do? (mechanism) → What to achieve? (final goal, policy) • Let users specify – Desired amount of access events to capture in each snapshot – Minimum and maximum sampling intervals • Find sampling/aggregation intervals for the desire using a feedback loop – Increase intervals if less than desired events are captured in current snapshot – Decrease intervals if more than desired events are captured in current snapshot
  48. Monitoring Intervals Auto-tuning Parameters • Parameters for parameters auto-tuning, but

    easy to set • Suggestion – Desired access events per snapshot: 4% of per-snapshot maximum capturable events – Min/max sampling intervals: 5ms and 10s – Sampling:aggregation intervals ratio: 1:20 – Proven to be useful on multiple real-world production workloads – Isn’t this another heuristic? Yes, but the maintainer will be there to support this
  49. Intervals Auto-tuning on a Real-world Server Workload • Sampling interval

    and tuning score continuously change, and converge for given situation – Sampling interval converges to 370ms under usual load, ~4-5 seconds under light load – Tuning score converges to the goal (10,000 bp)
  50. Intervals Auto-Tuning on Real World Server Workloads • Meaningful access

    patterns found on three different workloads including 1 TiB memory size workload • 0.0% CPU time consumed for the monitoring
  51. Utilizing DAMON for Access-aware Memory Management • Profiling (e.g., GIF

    demo link) – For finding rooms to improve, e.g., capacity planning • Profiling-guided Optimizations – Could be done on both offline and online • Why not let kernel just (transparently) works?
  52. Utilizing DAMON for Access-aware Memory Management • Profiling (e.g., GIF

    demo link) – For finding rooms to improve, e.g., capacity planning • Profiling-guided Optimizations – Could be done on both offline and online • Why not let kernel just (transparently) works?
  53. Utilizing DAMON for Access-aware Memory Management • Profiling (e.g., GIF

    demo link) – For finding rooms to improve, e.g., capacity planning • Profiling-guided Optimizations – Could be done on both offline and online • Why not let kernel just (transparently) works?
  54. DAMOS: Data Access Monitoring-based Operation Schemes • The other face

    of DAMON • Let users define schemes – Interested access patterns and memory operation actions to apply to the regions of interests • DAMOS: execution engine of such schemes • For more interesting details about DAMOS, refer to other resources or future DAMOS talks # # pageout memory regions that not accessed for >=5 seconds # damo start --damos_action pageout --damos_access_rate 0% 0% --damos_age 5s max
  55. Proactive Cold Memory Reclamation • Proactively find and reclaim cold

    pages • Reduce memory footprint without performance degradation • Reduce memory pressure occurrences and help (automated) capacity planning • AWS Aurora Serverless v2 uses this for memory auto-scaling
  56. Memory Tiering • Migrate hot data in slower NUMA nodes

    to faster nodes, cold data in opposite direction – e.g., CXL and DRAM nodes • SK Hynix developed and utilizing this for their Heterogeneous Memory SDK • Meta’s self-tuned version shows ~7.34% performance improvement on a test workload (Taobench) • Cgroup fairness-aware extension is also available in RFC • Supporting {C,G,X}PU-attached NUMA nodes: WIP
  57. Access-aware Dynamic Memory Interleaving • Memory interleaving: interleave placement on

    allocation time for bandwidth control • Runtime-interleave (migrate) data for dynamic access pattern in access-aware order • Micron developed for their internal project; shows 25% performance improvement
  58. Page Level Data Access Monitoring • Different types of pages

    have different management mechanisms • Breakdown data access pattern for specific types of pages • Developed by Meta for hugepage and LRU-active pages access pattern profiling Per-page type access pattern of a production workload
  59. Fleet-wide Data Access Monitoring • Transform DAMON snapshot into hotness

    distribution • Easy to aggregate and intuitively understand (idle time percentiles or cold memory tails) • Developed by Meta for fleet-wide real workloads access pattern profiling Cold memory tails (left) and idle memory time percentiles (right) of real workloads
  60. And Any Future Opportunities Are Open • DAMON of Today

    != DAMON of Tomorrow • Aim to randomly evolve for selfish users • Make your voice
  61. Where to Get Started: https://damonitor.github.io • Project website • Contains

    getting started guides and all resources for users and developers • Should have all you need to get started – If not, report it please
  62. Availability • Merged into the mainline from v5.15 • Recommended

    to use latest kernel; Feel free to ask backporting • Backported and enabled on major Linux distro kernels – Alma, Amazon, Android, Arch, CentOS, Debian, Fedora, OpenSuse, Oracle, … • DAMON user-space tool (damo) is available on major packaging systems – Arch, Debian, Fedora, PyPi, ...
  63. Interfaces • DAMON user-space tool: Recommended for general usages from

    user-space • DAMON modules: Recommended for specific usages • DAMON sysfs interface: Recommended for user-space program development • Kernel API: Recommended for kernel programmers
  64. Community: For Questions, Help, Patch Reviews • Public mailing list

    (https://lore.kernel.org/damon) • Bi-weekly virtual meetup – Occasional/regular private meetings on demand • Not used to mail-based development? Try hkml – Developed and maintained for DAMON and Linux kernel developers • The future of DAMON is open and up to you – “Prefer random evolution over intelligent design”
  65. Summary: That’s DAMON of Today • DAMON: a Linux kernel

    subsystem – For practical access monitoring based holistic and observable memory managements • Being used in real-world • The future is open and up to the community – Make your selfish voice!
  66. Questions? • You can also ask questions anytime to –

    Maintainer: [email protected] – Public mailing list (https://lore.kernel.org/damon) – Bi-weekly virtual meetup – Occasional/regular private meetings on demand – Project website (https://damonitor.github.io)
  67. DAMON_STAT: Recommended Way For System-wide Access Monitoring • Kernel module

    running DAMON for the entire physical address space • Use intervals auto-tuning with the suggested auto-tune parameters • Extract Idle time percentile – distribution of per-byte memory idle times (time the byte was not accessed) – P75 idle time 2minutes: 75 percent of the memory was accessed at least once in last 2 minutes; rest 25 percent of memory was not accessed at all for last 2 minutes • Extract estimated memory bandwidth – Memory bandwidth estimated based on access events that captured in the last snapshot • Recommended way for system-wide access monitoring – Easy to enable (CONFIG_DAMON_STAT_DEFAULT_ENABLED=y), aggregate, compare – Can be enabled/disabled at build, boot time and runtime
  68. Idle Time Percentiles • Idle time: How long the region

    kept being not accessed (access frequency 0) • Idle time percentiles: Percentiles of sorted per-byte idle times Unsorted snapshot
  69. Idle Time Percentiles • Idle time: How long the region

    kept being not accessed (access frequency 0) • Idle time percentiles: Percentiles of sorted per-byte idle times Unsorted snapshot Sorted by access frequency
  70. Idle Time Percentiles • Idle time: How long the region

    kept being not accessed (access frequency 0) • Idle time percentiles: Percentiles of sorted per-byte idle times Unsorted snapshot Sorted by access frequency P50 idle time
  71. Idle Time Percentiles • Idle time: How long the region

    kept being not accessed (access frequency 0) • Idle time percentiles: Percentiles of sorted per-byte idle times Unsorted snapshot Sorted by access frequency P50 idle time P75 idle time
  72. Idle Time Percentiles • Idle time: How long the region

    kept being not accessed (access frequency 0) • Idle time percentiles: Percentiles of sorted per-byte idle times Unsorted snapshot Sorted by access frequency P50 idle time P75 idle time P99 idle time
  73. DAMON_STAT: Recommended Way For System-wide Access Monitoring • Kernel module

    running DAMON for the entire physical address space • Use intervals auto-tuning with the suggested auto-tune parameters • Extract Idle time percentile – distribution of per-byte memory idle times (time the byte was not accessed) – P75 idle time 2minutes: 75 percent of the memory was accessed at least once in last 2 minutes; rest 25 percent of memory was not accessed at all for last 2 minutes • Extract estimated memory bandwidth – Memory bandwidth estimated based on access events that captured in the last snapshot • Recommended way for system-wide access monitoring – Easy to enable (CONFIG_DAMON_STAT_DEFAULT_ENABLED=y), aggregate, compare – Can be enabled/disabled at build, boot time and runtime
  74. Results on a Real Workload: Auto-tuned Total Memory Idle Time

    Percentiles • Small hot memory, exponentially increasing idle time (long tail of cold pages)
  75. Results on a Real Workload: Active vs Inactive Pages Idle

    Time Breakdown • Active pages have rooms to be more hot than inactive (ideally, p100 of active should < p0 of inactive)
  76. Results on a Real Workload: Per Page Type Idle Time

    Breakdown • You can check if your workload has expected access pattern
  77. DAMOS Filter: Fine-Control Access-aware System Operation Targets • Define target

    memory with non-access-pattern information – Page level filters: anon, owned cgroup, hugepage, LRU-activeness – Non-page level filters: address – “pageout cold pages of NUMA node 1 that associated with cgroup A and file-backed” – Can be useful for fine-grained monitoring, too • (“stat”, instead of “pageout”)
  78. DAMOS Quota: Control Access-aware System Operation Aggressiveness • Six fixed

    thresholds (min/max size, access frequency, age) are unnecessary in many cases • Setting thresholds flexibly and controlling aggressiveness works in many cases – Single control knob • Quota set the aggressiveness limit as amount of memory to apply action per a time interval • Access pattern based prioritization is applied under the quota • “pageout cold pages up to 100 MiB per second using <2% CPU time, coldest ones first”
  79. Quota Auto-tuning: Auto-tuned Access-aware System Operations • Quota tuning is

    manual and repetitive • Change the question for user: How to do (mechanism) → What to achieve (final goal) • Let users specify goal of the quota as a value of a metrics – Metrics: PSI level, NUMA node memory utilization, workload’s latency, bandwidth, TPS, … – e.g., “reclaim cold pages aiming 0.5% memory PSI” • DAMOS adjusts quota using feedback loop, for current value of the metric – e.g., If memory PSI is 0.1% increase quota for reclaiming cold pages (reclaim more warm pages)
  80. Controlled and Auto-tuned Access-aware System Operation Performance • Parsec3/splash2x.fft •

    Page out regions that not accessed for >=5 seconds, up to 1GiB/sec, using up to 100ms/sec, aiming 10ms/sec memory pressure stall Runtime RSS Baseline 50.489s 10.005 GiB +DAMOS-reclaim 120s 4.955 GiB +Quota 51.772s 8.527 GiB +Goal 49.741s 9.721 GiB
  81. Proactive Reclamation • Reactive reclamation: Reclaim cold memory when memory

    pressure happens • Proactively reclamation: Reclaim cold memory before memory pressure • Benefit 1: Reduce memory footprint without performance degradation • Benefit 2: Minimize degradation from direct reclamation • Known usages: Google, Meta, and Amazon – Each company uses its own implementation for its usage • AWS uses DAMOS-based implementation since 2022
  82. CXL Memory Tiering • CXL-tiered memory: Put CXL memory between

    DRAM and NVM – Pros: Higher capacity with lower price (higher efficiency) • Challenge: Dynamic placement of pages (CXL mem is slower than DRAM) • DAMON-based approach: Place hot pages on DRAM node, Place cold pages on CXL node • SK hynix developed their CXL memory SDK (HMSDK) using DAMOS – Reports ~12.9% speed up
  83. Execution Model: Kernel Thread per Requests • “struct damon_ctx”: Data

    structure for DAMON user input/output containing – User requests: target address space, address range, intervals, DAMOS schemes – Operation results: access snapshot, DAMOS stats • “kdamond”: DAMON worker thread – Create one kdamond per “damon_ctx” • In future, could support multiple “damon_ctx” per kdamond • In future, could separate DAMOS to another thread (maybe useful for cgroup charging) – Allows async DAMON execution and multiple kdamonds (CPUs) scaling
  84. Extensible Layers paddr vaddr DAMON DAMOS Adaptive Regions Adjustment Region-based

    Sampling Access Frequency Monitoring Action and Pattern Quotas and Prioritization Watermarks DAMON Application Programming Interface PTE/VMA/rmap, ... General-purpose User ABI Special-purpose Modules DAMON_SYSFS DAMON_DBGFS DAMON_RECLAIM DAMON_LRU_SORT DAMON_WSS Feedback-based auto-tuning AMD IBS LRU State Filters Read/write-only NUMA-cpus-only DAMO DAMON Operations Set Registration Interface datop User-space Tools DAMON API User Kernel Modules Core Logic Operations Set Primitives that DAMON depends on Advanced Regions Adjustment Parameters Auto-tuning
  85. Extensible Layers paddr vaddr DAMON DAMOS Adaptive Regions Adjustment Region-based

    Sampling Access Frequency Monitoring Action and Pattern Quotas and Prioritization Watermarks DAMON Application Programming Interface PTE/VMA/rmap, ... General-purpose User ABI Special-purpose Modules DAMON_SYSFS DAMON_DBGFS DAMON_RECLAIM DAMON_LRU_SORT DAMON_WSS Feedback-based auto-tuning AMD IBS LRU State Filters Read/write-only NUMA-cpus-only DAMO DAMON Operations Set Registration Interface datop User-space Tools DAMON API User Kernel Modules Core Logic Operations Set Primitives that DAMON depends on Advanced Regions Adjustment Parameters Auto-tuning
  86. Extensible Layers paddr vaddr DAMON DAMOS Adaptive Regions Adjustment Region-based

    Sampling Access Frequency Monitoring Action and Pattern Quotas and Prioritization Watermarks DAMON Application Programming Interface PTE/VMA/rmap, ... General-purpose User ABI Special-purpose Modules DAMON_SYSFS DAMON_DBGFS DAMON_RECLAIM DAMON_LRU_SORT DAMON_WSS Feedback-based auto-tuning AMD IBS LRU State Filters Read/write-only NUMA-cpus-only DAMO DAMON Operations Set Registration Interface datop User-space Tools DAMON API User Kernel Modules Core Logic Operations Set Primitives that DAMON depends on Advanced Regions Adjustment Parameters Auto-tuning
  87. DAMOS Quotas: Intuitive Aggressiveness Control • Before applying DAMOS schemes

    – Set temperature-based priority score of each region – Build “priority score”: “total size of regions of the priority” histogram – Find lowest priority threshold for the scheme meeting the quota – Skip applying action to regions having lower-than-threshold priority scores • Single snapshot and histogram iteration: O(<=user-defined-N) • Quota auto-tuning: A simple proportional feedback algorithm – Reward metrics: Arbitrary user-input or self-retrievable metrics like memory PSI
  88. DAMOS Filters: Fine-grained Target Selection • Before applying DAMOS action,

    check the properties of region and skip action if needed • Non-page granular (high level) filters – Filtered out before applying actions – Address ranges (e.g., NUMA nodes or Zone) – DAMON-defined monitoring target (e.g., process) • Page granular (low level) filters – Filtered out in the middle of actions in page level – Anon/File-backed – Belonging memory cgroup – page_idle()
  89. Pseudo-code of DAMON v5.15 While True: for region in regions:

    if region.accessed(): region.nr_accesses += 1 sleep(sampling_interval) if now() % aggregation_interval: merge(regions) user_callback(regions) for region in regions: region.nr_accesses = 0 split(regions)
  90. DAMON accuracy on Low-locality Space/Workloads • It is proven to

    work on real world products for years • Pareto principle and unconcious bias will make the pattern – Entropy-full situation is when the data center is doom-ed • “age” avoid immature decision • More works for accuracy improvement will be continued • DAMON could be decoupled with the region-based mechanisms in future • Let’s collect data and continue discussions together
  91. Can DAMON Extended for Non-snapshot Access Patterns? • TL; DR:

    Yes, why not? • DAMON is for any access information; Snapshot is one of the representations • If the information/representation is useful for users, DAMON can add support • We started discussion for Memory bandwidth visibility
  92. Can DAMON Use features Other than PTE Accessed bits? •

    The extensible layer allows it • AMD IBS and page fault-based appaoraches (e.g., PTE_NONE) are on the table • In future, if GPU provides access check feature, we can extend to use it • Such extension would allow – More lightweight and precise monitoring – Access source, read/write-aware monitroing – Kernel memory access monitoring
  93. DAMOS for Efficient and Fine-grained Data Access Monitoring • DAMOS_STAT

    – Special action making no system change but expose the scheme-internal information – Let user knows which of the memory are eligible for the scheme • With DAMOS filters, can do page level properties-based monitoring – “How much of >2 minutes unaccessed memory are in hugepages and belong to cgroup A?” • With DAMOS quotas, can do overhead-controlled monitoring