Upgrade to Pro — share decks privately, control downloads, hide ads and more …

FISH 6002: Week 11 - Maps

FISH 6002: Week 11 - Maps

Updated Nov 16

Avatar for MI Fisheries Science

MI Fisheries Science

November 14, 2017
Tweet

More Decks by MI Fisheries Science

Other Decks in Science

Transcript

  1. Week 11: Maps FISH 6000: Science Communication for Fisheries Brett

    Favaro 2017 This work is licensed under a Creative Commons Attribution 4.0 International License
  2. You always need a map • Plot your study sites

    • Orient people as to the location of your work • Demonstrate spatial scale of research
  3. Why not just use google maps? • Rules for data

    visualizations involving maps have the same basic rules as other plots: Minimize chartjunk, eliminate irrelevant content • Need to add a scale bar and graphics demonstrating location relative to rest of world • Google Maps has built-in topography, but not bathymetry
  4. • If you work near the poles, Google maps start

    to badly distort geography (more on that soon)
  5. Lat/long units are expressed as: Degree, Minute, Second 1 degree

    = 60 minutes 1 minute = 60 seconds Therefore 1 degree = 3600 seconds This is a base-sixty, or sexagesimal notation Latitude: 1 degree = 111 km (110.5 km at equator, 111.7 at poles) 1 minute ~ 1 nautical mile Longitude: Not fixed. 1 degree is narrow at the poles, wide at equator 1 degree long = cosine (latitude in radians) * 69.172 length of degree in miles at equator
  6. Longitude extends from zero (prime meridian) to 180° E and

    180° W Also expressed as: +180° to -180° Latitude goes from zero (equator) to 90° N and 90° S. Also expressed as: +90° to -90°
  7. Different ways to express lat/long: N, S, E, W Positive,

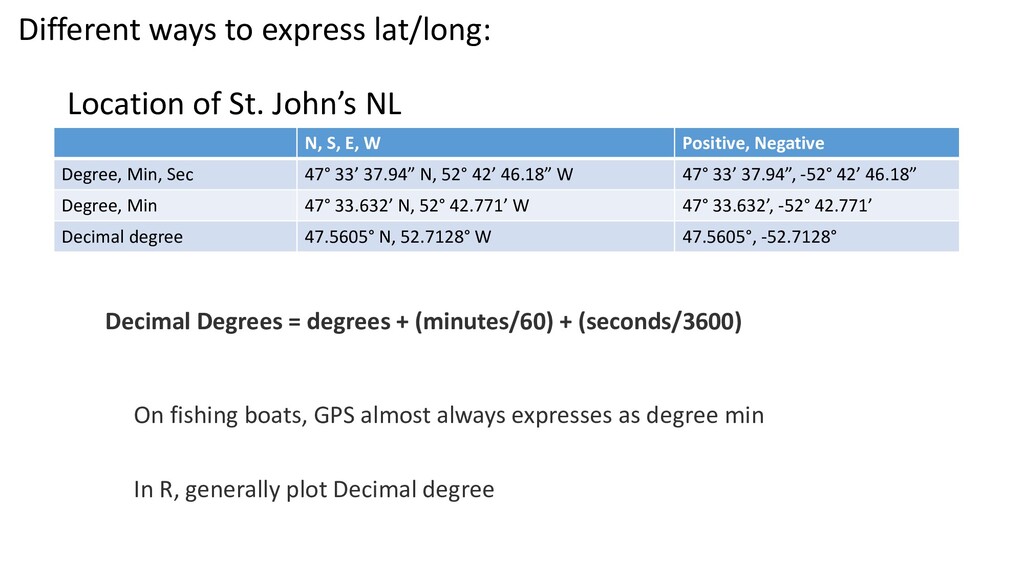
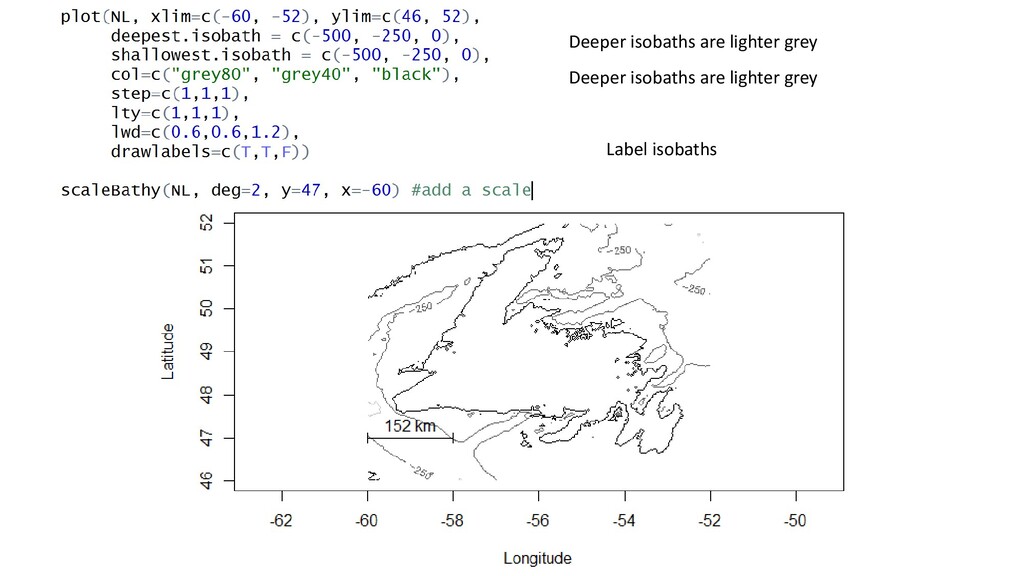
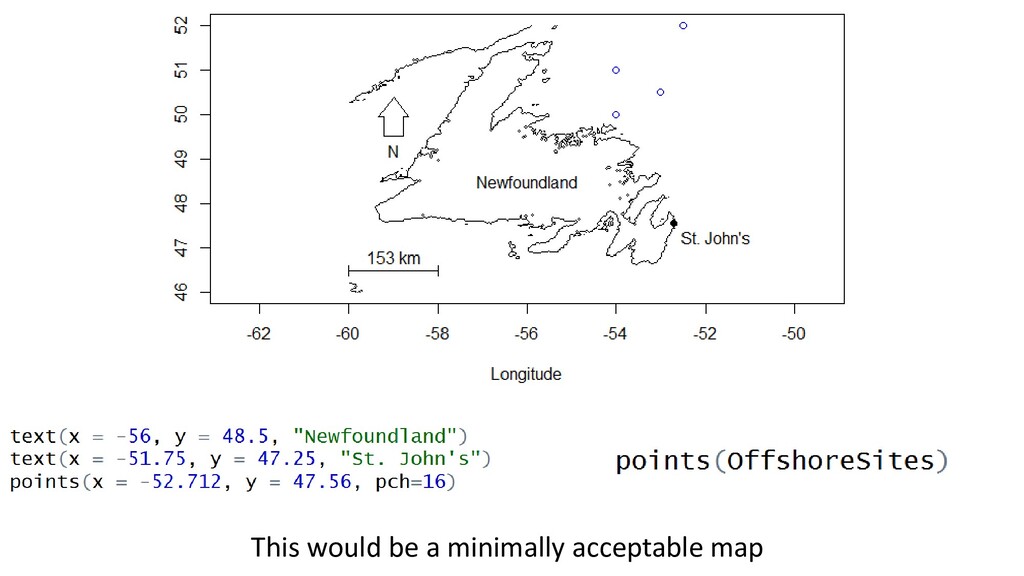
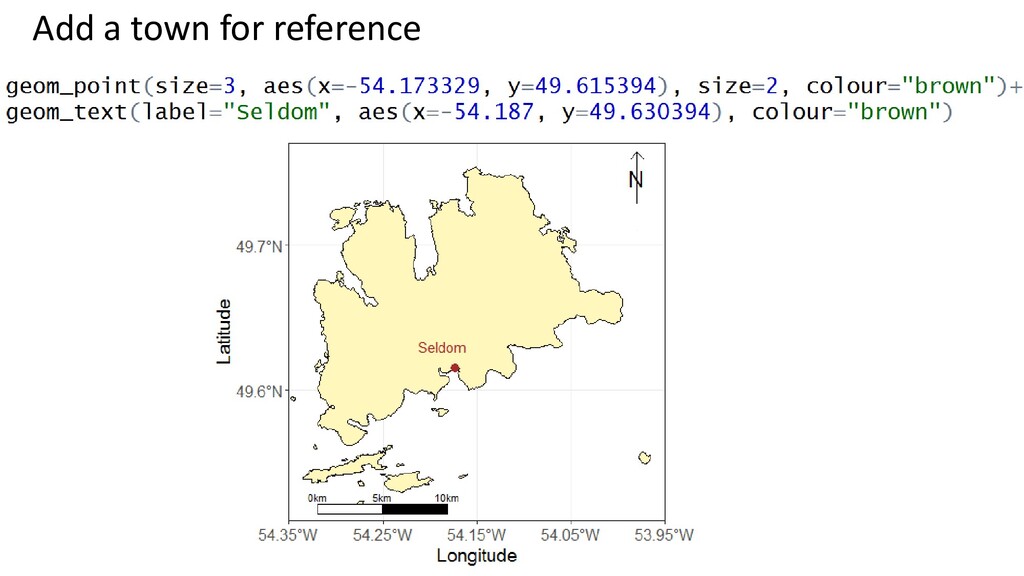
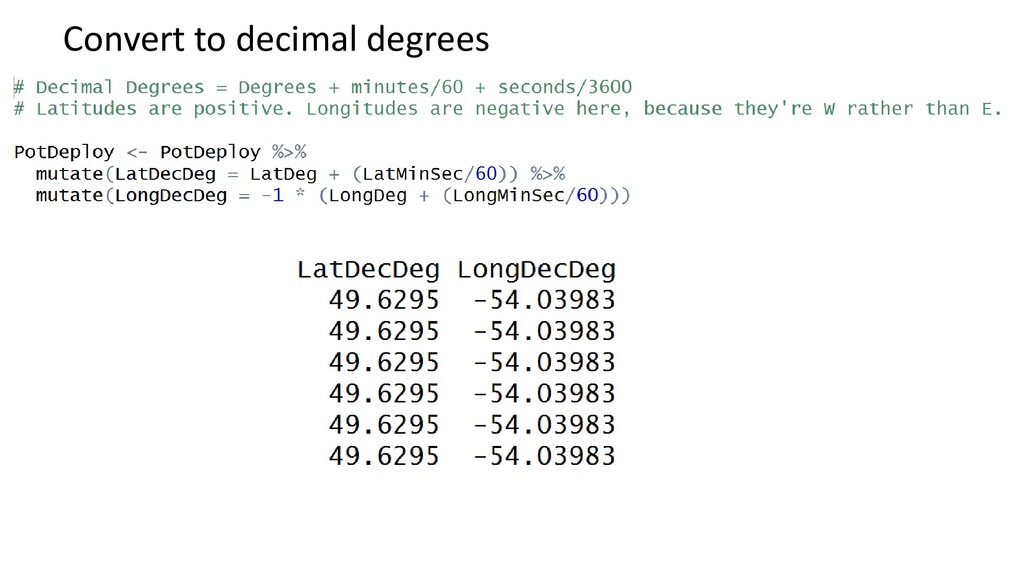
    Negative Degree, Min, Sec 47° 33’ 37.94” N, 52° 42’ 46.18” W 47° 33’ 37.94”, -52° 42’ 46.18” Degree, Min 47° 33.632’ N, 52° 42.771’ W 47° 33.632’, -52° 42.771’ Decimal degree 47.5605° N, 52.7128° W 47.5605°, -52.7128° Decimal Degrees = degrees + (minutes/60) + (seconds/3600) Location of St. John’s NL On fishing boats, GPS almost always expresses as degree min In R, generally plot Decimal degree
  8. http://blog.revolutionanalytics.com/2017/08/maps-in-r.html There are a huge variety of mapping packages in

    R https://www.computerworld.com/article/2921176/business-intelligence/great-r-packages-for-data-import-wrangling-visualization.html Let’s start with a basic problem: Plot a few dots representing field sites onto a basic map You can do advanced GIS work in R (beyond the scope of this course)
  9. Note: The R studio preview is always distorted in this

    package Here is the actual image that would be produced
  10. Now (IF WE HAVE TIME): http://journals.plos.org/plosone/article?id=10.1371/journal.pone.0073051 • Make a map

    of the region in which you will conduct the bulk of your fieldwork • Make two plots: one minimalist, one with bathymetry • Experiment with the fancier features. Try plotting a course between two points • Notice the sample code at the end of the paper
  11. Level 2 = “Second level subdivisions” Some places have level

    3 and 4 subdivisions Level 2 contains all info from level 1 Level 1 contains all info from level 0
  12. http://www.flr.gov.nl.ca/lands/maps/standards.html Many places have official projection standards Projection information: https://proj4.org/operations/projections/etmerc.html

    This projection is not built-in to ggplot2 at this time See: https://www.r-bloggers.com/a-path-towards-easier- map-projection-machinations-with-ggplot2/
  13. Let’s make a map for real Imagine a study based

    on Fogo Island We want to plot our study sites Bathymetry not important https://peerj.com/articles/2953/
  14. Let’s zoom in These will be our X and Y

    ranges Good to write out in this way, as it makes code more readable and easier to tweak
  15. Set breaks in a sequence from the minimum latitude (latmin)

    to the maximum latitude (latmax) in increments of 0.1 (i.e. 49.5, 49.6, 49.7…)
  16. Paste together a sequence of labels made up of three

    parts: 1. The numerical value ranging from latmin to latmax, incrementing by 0.1 (i.e. 49.5, 49.6, 49.7…) 2. A string of characters consisting of the degree sign and N 3. Insert no value between these two strings
  17. Make the axis label use the ABSOLUTE VALUE Getting better…

    need a scale bar and north arrow See: http://editerna.free.fr/wp/?p=76
  18. Show where the study site is located with an inset

    First, create a map that will serve as the inset map Strip away unnecessary elements
  19. The annotation is text (see: http://ggplot2.tidyverse.org/reference/an notate.html) coordinates() returns the

    centre point of a polygon Return all the X values (column 1) of centre points of polygons Return all the Y values (column 2) of centre points of polygons The label is the “ZONE” attribute within NAFO
  20. When plotting two shapefiles at the same time, make sure

    they use equivalent coordinate systems: Zoomed out, this won’t have a huge effect Zoomed in, and it could be an issue
  21. PBSmapping https://github.com/pbs-software/pbs-mapping • PBSmapping was developed by scientists at the

    Pacific Biological Station • I didn’t have time to prepare a full tutorial on this, but see link above for documentation
  22. 900 910 920 930 940 5380 5390 5400 5410 5420

    5430 5440 U TM East in g (km) UTM Northing (km) Saltspring 193 San Juan 149 Galiano 63 N Pender 30 Mayne 26 Saturna 35 V ancouver I sland Strait of Georgia