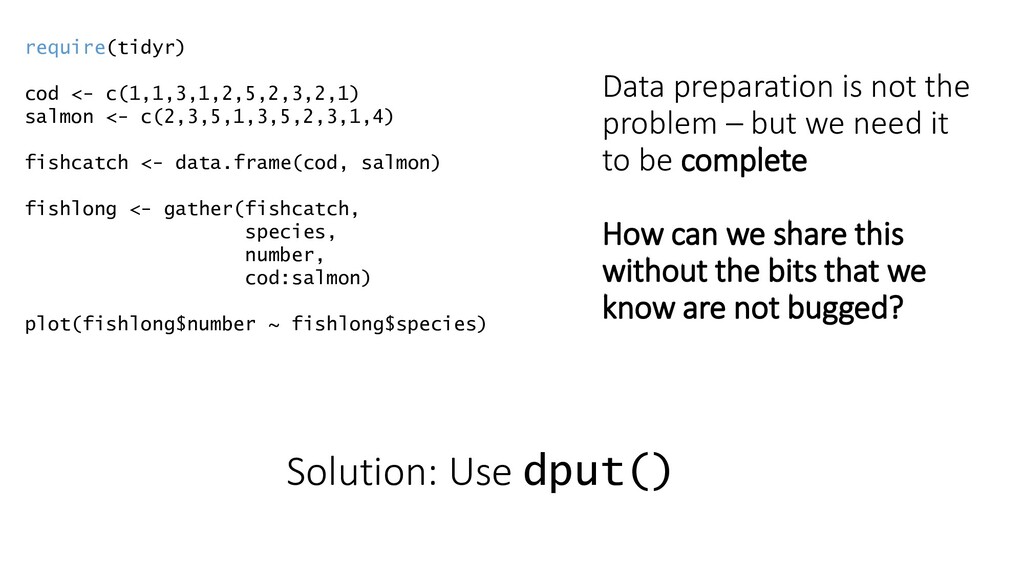
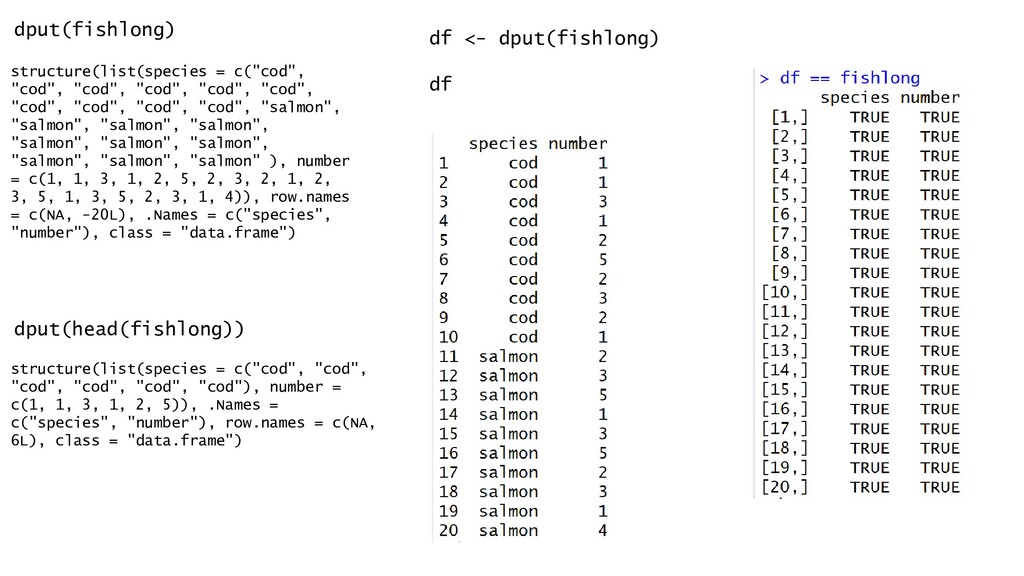
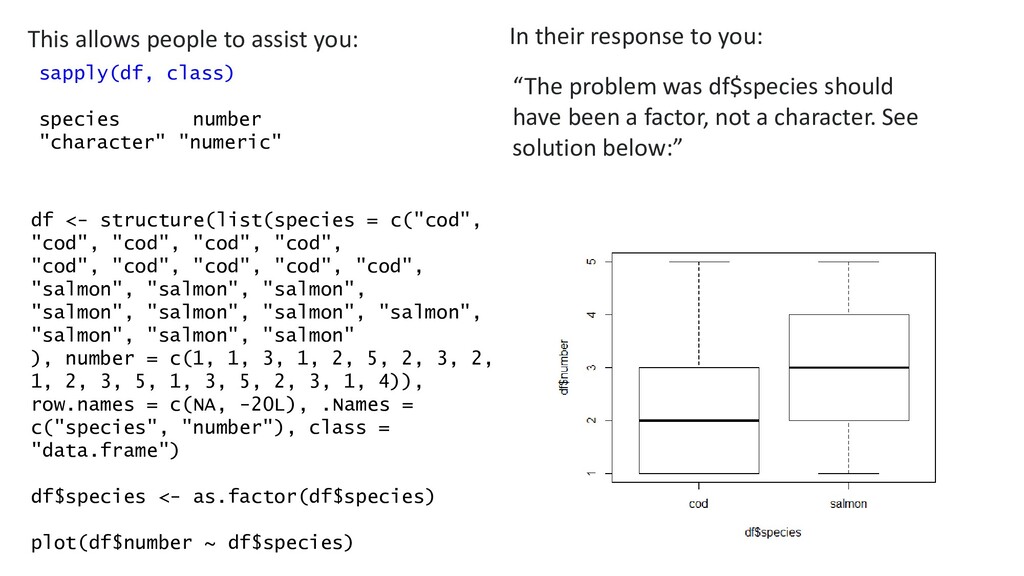
"cod", "cod", "cod", "cod", "cod", "cod", "cod", "cod", "salmon", "salmon", "salmon", "salmon", "salmon", "salmon", "salmon", "salmon", "salmon", "salmon" ), number = c(1, 1, 3, 1, 2, 5, 2, 3, 2, 1, 2, 3, 5, 1, 3, 5, 2, 3, 1, 4)), row.names = c(NA, -20L), .Names = c("species", "number"), class = "data.frame") structure(list(species = c("cod", "cod", "cod", "cod", "cod", "cod"), number = c(1, 1, 3, 1, 2, 5)), .Names = c("species", "number"), row.names = c(NA, 6L), class = "data.frame")