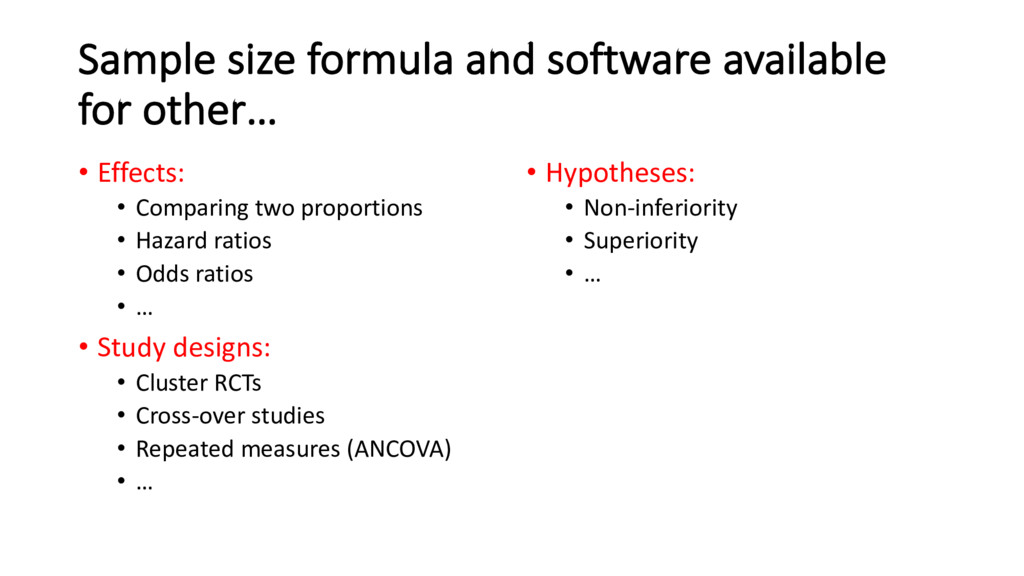
too few), or find a clinically irrelevant effect size (testing too many) Ethical: might sacrifice subjects (testing too many) or unnecessarily expose too few when study success chance low (testing too few) Economical: might waste money and time (testing too many) or have to repeat the experiment again (testing too few) Also, generally required for study grant proposals
(possibly similar) study Might have just gotten lucky Base sample size on what is available Extend study period, seek more money, pool study Use a nice whole number and hope no one notices Unless you want your paper rejected Avoid calculating a sample size because you couldn’t estimate the parameters needed Do a pilot study or use approximate formulae, e.g. SD ≈ (max – min) / 4 Avoid calculating a sample size because you couldn’t work one out Speak to a statistician
compare a new antihypertensive drug relative to a placebo • Participants are randomized into two treatment groups: • Group N: new drug • Group P: placebo • The primary endpoint is taken as the mean reduction in systolic blood pressure (BPsys ) after four weeks
No difference True Negative False positive Type I error () Difference False negative Type II error (β) True Positive Truth Hypothesis test We will use the conventional values of ⍺=0.05 and β=0.20
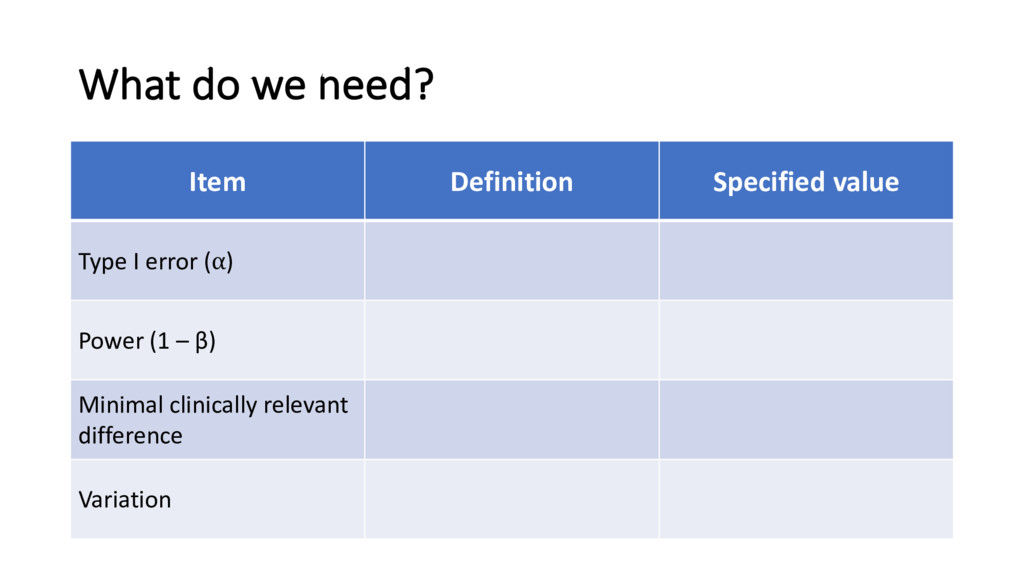
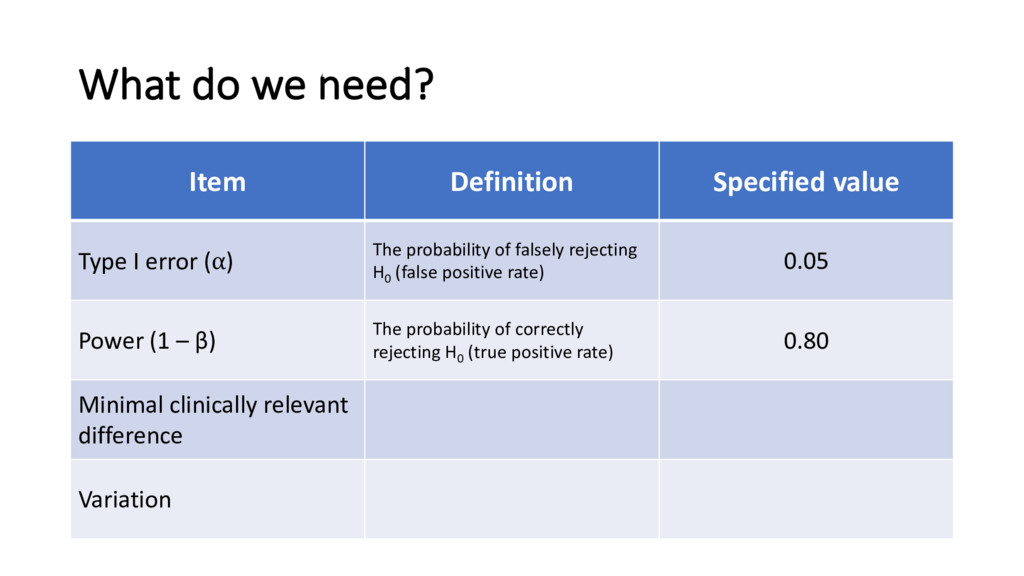
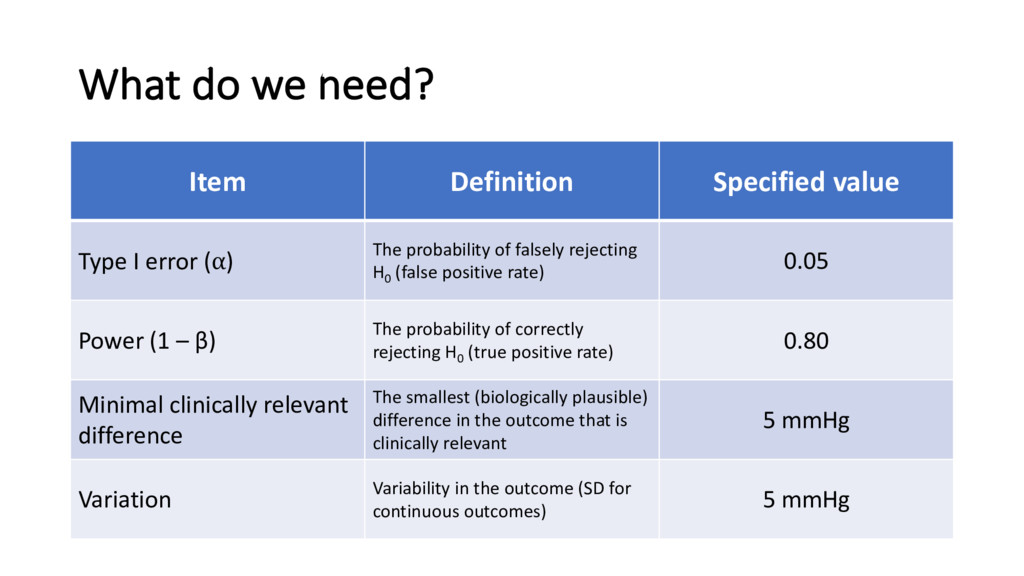
error (⍺) The probability of falsely rejecting H0 (false positive rate) 0.05 Power (1 – β) The probability of correctly rejecting H0 (true positive rate) 0.80 Minimal clinically relevant difference Variation
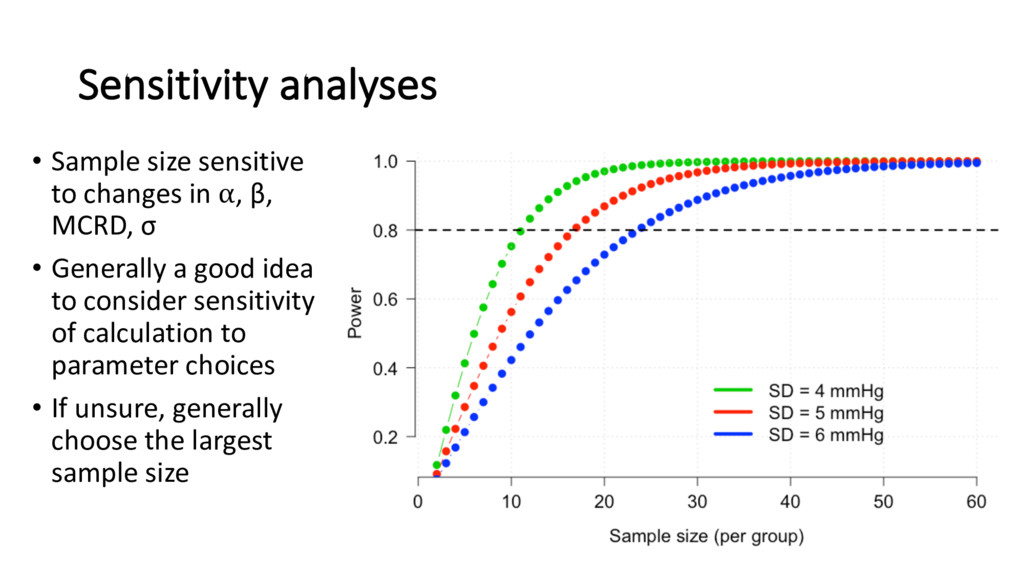
groups that the investigator wishes to detect • Referred to as minimal clinically relevant difference (MCRD) – different from statistical significance • MCRD should be biologically plausible • Sample size ∝ MCRD-2 • E.g. if n=100 required to detect MCRD = 1, then n=400 required to detect MCRD = 0.5 • Note: some software / formula define the ‘effect size’ as the standardized effect size = MCRD / σ
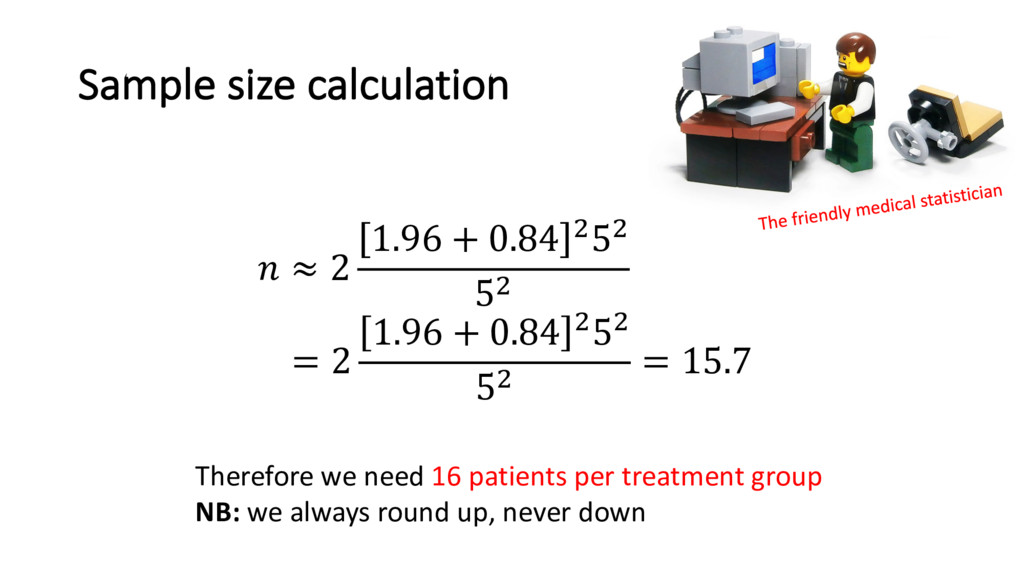
hypertensive patients is 145 mmHg (SD = 5 mmHg) • Histograms also suggest that the distribution of BP is normally distributed in the population • An expert says the new drug would need to lower BPsys by 5 mmHg for it to be clinically significant, otherwise the side effects outweigh the benefit • He assumes the standard deviation of BPsys will be the same in the treatment group
error (⍺) The probability of falsely rejecting H0 (false positive rate) 0.05 Power (1 – β) The probability of correctly rejecting H0 (true positive rate) 0.80 Minimal clinically relevant difference The smallest (biologically plausible) difference in the outcome that is clinically relevant 5 mmHg Variation Variability in the outcome (SD for continuous outcomes) 5 mmHg
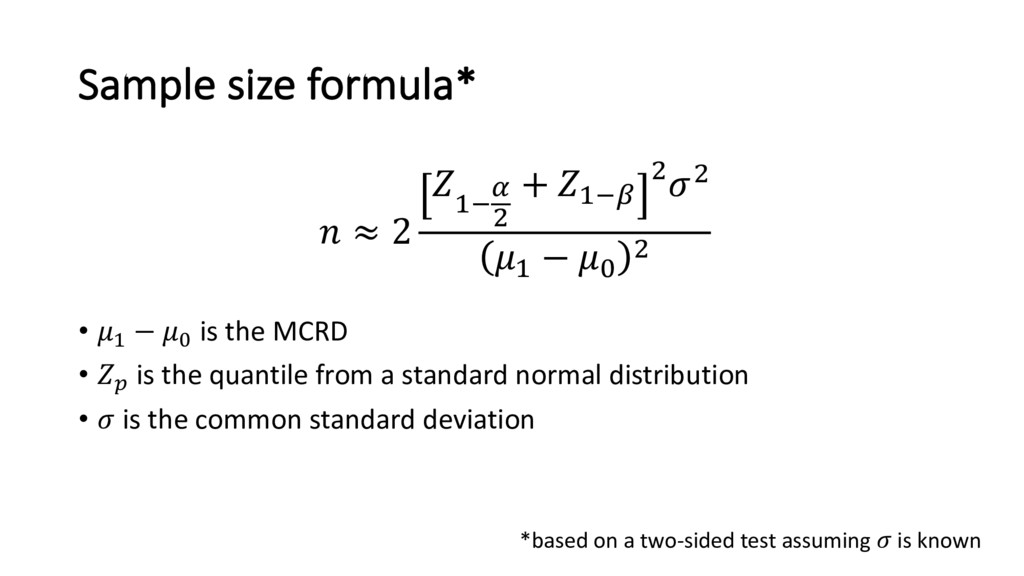
• ' is the quantile from a standard normal distribution • is the common standard deviation ≈ 2 #, - . + #,0 .. # − % . *based on a two-sided test assuming is known
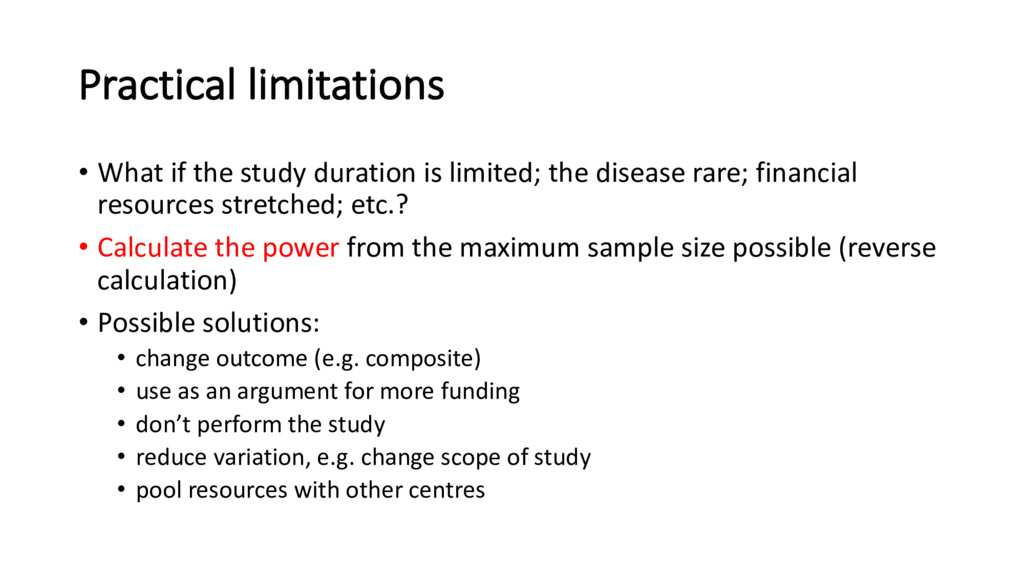
the disease rare; financial resources stretched; etc.? • Calculate the power from the maximum sample size possible (reverse calculation) • Possible solutions: • change outcome (e.g. composite) • use as an argument for more funding • don’t perform the study • reduce variation, e.g. change scope of study • pool resources with other centres
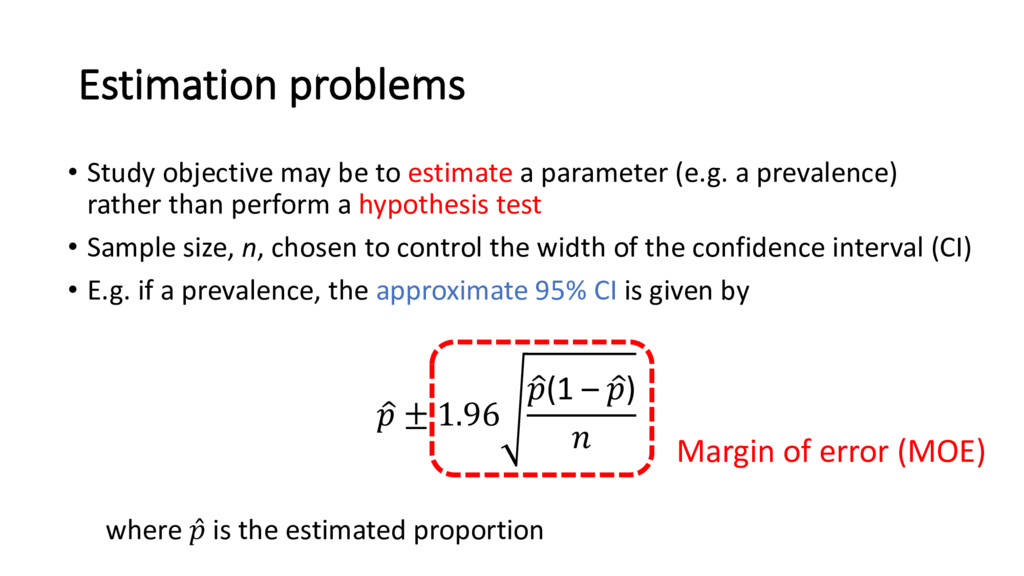
parameter (e.g. a prevalence) rather than perform a hypothesis test • Sample size, n, chosen to control the width of the confidence interval (CI) • E.g. if a prevalence, the approximate 95% CI is given by < ± 1.96 <(1 – <) Margin of error (MOE) where ̂ is the estimated proportion
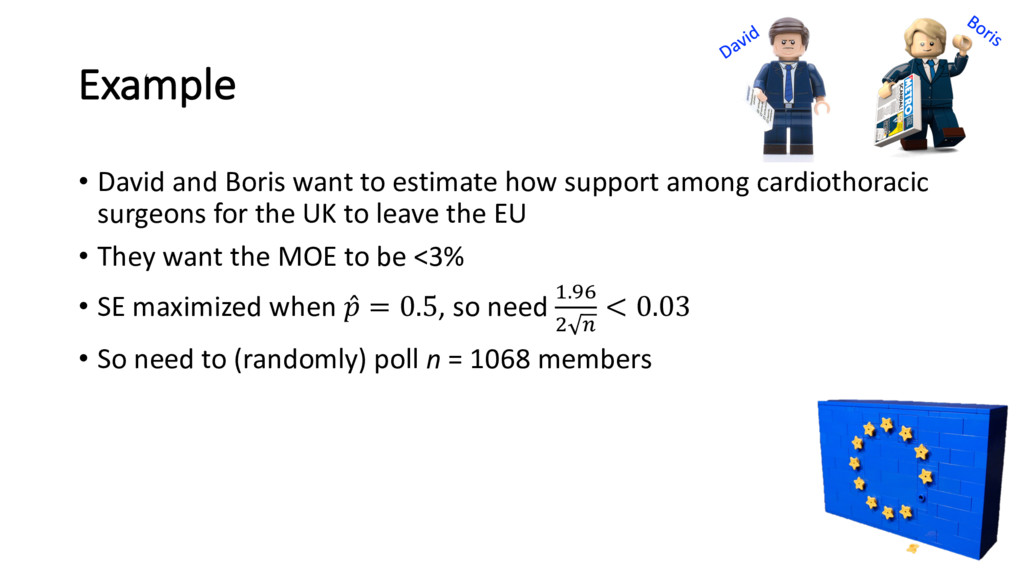
among cardiothoracic surgeons for the UK to leave the EU • They want the MOE to be <3% • SE maximized when ̂ = 0.5, so need #.@A . B < 0.03 • So need to (randomly) poll n = 1068 members
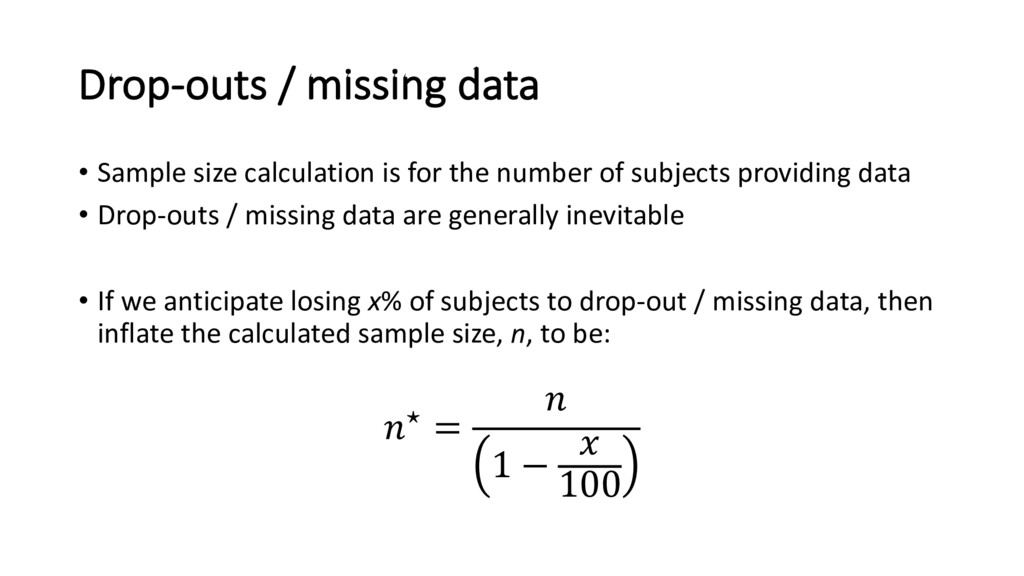
the number of subjects providing data • Drop-outs / missing data are generally inevitable • If we anticipate losing x% of subjects to drop-out / missing data, then inflate the calculated sample size, n, to be: ⋆ = 1 − 100
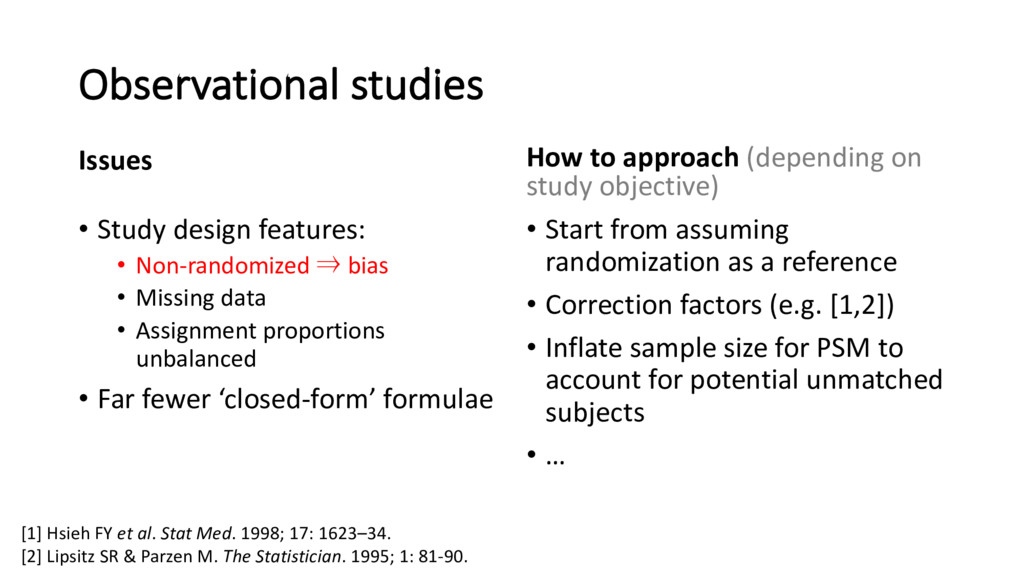
bias • Missing data • Assignment proportions unbalanced • Far fewer ‘closed-form’ formulae How to approach (depending on study objective) • Start from assuming randomization as a reference • Correction factors (e.g. [1,2]) • Inflate sample size for PSM to account for potential unmatched subjects • … [1] Hsieh FY et al. Stat Med. 1998; 17: 1623–34. [2] Lipsitz SR & Parzen M. The Statistician. 1995; 1: 81-90.
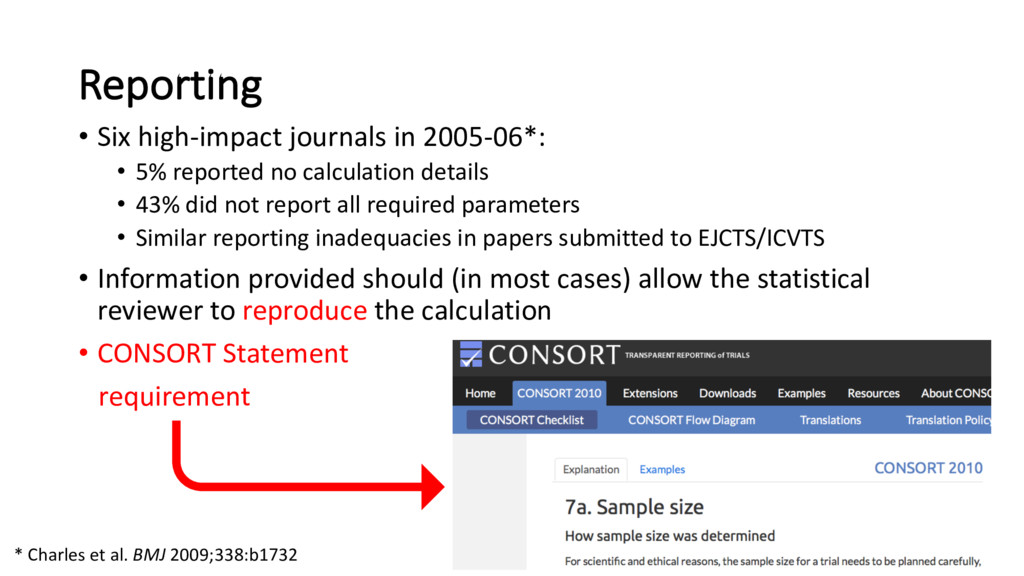
no calculation details • 43% did not report all required parameters • Similar reporting inadequacies in papers submitted to EJCTS/ICVTS • Information provided should (in most cases) allow the statistical reviewer to reproduce the calculation • CONSORT Statement requirement * Charles et al. BMJ 2009;338:b1732
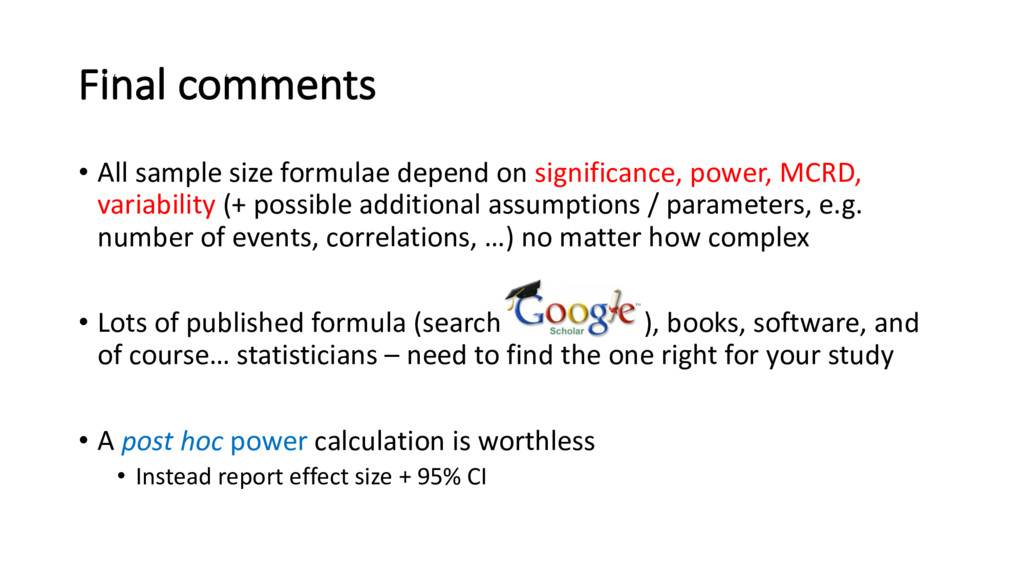
power, MCRD, variability (+ possible additional assumptions / parameters, e.g. number of events, correlations, …) no matter how complex • Lots of published formula (search Google Sc )), books, software, and of course… statisticians – need to find the one right for your study • A post hoc power calculation is worthless • Instead report effect size + 95% CI