Upgrade to Pro — share decks privately, control downloads, hide ads and more …

Multifamily Real Estate Development: From Land ...

Multifamily Real Estate Development: From Land Acquisition to Institutional-Grade Asset | GrayRock Capital

How is value created in multifamily real estate development, and what separates a promising development opportunity from an institutional-quality investment?

In this research presentation, GrayRock Capital Group explores the complete lifecycle of multifamily residential development, from land acquisition and municipal approvals to construction financing, capital structuring, risk management, and asset stabilization.

The presentation examines key investment fundamentals, including development feasibility, net operating income (NOI), capitalization rates, debt and equity structures, valuation sensitivity, and strategies for managing development risk.

Designed for real estate investors, developers, family offices, lenders, and strategic joint venture partners seeking a deeper understanding of how capital, execution, and disciplined underwriting influence long-term asset value.

Presented by Paul Gill, Founder of GrayRock Capital Group, an Ontario-based real estate development and capital investment firm.

GrayRock Capital | Development Intelligence Series — Volume 01

Website: https://grayrockcapital.ca

For educational and informational purposes only. Not an investment offering or financial advice.

Avatar for GrayRock Equity Partners

GrayRock Equity Partners

October 17, 2026

Other Decks in Business

Transcript

  1. R E A L E S TAT E D E

    V E L O P M E N T I N T E L L I G E N C E From Land Acquisition to Institutional-Grade Asset How Value Is Created in Multifamily Development G R AY R O C K C A P I TA L G R O U P • O C TO B E R 2 0 2 6 • RESEARCH SERIES 01 Educational publication | Canada G R AY R O C K C A P I TA L / R E S E A R C H B R I E F I N G 0 1 01
  2. G R AY R O C K C A P

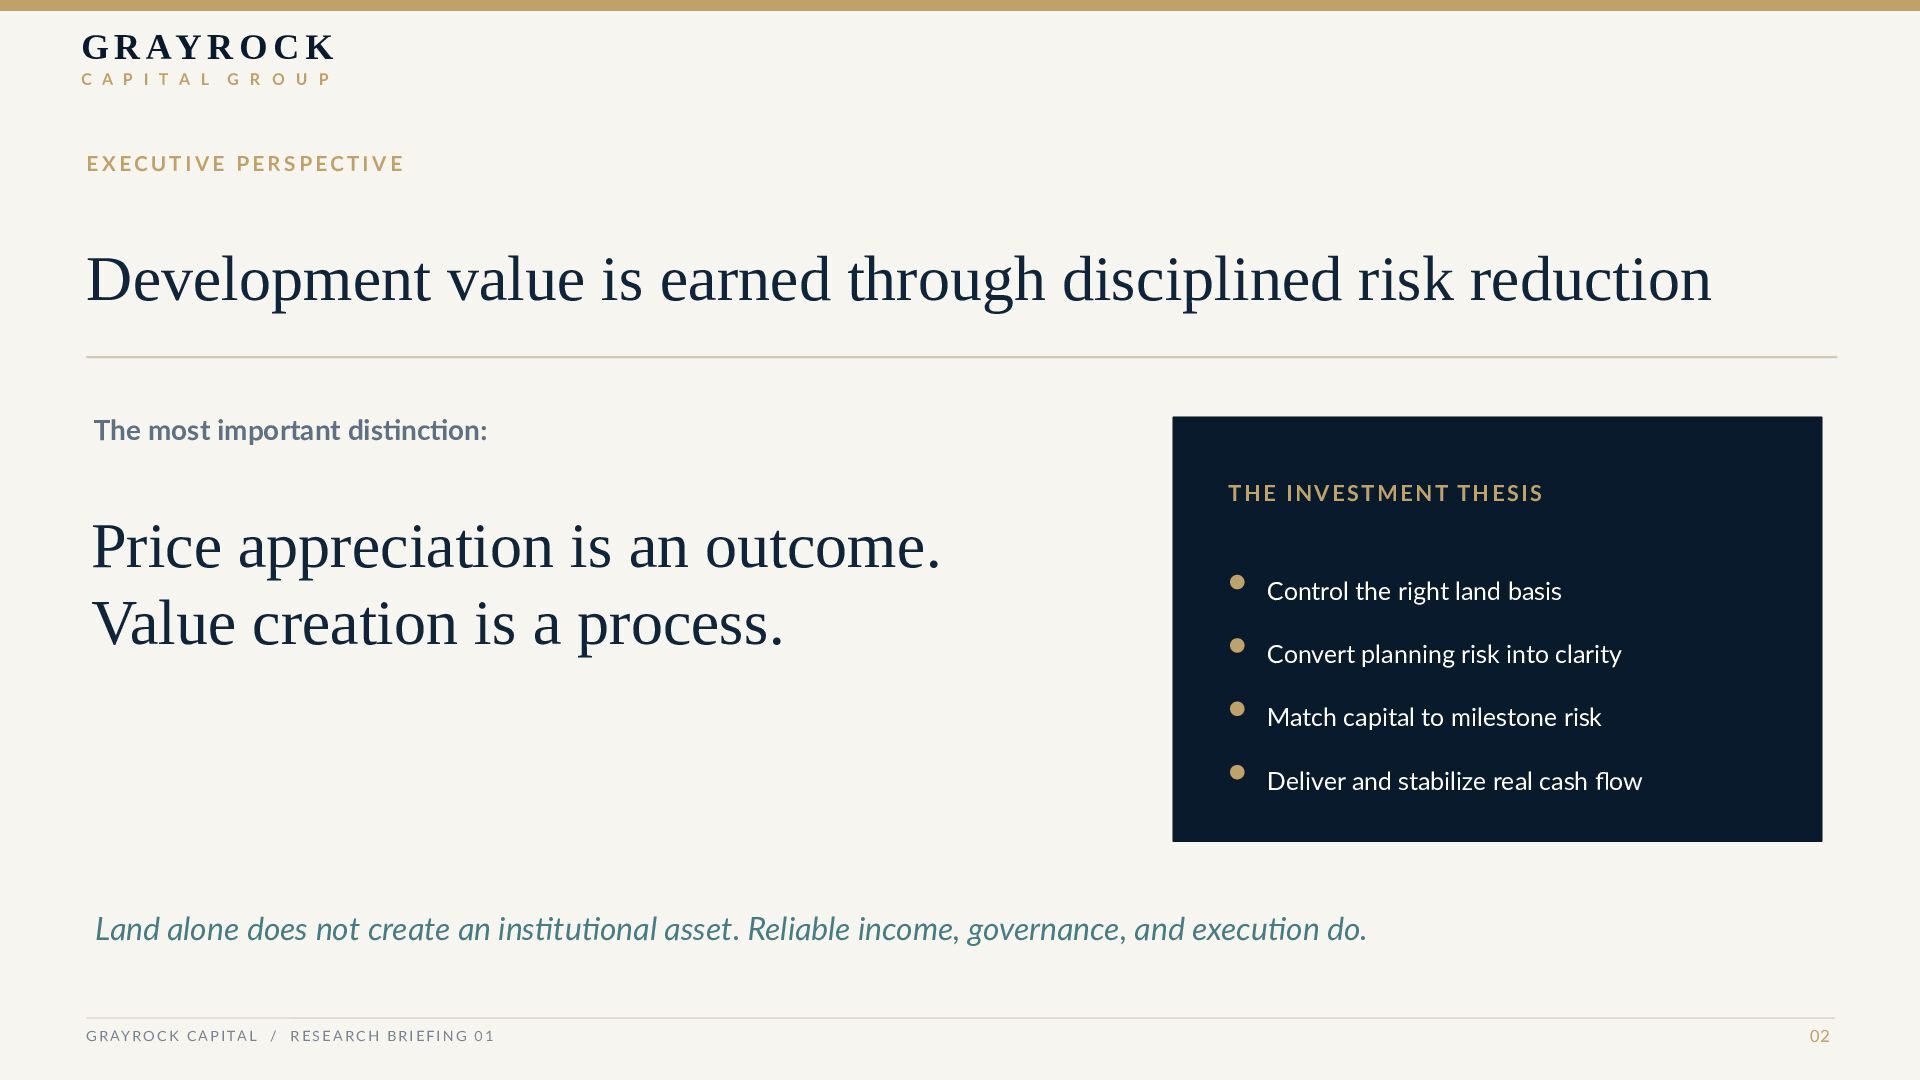
    I T A L G R O U P EXECUTIVE PERSPECTIVE Development value is earned through disciplined risk reduction The most important distinction: THE INVESTMENT THESIS Price appreciation is an outcome. Value creation is a process. Control the right land basis Convert planning risk into clarity Match capital to milestone risk Deliver and stabilize real cash flow Land alone does not create an institutional asset. Reliable income, governance, and execution do. G R AY R O C K C A P I TA L / R E S E A R C H B R I E F I N G 0 1 02
  3. G R AY R O C K C A P

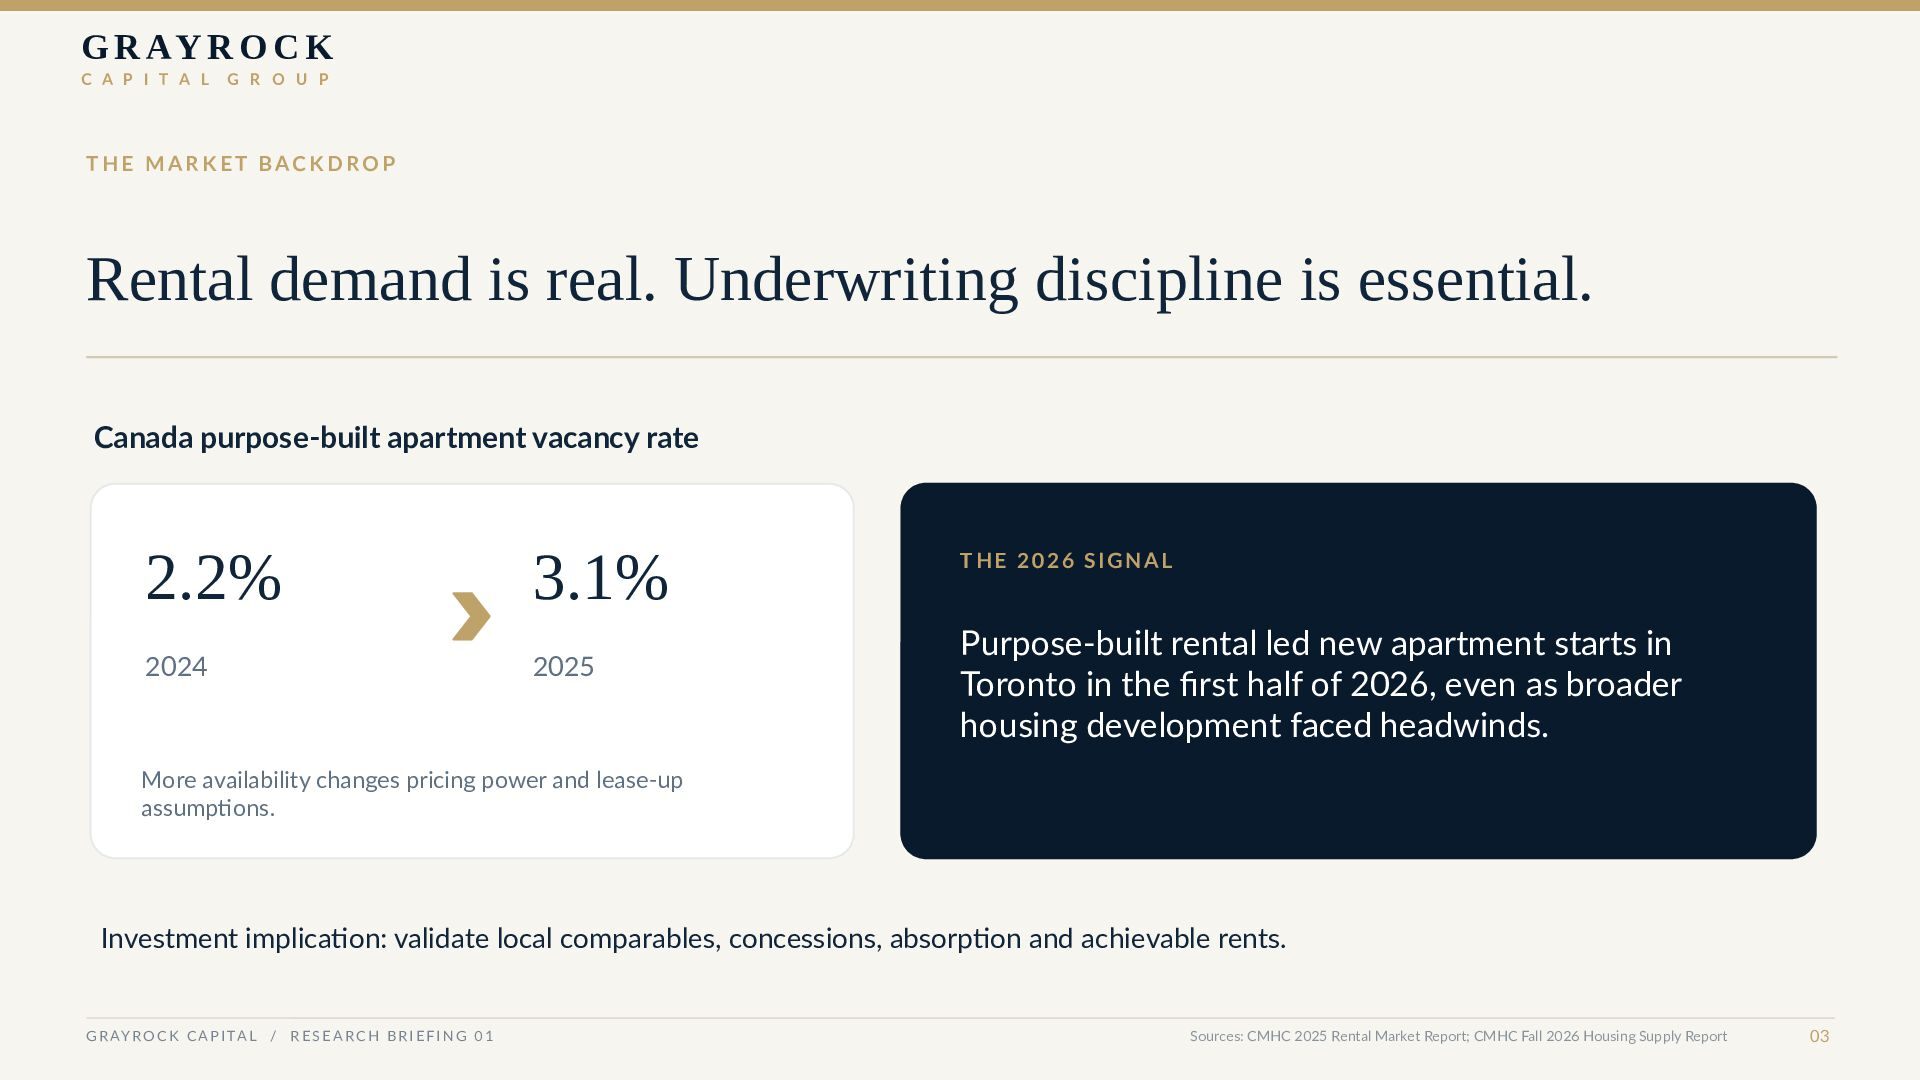
    I T A L G R O U P THE MARKET BACKDROP Rental demand is real. Underwriting discipline is essential. Canada purpose-built apartment vacancy rate 2.2% 3.1% 2024 2025 THE 2026 SIGNAL Purpose-built rental led new apartment starts in Toronto in the first half of 2026, even as broader housing development faced headwinds. More availability changes pricing power and lease-up assumptions. Investment implication: validate local comparables, concessions, absorption and achievable rents. G R AY R O C K C A P I TA L / R E S E A R C H B R I E F I N G 0 1 Sources: CMHC 2025 Rental Market Report; CMHC Fall 2026 Housing Supply Report 03
  4. G R AY R O C K C A P

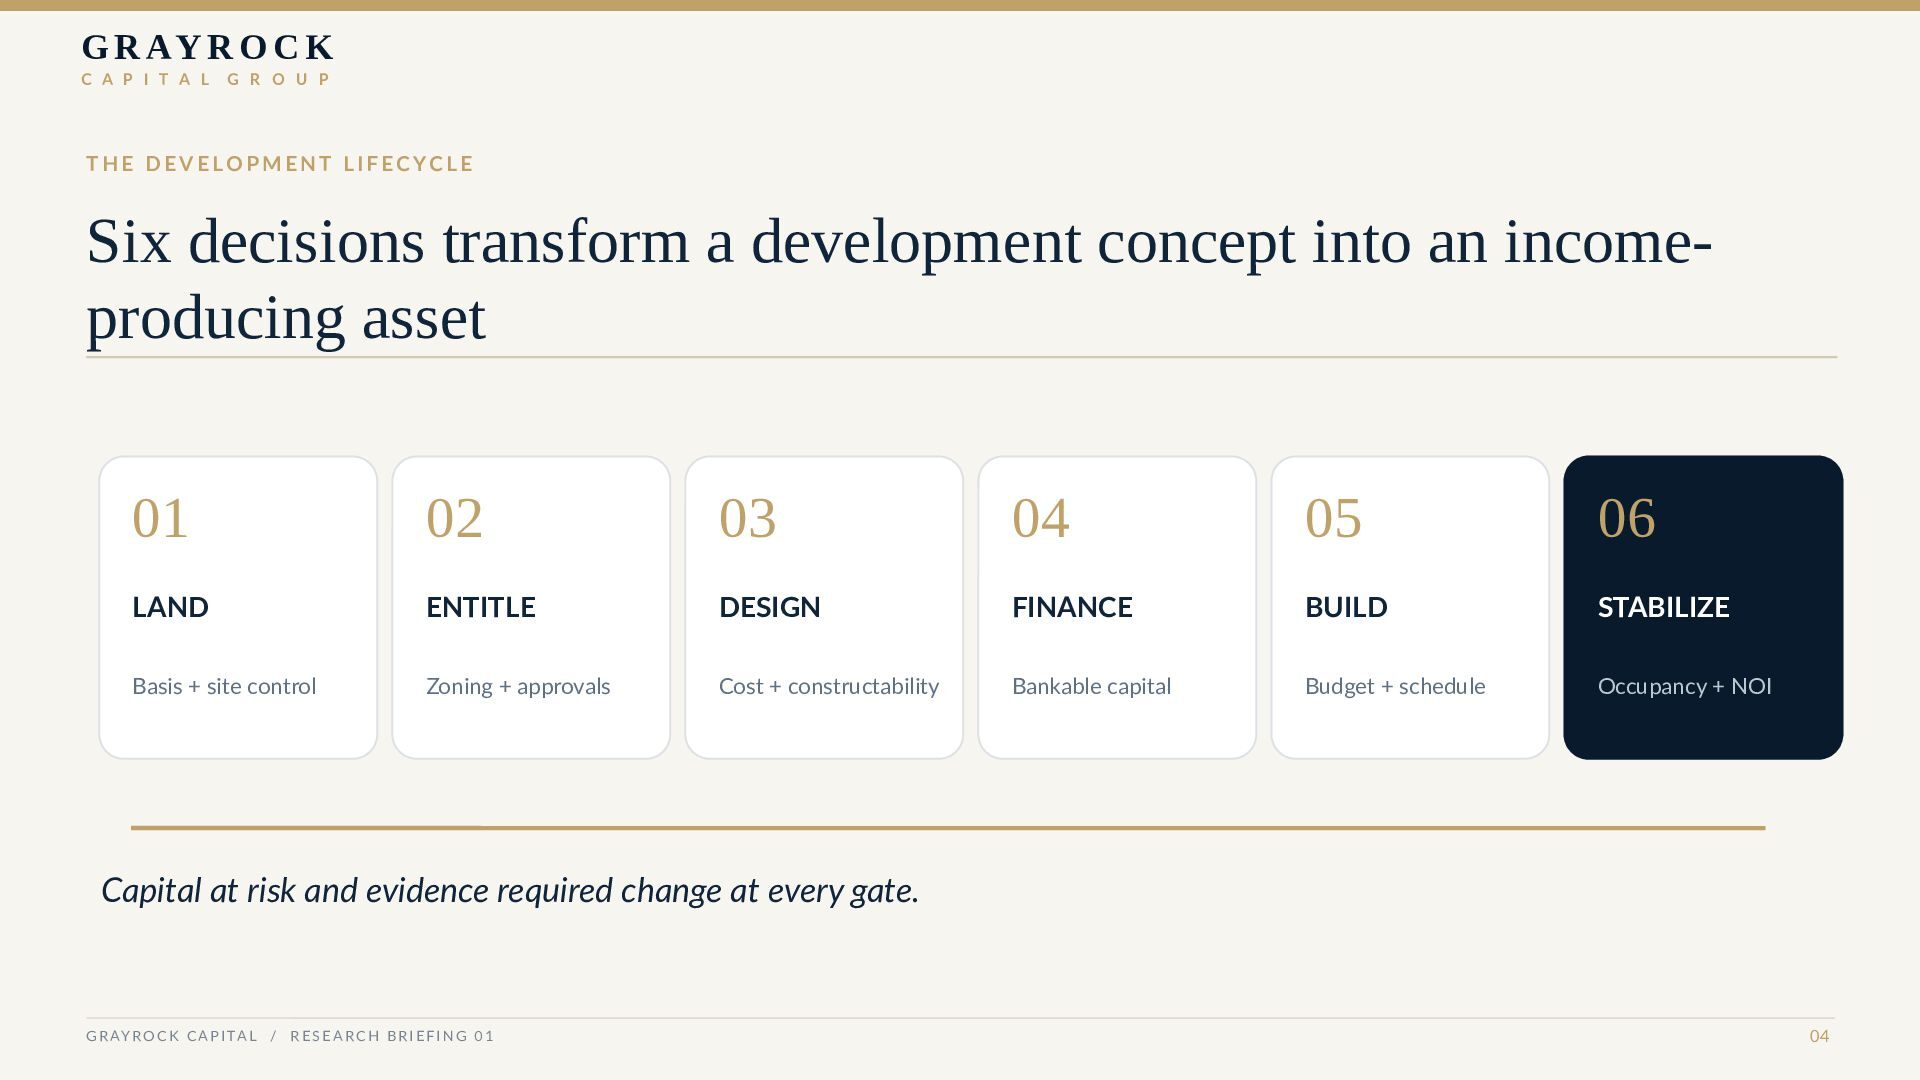
    I T A L G R O U P T H E D E V E LO P M E N T L I F EC YC L E Six decisions transform a development concept into an incomeproducing asset 01 02 03 04 05 06 LAND ENTITLE DESIGN FINANCE BUILD STABILIZE Basis + site control Zoning + approvals Cost + constructability Bankable capital Budget + schedule Occupancy + NOI Capital at risk and evidence required change at every gate. G R AY R O C K C A P I TA L / R E S E A R C H B R I E F I N G 0 1 04
  5. G R AY R O C K C A P

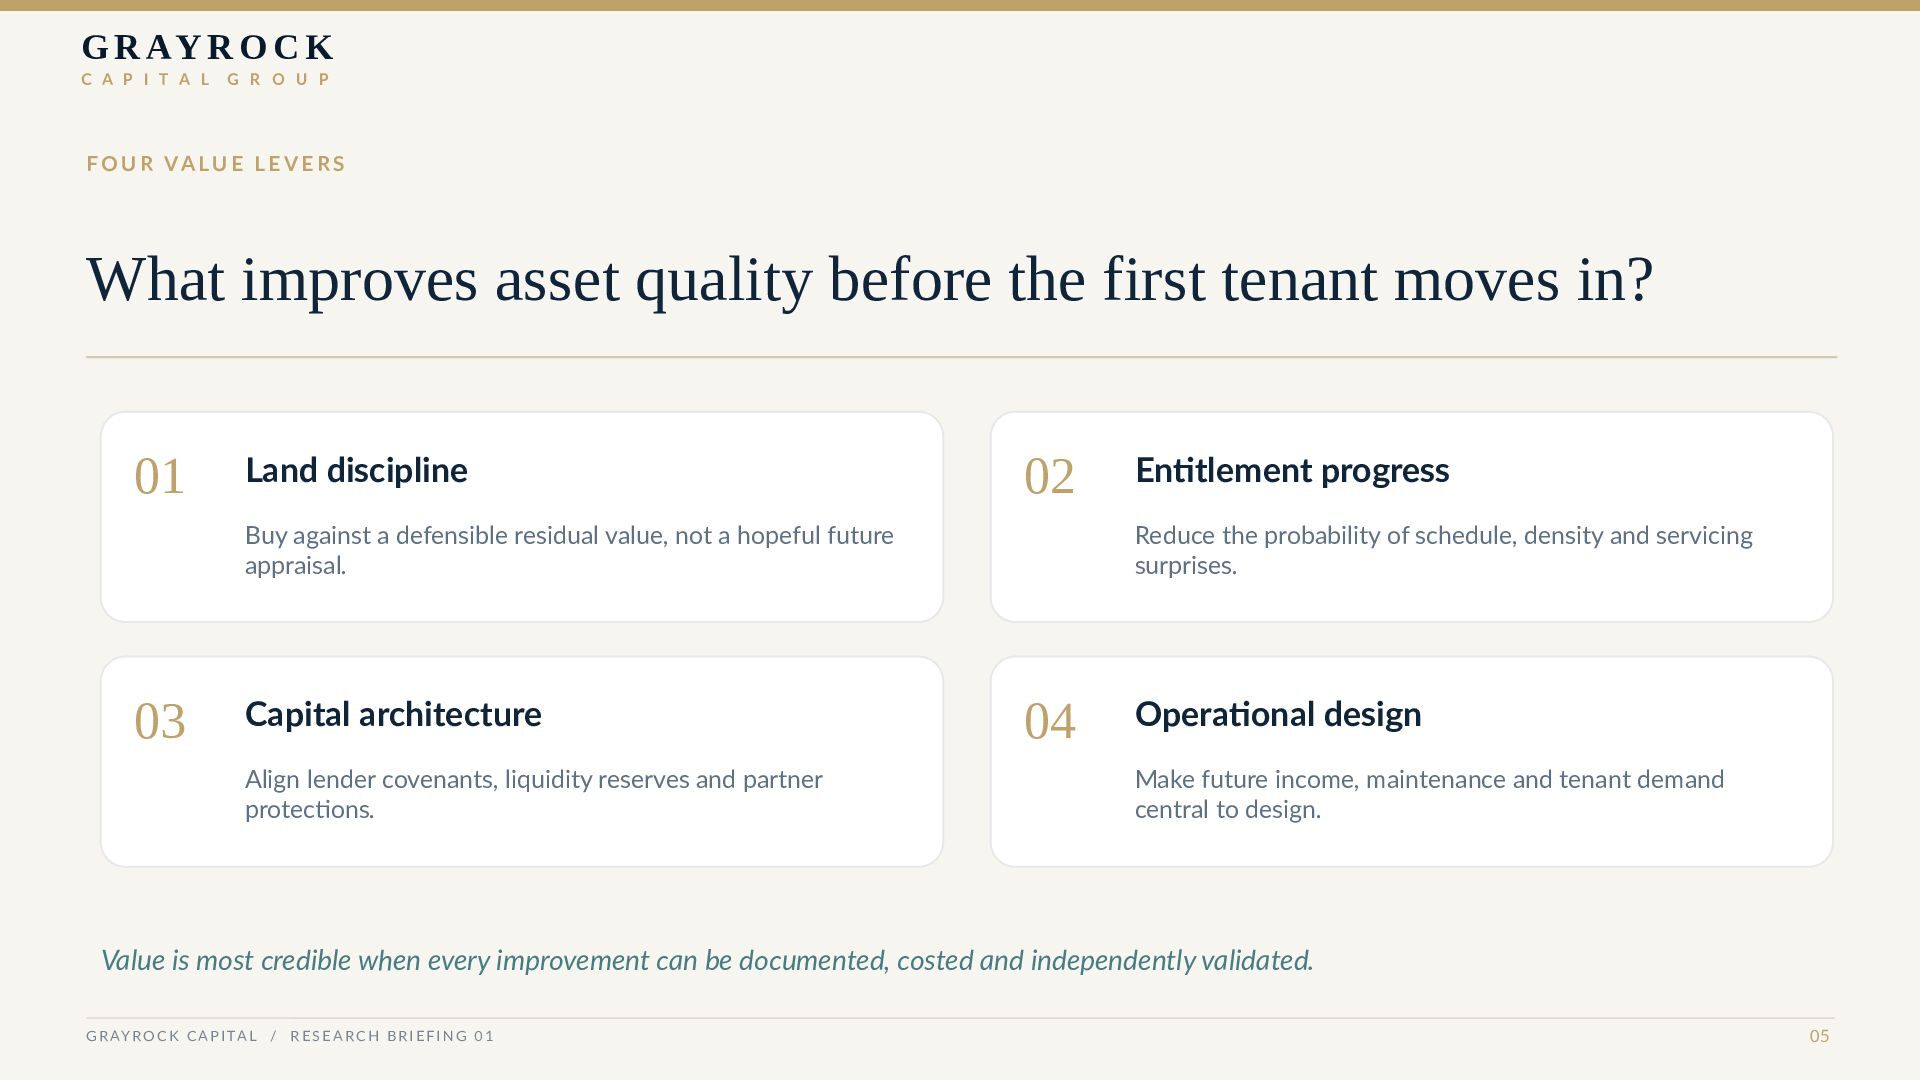
    I T A L G R O U P F O U R VA L U E L E V E R S What improves asset quality before the first tenant moves in? 01 Land discipline 02 Buy against a defensible residual value, not a hopeful future appraisal. 03 Capital architecture Align lender covenants, liquidity reserves and partner protections. Entitlement progress Reduce the probability of schedule, density and servicing surprises. 04 Operational design Make future income, maintenance and tenant demand central to design. Value is most credible when every improvement can be documented, costed and independently validated. G R AY R O C K C A P I TA L / R E S E A R C H B R I E F I N G 0 1 05
  6. G R AY R O C K C A P

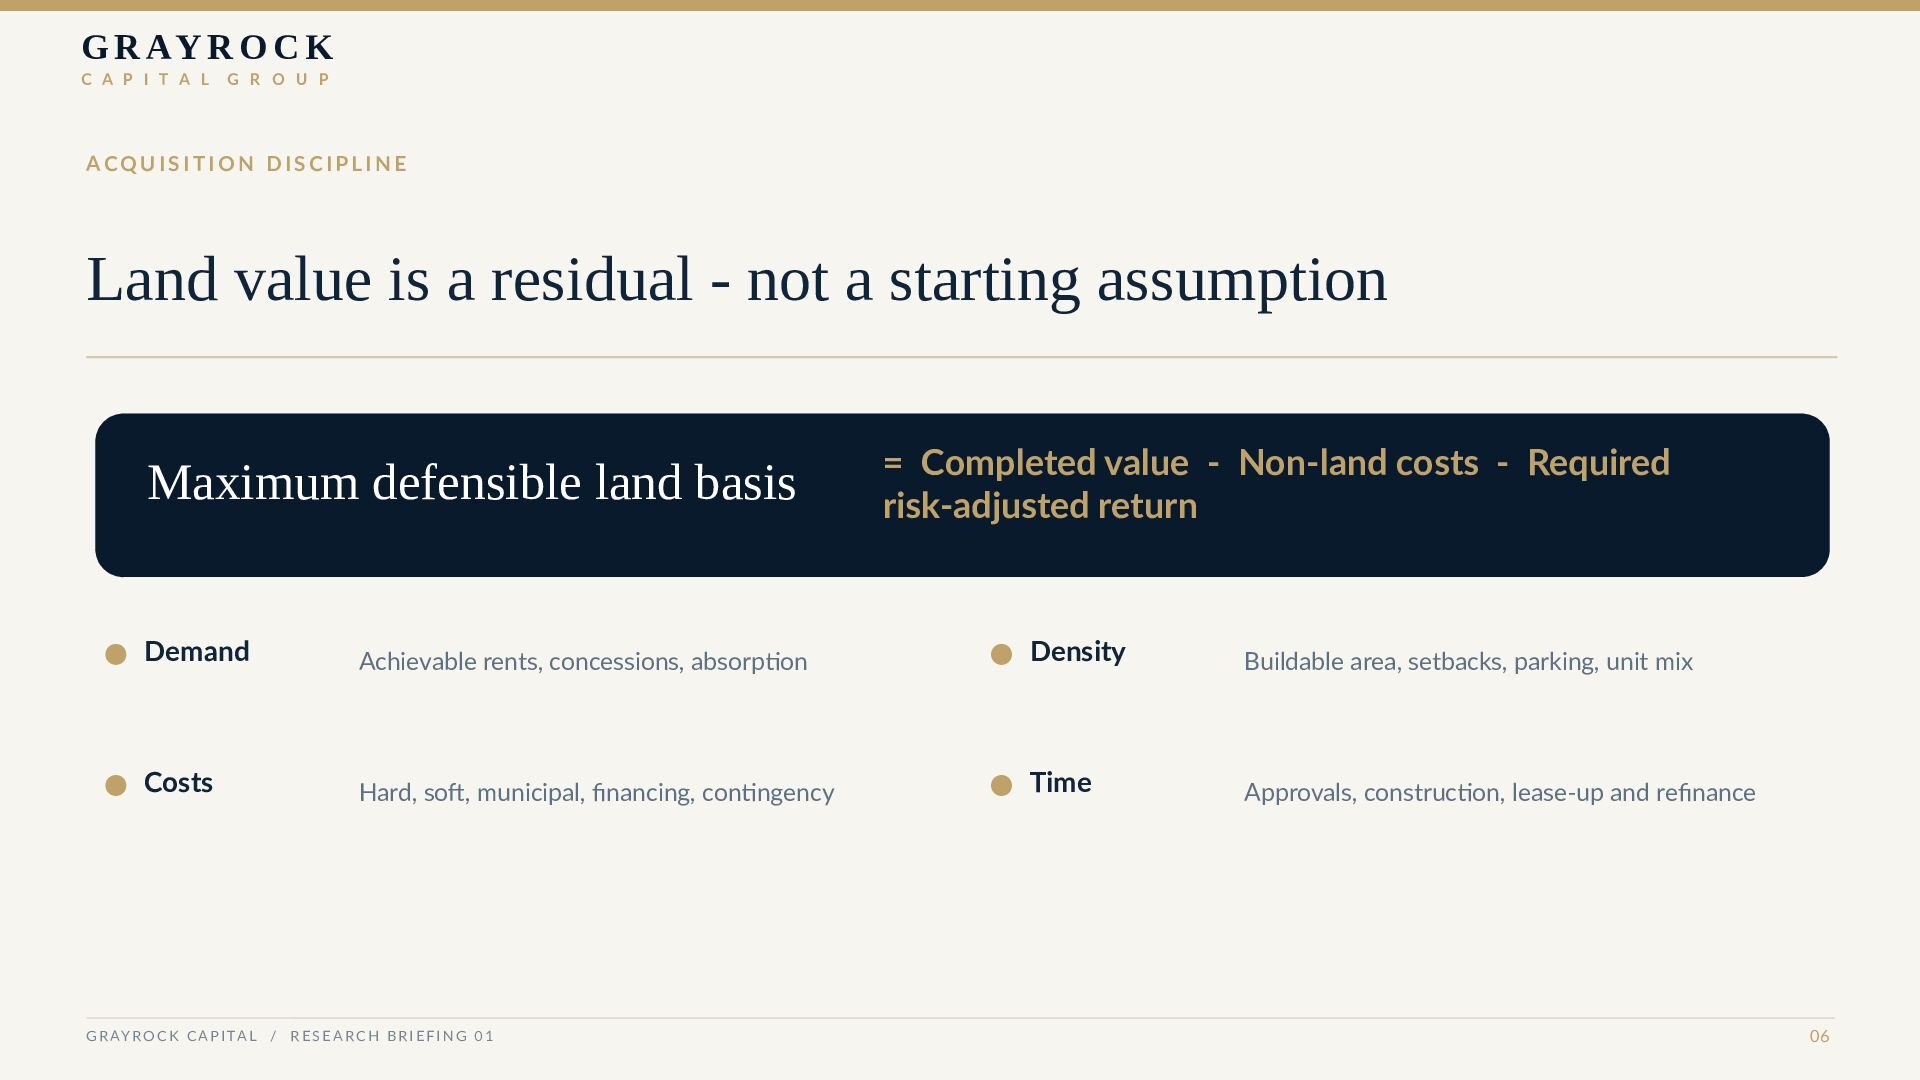
    I T A L G R O U P ACQUISITION DISCIPLINE Land value is a residual - not a starting assumption Maximum defensible land basis = Completed value - Non-land costs - Required risk-adjusted return Demand Achievable rents, concessions, absorption Density Buildable area, setbacks, parking, unit mix Costs Hard, soft, municipal, financing, contingency Time Approvals, construction, lease-up and refinance G R AY R O C K C A P I TA L / R E S E A R C H B R I E F I N G 0 1 06
  7. G R AY R O C K C A P

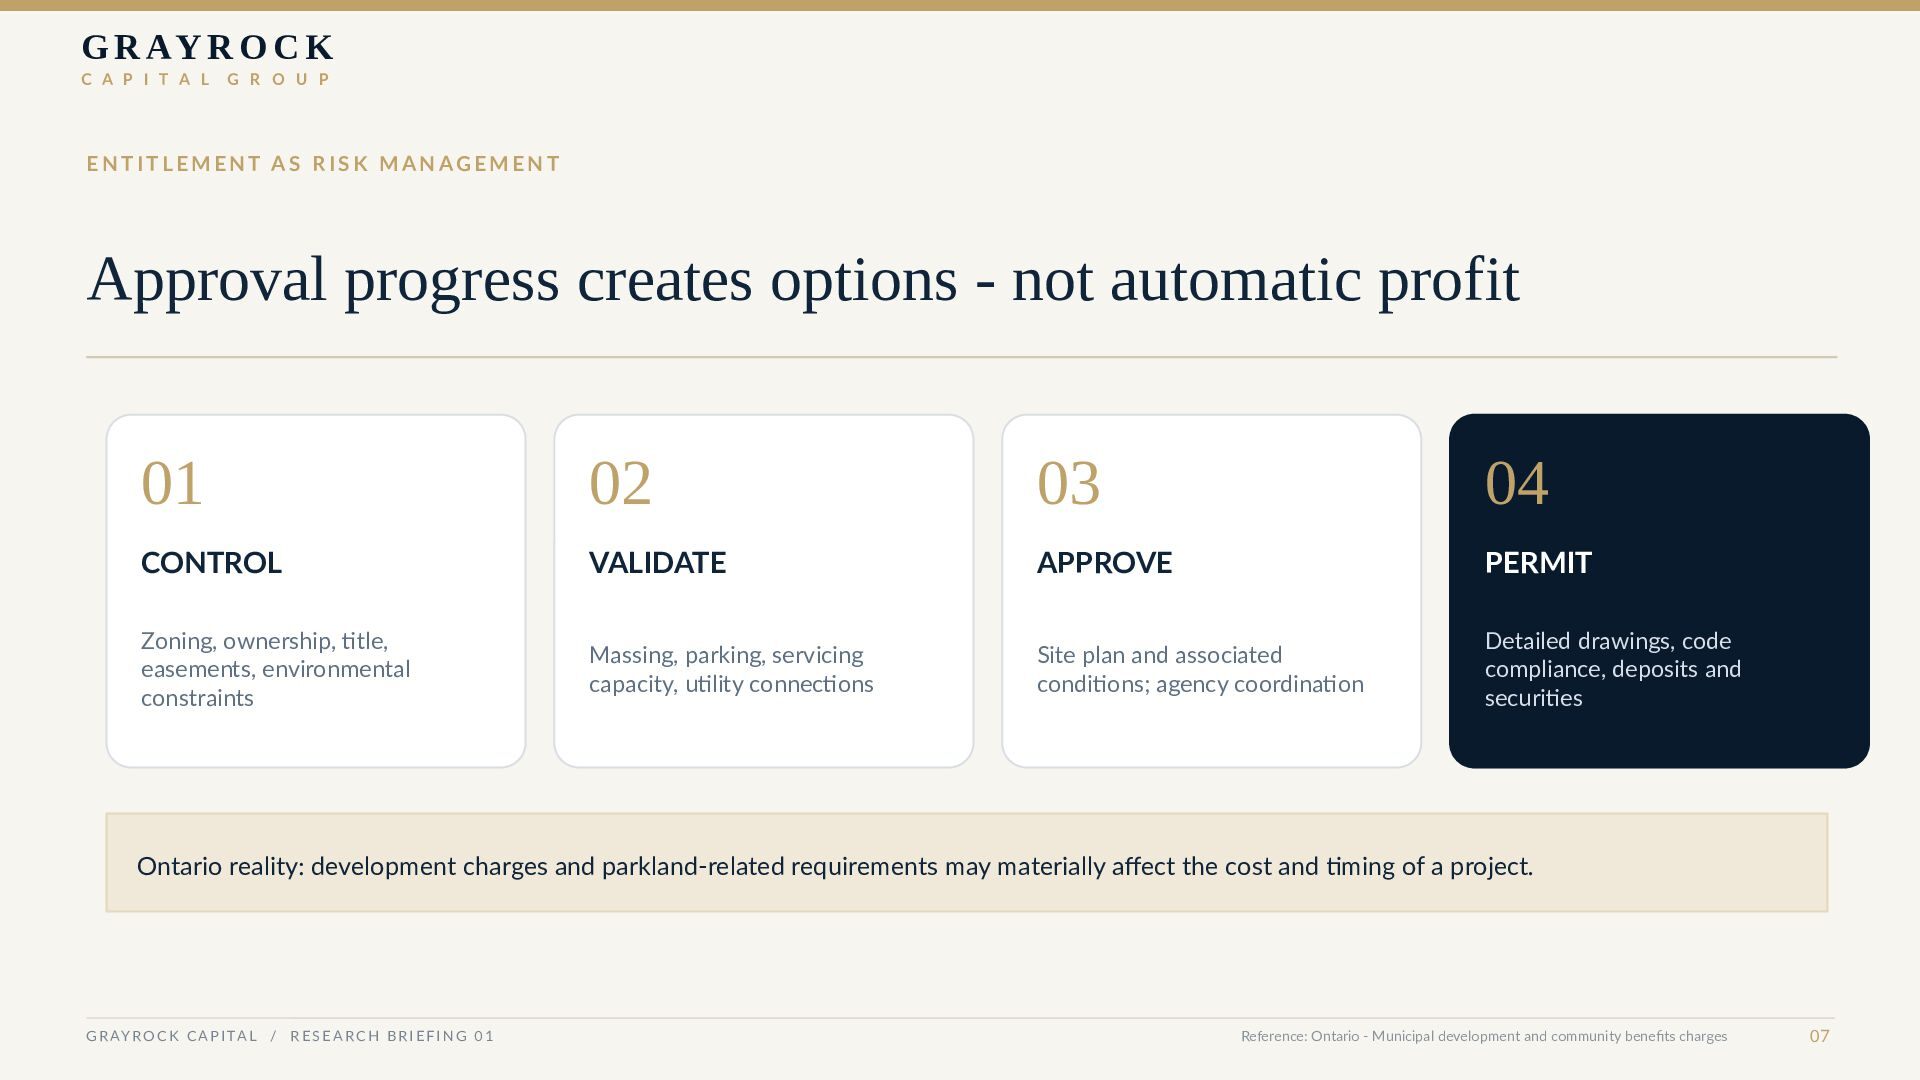
    I T A L G R O U P ENTITLEMENT AS RISK MANAGEMENT Approval progress creates options - not automatic profit 01 02 03 04 CONTROL VALIDATE APPROVE PERMIT Zoning, ownership, title, easements, environmental constraints Massing, parking, servicing capacity, utility connections Site plan and associated conditions; agency coordination Detailed drawings, code compliance, deposits and securities Ontario reality: development charges and parkland-related requirements may materially affect the cost and timing of a project. G R AY R O C K C A P I TA L / R E S E A R C H B R I E F I N G 0 1 Reference: Ontario - Municipal development and community benefits charges 07
  8. G R AY R O C K C A P

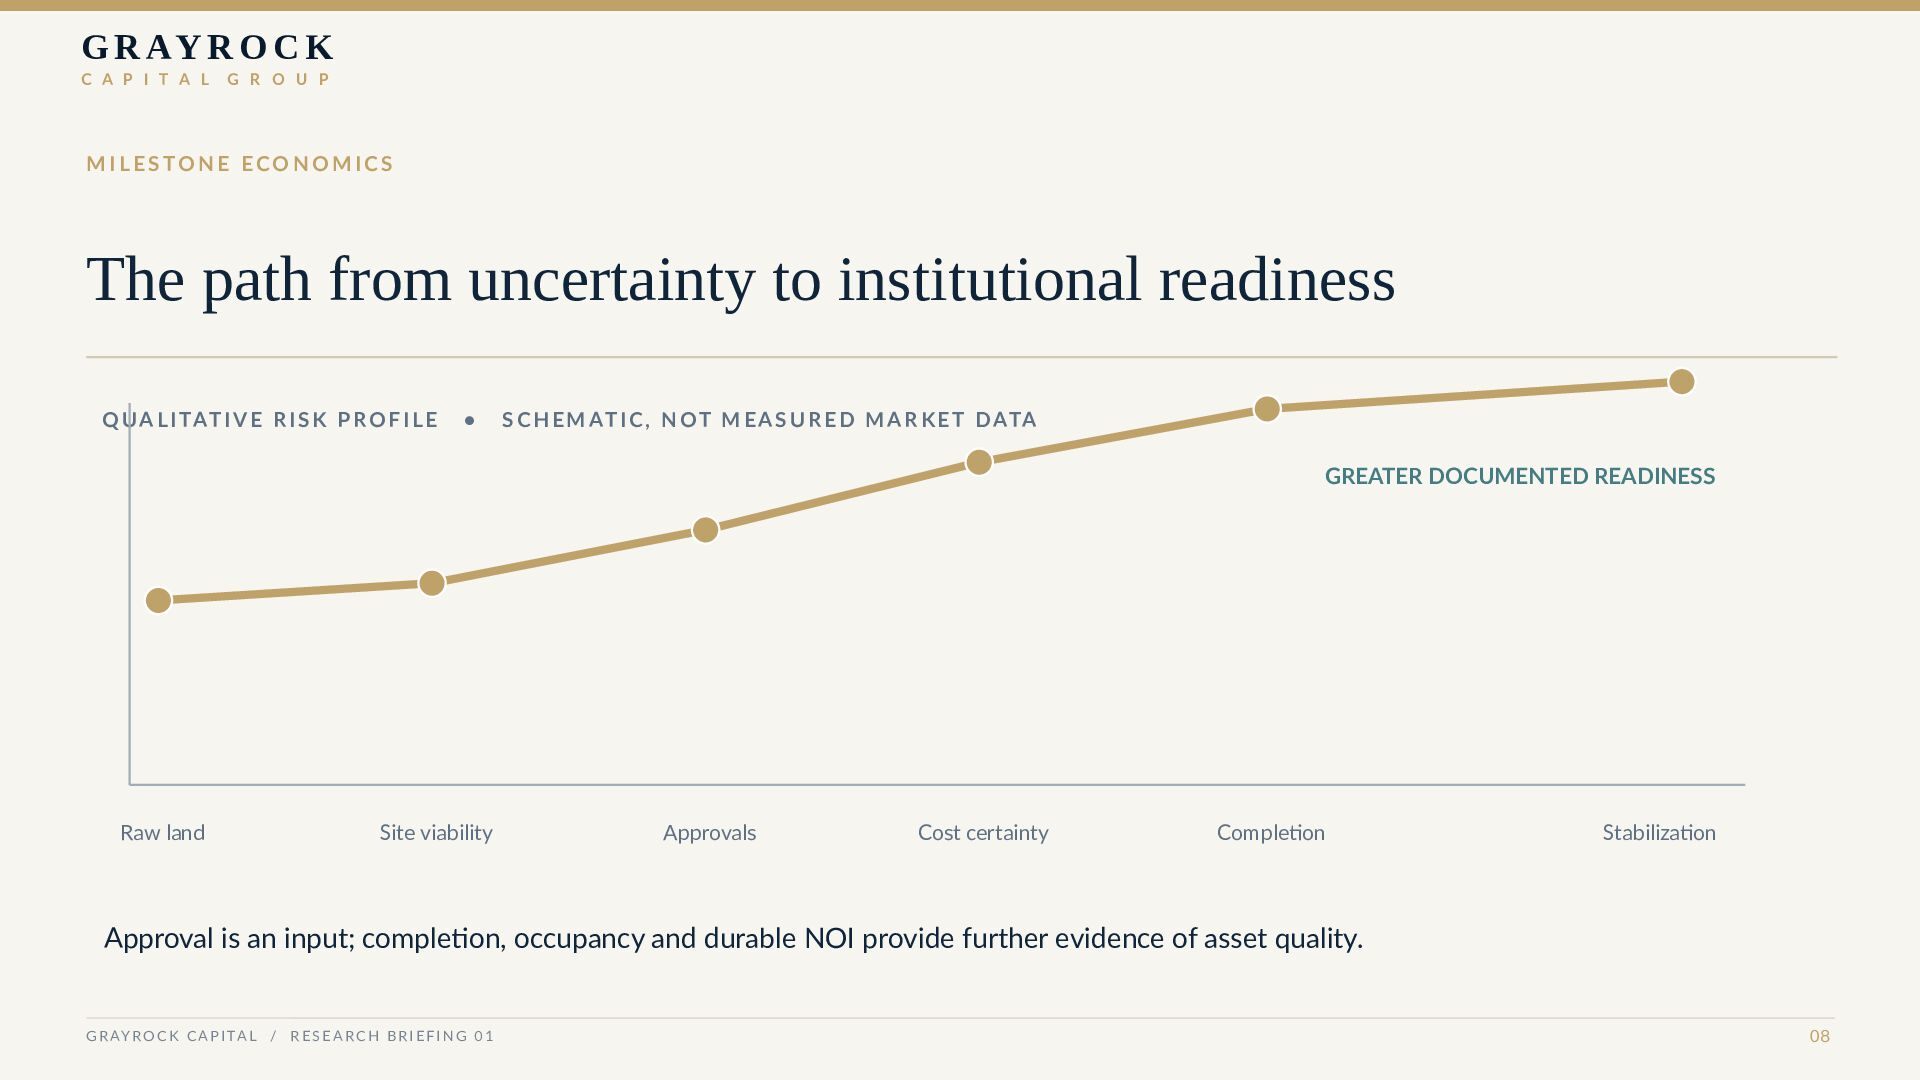
    I T A L G R O U P MILESTONE ECONOMICS The path from uncertainty to institutional readiness Q U A L I TAT I V E R I S K P R O F I L E • S C H E M AT I C , N O T M E A S U R E D M A R K E T D ATA GREATER DOCUMENTED READINESS Raw land Site viability Approvals Cost certainty Completion Stabilization Approval is an input; completion, occupancy and durable NOI provide further evidence of asset quality. G R AY R O C K C A P I TA L / R E S E A R C H B R I E F I N G 0 1 08
  9. G R AY R O C K C A P

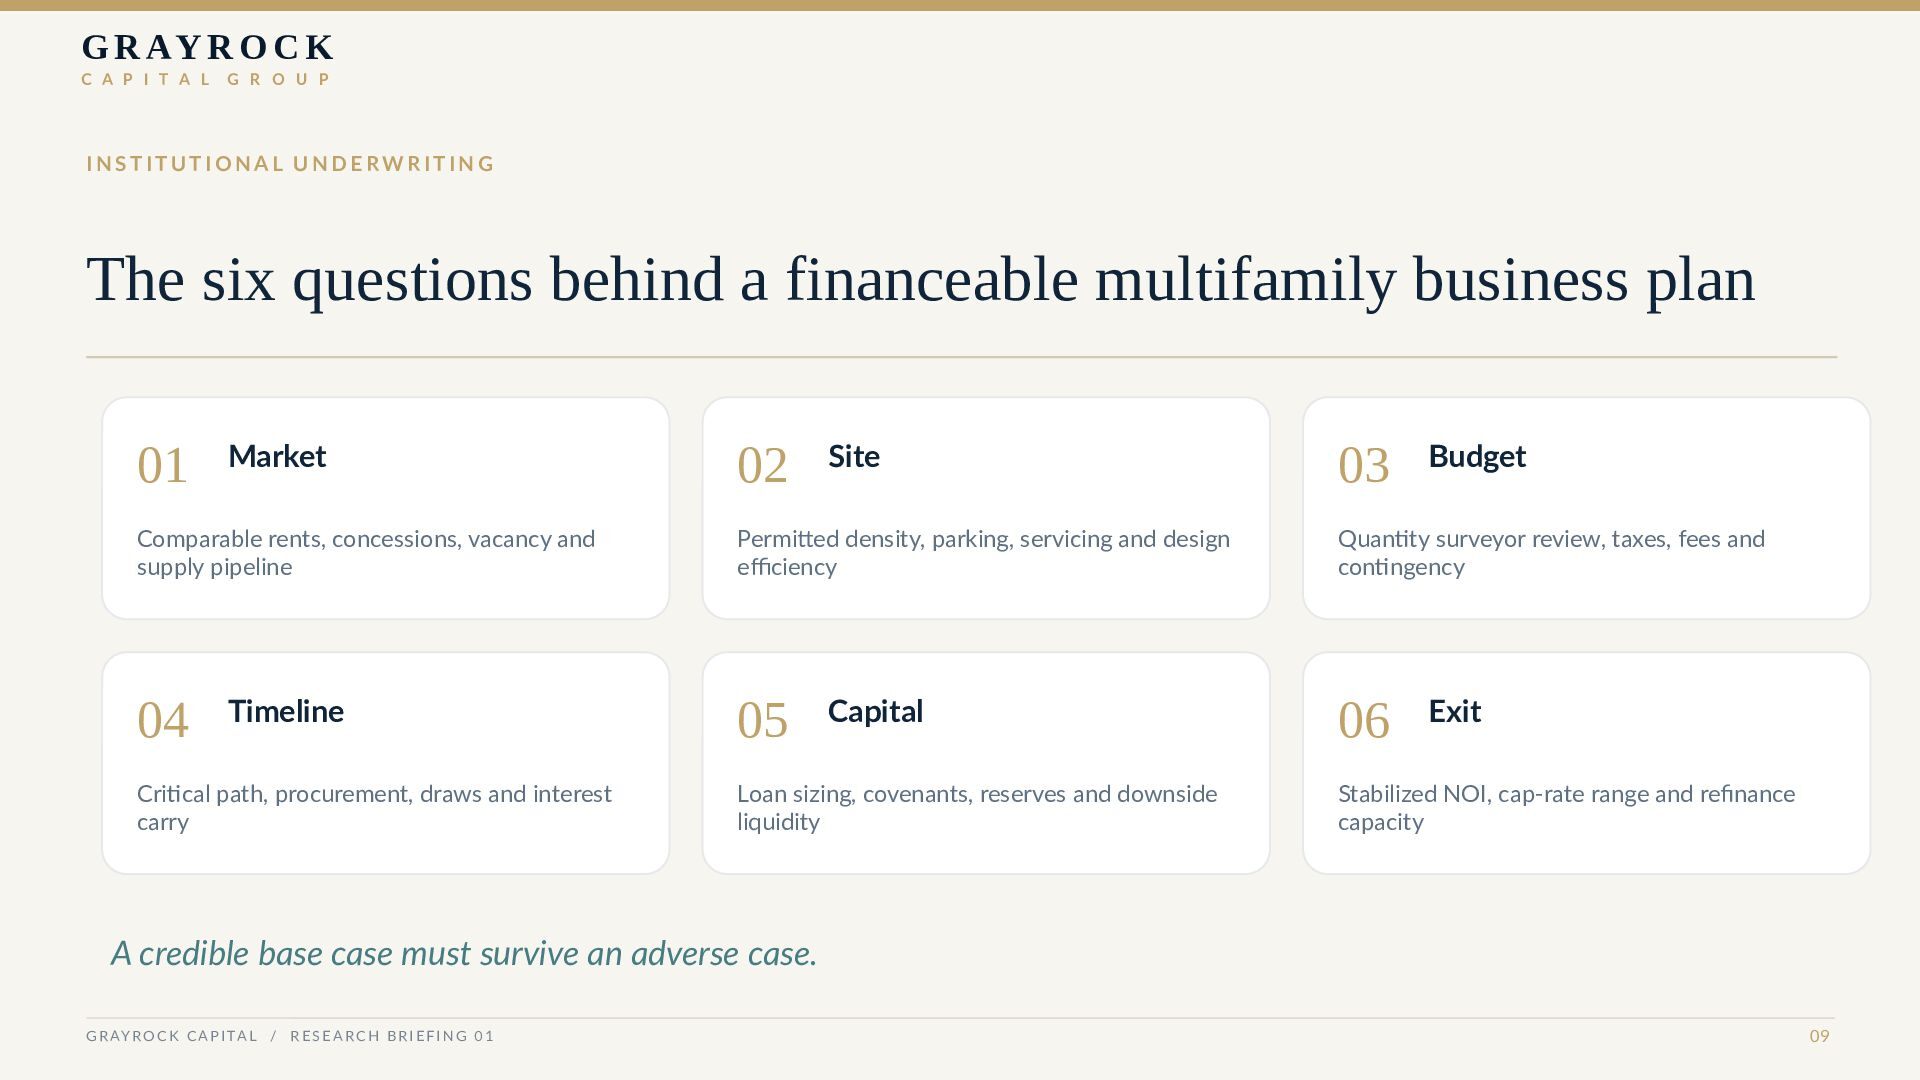
    I T A L G R O U P INSTITUTIONAL UNDERWRITING The six questions behind a financeable multifamily business plan 01 Market 02 Site 03 Budget Comparable rents, concessions, vacancy and supply pipeline Permitted density, parking, servicing and design efficiency Quantity surveyor review, taxes, fees and contingency 04 05 06 Timeline Critical path, procurement, draws and interest carry Capital Loan sizing, covenants, reserves and downside liquidity Exit Stabilized NOI, cap-rate range and refinance capacity A credible base case must survive an adverse case. G R AY R O C K C A P I TA L / R E S E A R C H B R I E F I N G 0 1 09
  10. G R AY R O C K C A P

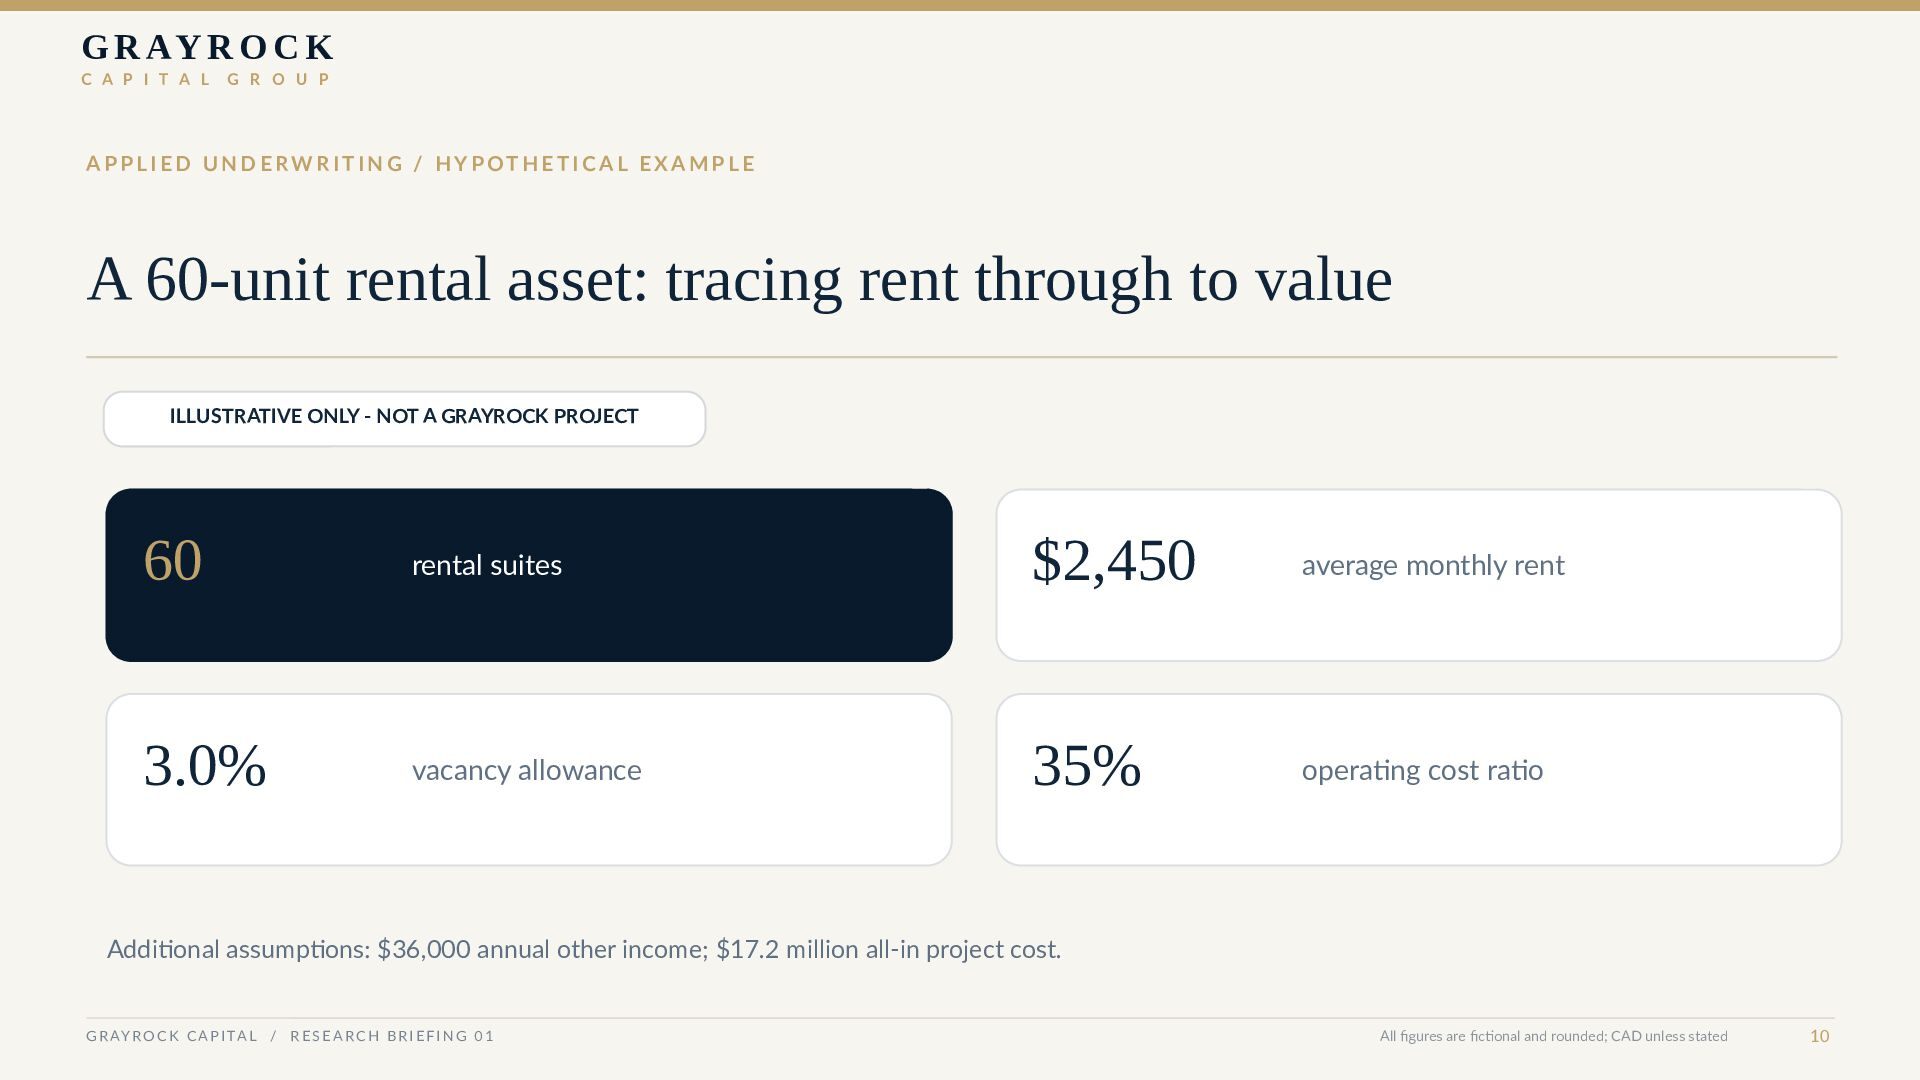
    I T A L G R O U P APPLIED UNDERWRITING / HYPOTHETICAL EXAMPLE A 60-unit rental asset: tracing rent through to value ILLUSTRATIVE ONLY - NOT A GRAYROCK PROJECT 60 rental suites $2,450 average monthly rent 3.0% vacancy allowance 35% operating cost ratio Additional assumptions: $36,000 annual other income; $17.2 million all-in project cost. G R AY R O C K C A P I TA L / R E S E A R C H B R I E F I N G 0 1 All figures are fictional and rounded; CAD unless stated 10
  11. G R AY R O C K C A P

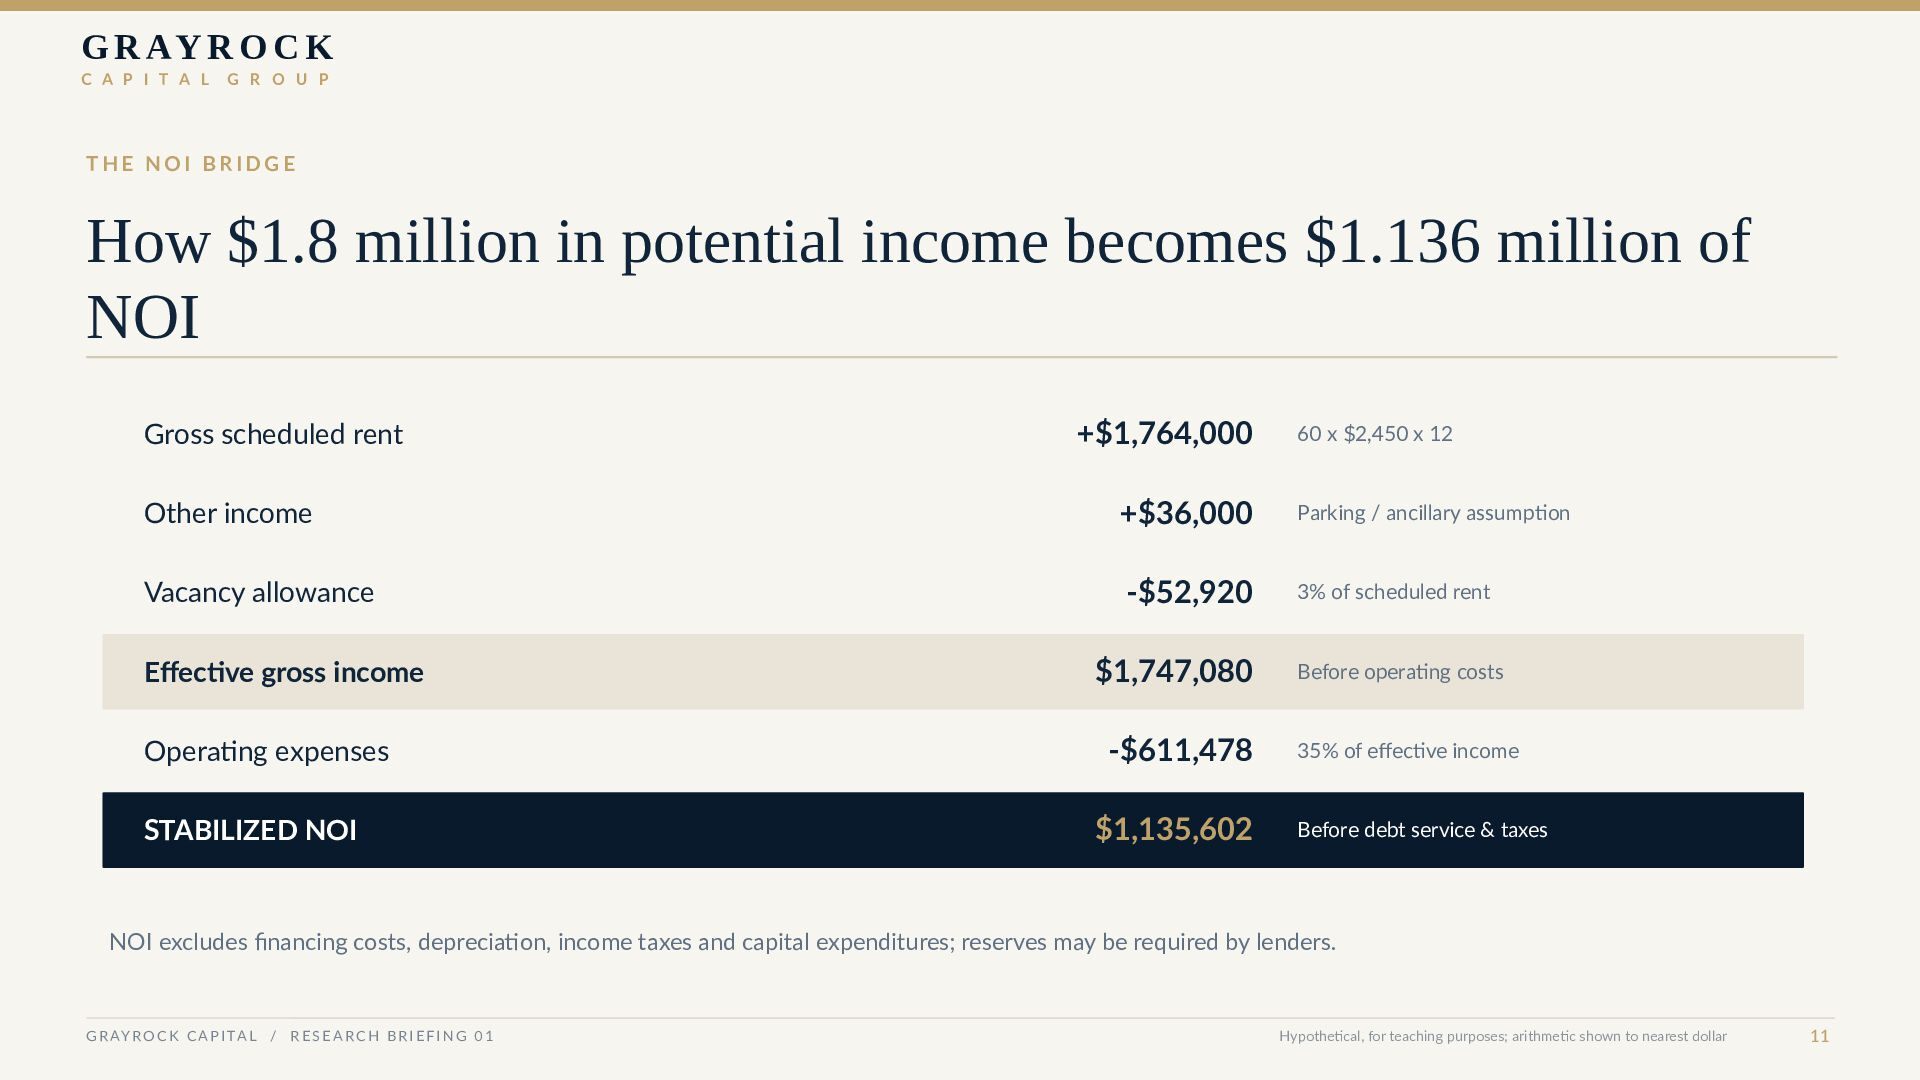
    I T A L G R O U P THE NOI BRIDGE How $1.8 million in potential income becomes $1.136 million of NOI Gross scheduled rent +$1,764,000 60 x $2,450 x 12 Other income +$36,000 Parking / ancillary assumption Vacancy allowance -$52,920 3% of scheduled rent Effective gross income $1,747,080 Before operating costs Operating expenses -$611,478 35% of effective income STABILIZED NOI $1,135,602 Before debt service & taxes NOI excludes financing costs, depreciation, income taxes and capital expenditures; reserves may be required by lenders. G R AY R O C K C A P I TA L / R E S E A R C H B R I E F I N G 0 1 Hypothetical, for teaching purposes; arithmetic shown to nearest dollar 11
  12. G R AY R O C K C A P

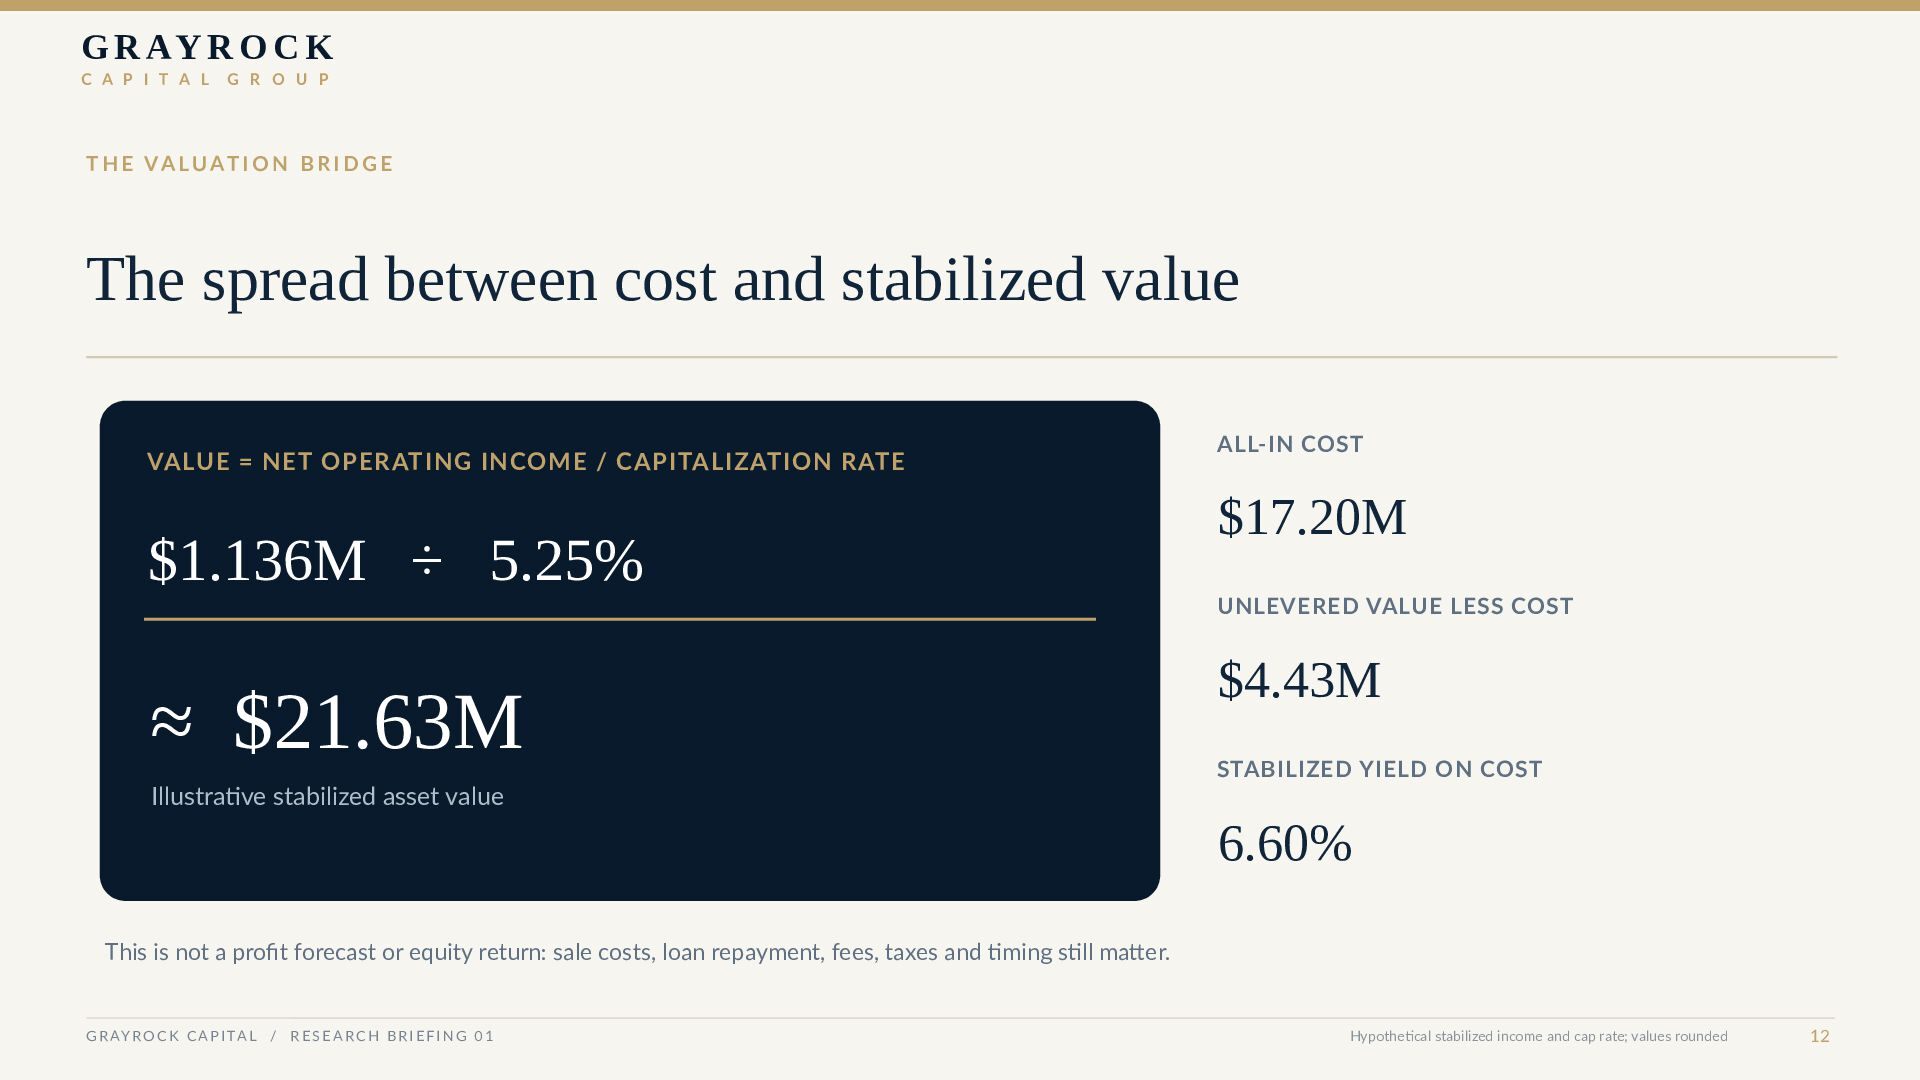
    I T A L G R O U P T H E V A L U AT I O N B R I D G E The spread between cost and stabilized value VALUE = NET OPERATING INCOME / CAPITALIZATION RATE $1.136M ÷ 5.25% ≈ $21.63M Illustrative stabilized asset value ALL-IN COST $17.20M UNLEVERED VALUE LESS COST $4.43M STABILIZED YIELD ON COST 6.60% This is not a profit forecast or equity return: sale costs, loan repayment, fees, taxes and timing still matter. G R AY R O C K C A P I TA L / R E S E A R C H B R I E F I N G 0 1 Hypothetical stabilized income and cap rate; values rounded 12
  13. G R AY R O C K C A P

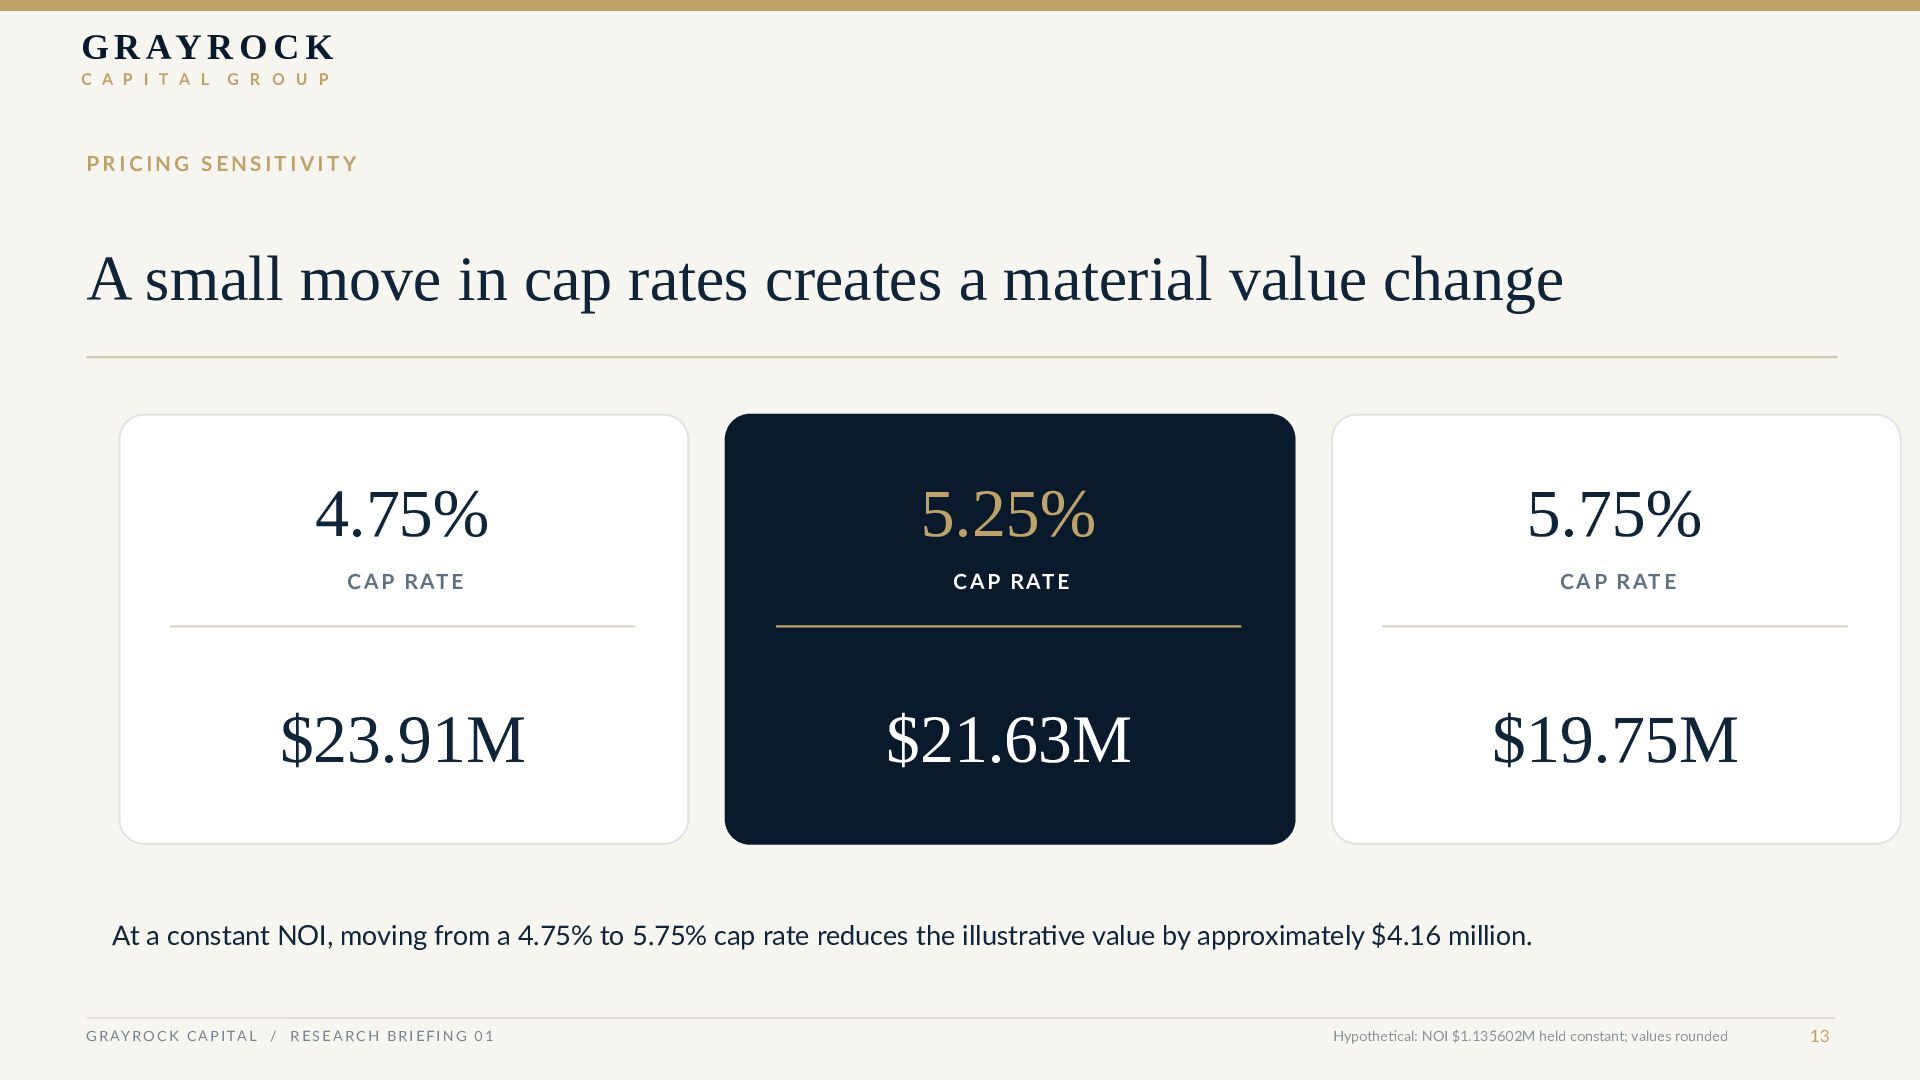
    I T A L G R O U P PRICING SENSITIVITY A small move in cap rates creates a material value change 4.75% 5.25% 5.75% C A P R AT E C A P R AT E C A P R AT E $23.91M $21.63M $19.75M At a constant NOI, moving from a 4.75% to 5.75% cap rate reduces the illustrative value by approximately $4.16 million. G R AY R O C K C A P I TA L / R E S E A R C H B R I E F I N G 0 1 Hypothetical: NOI $1.135602M held constant; values rounded 13
  14. G R AY R O C K C A P

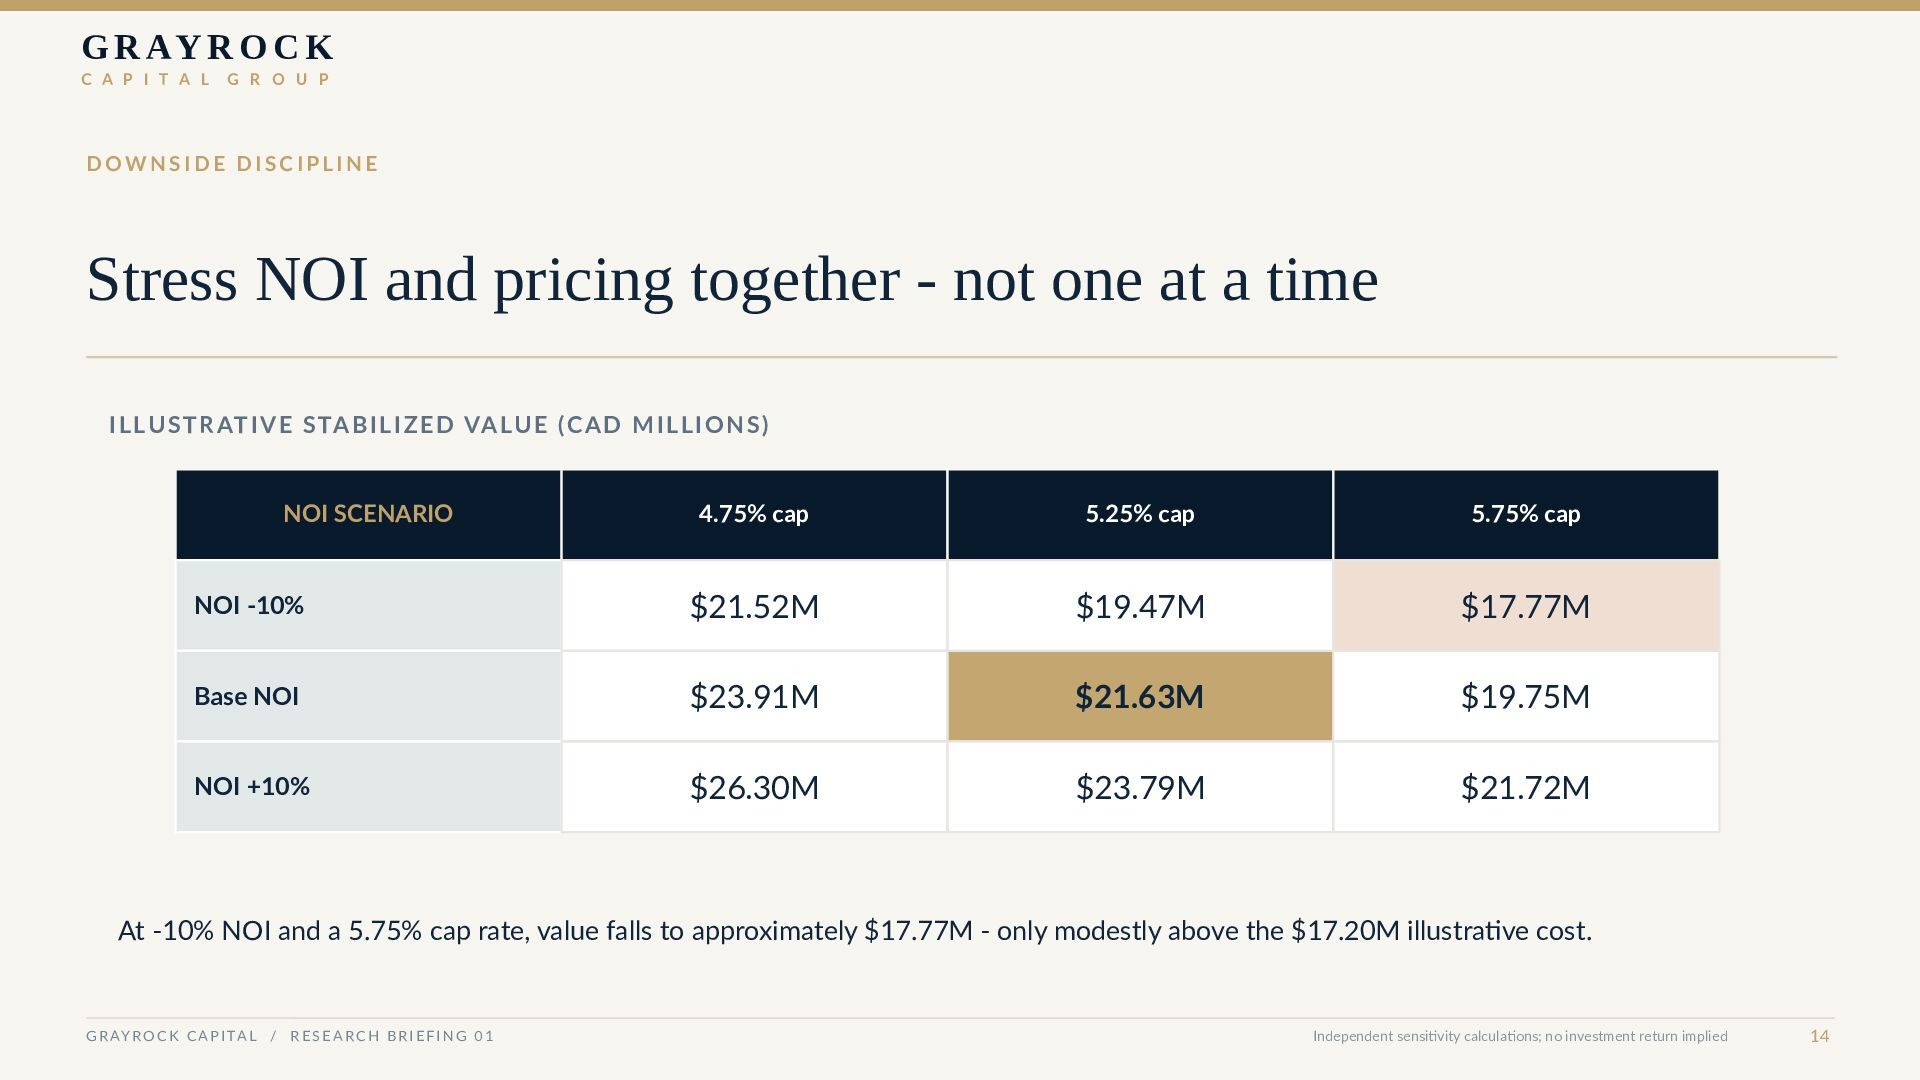
    I T A L G R O U P DOWNSIDE DISCIPLINE Stress NOI and pricing together - not one at a time I L LU S T R AT I V E S TA B I L I Z E D VA LU E (C A D M I L L I O N S ) NOI SCENARIO 4.75% cap 5.25% cap 5.75% cap NOI -10% $21.52M $19.47M $17.77M Base NOI $23.91M $21.63M $19.75M NOI +10% $26.30M $23.79M $21.72M At -10% NOI and a 5.75% cap rate, value falls to approximately $17.77M - only modestly above the $17.20M illustrative cost. G R AY R O C K C A P I TA L / R E S E A R C H B R I E F I N G 0 1 Independent sensitivity calculations; no investment return implied 14
  15. G R AY R O C K C A P

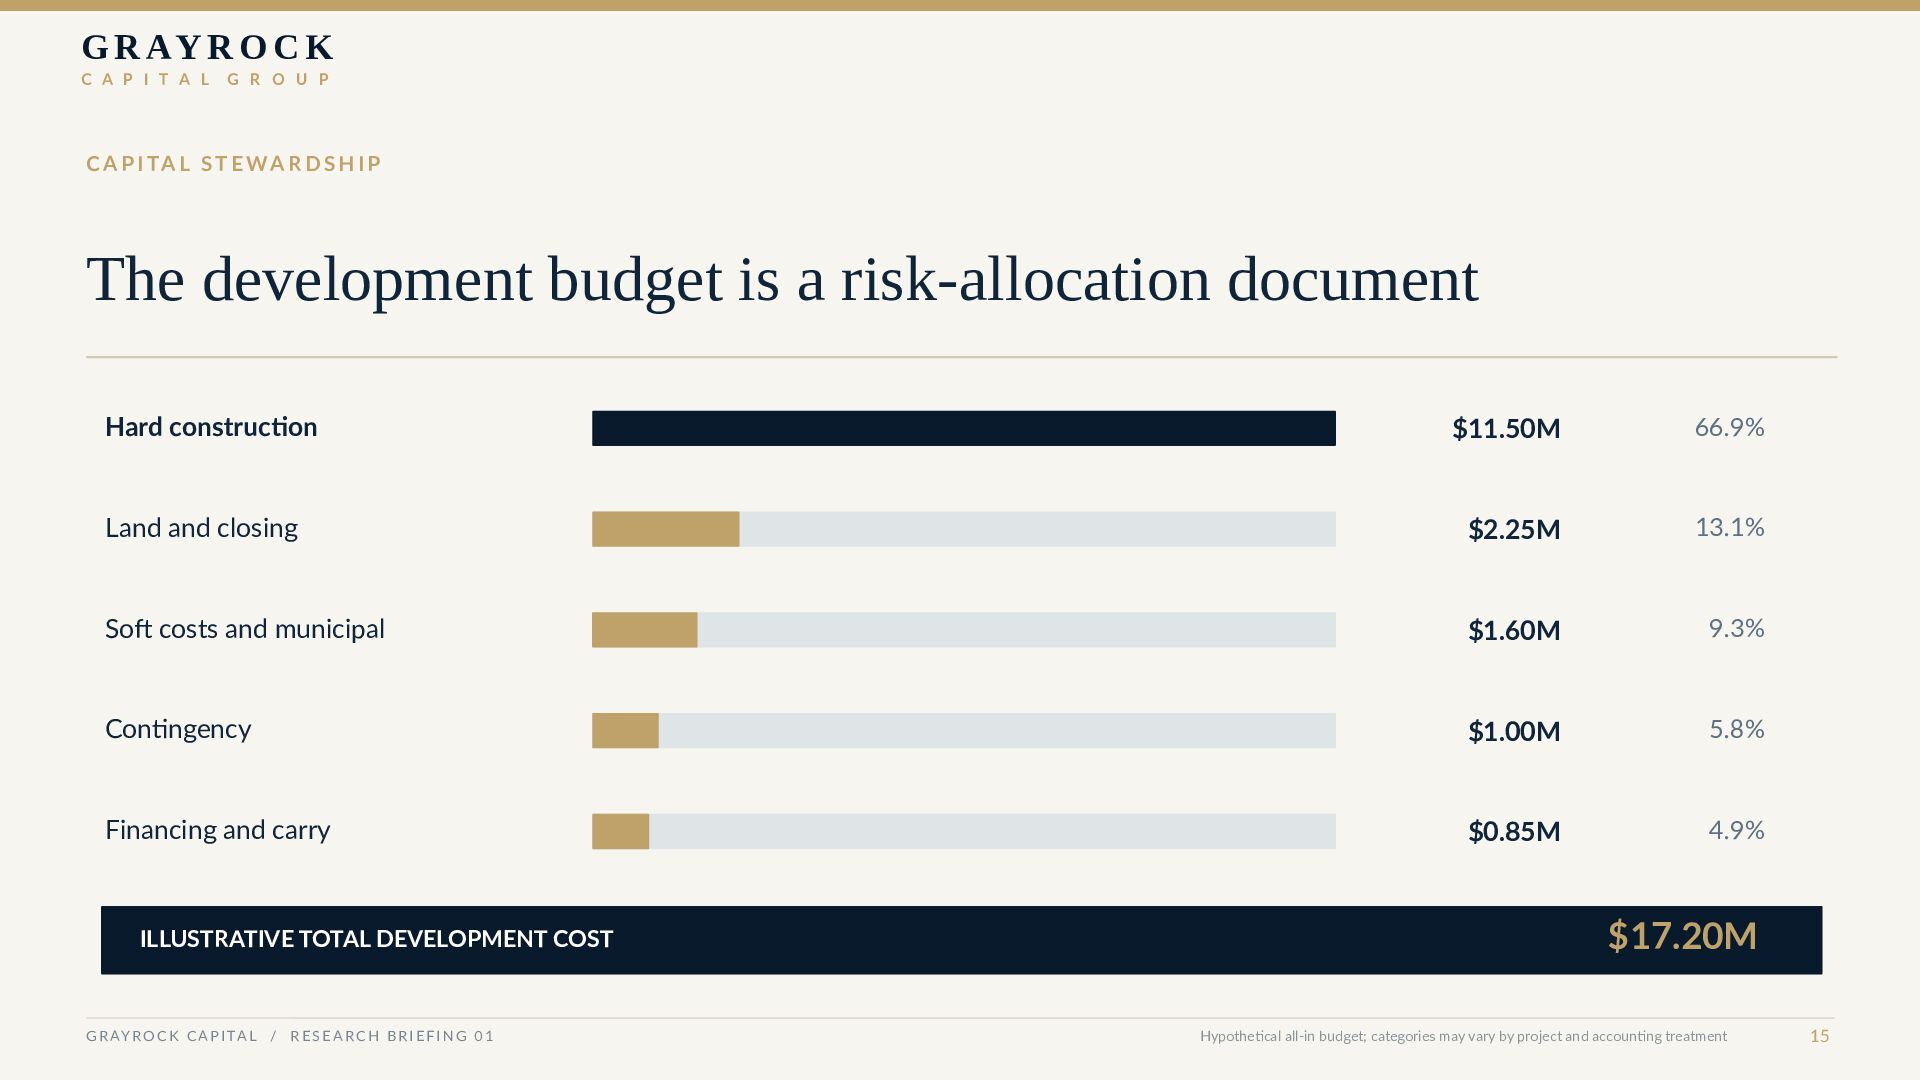
    I T A L G R O U P C A P I TA L S T E W A R D S H I P The development budget is a risk-allocation document Hard construction $11.50M 66.9% Land and closing $2.25M 13.1% Soft costs and municipal $1.60M 9.3% Contingency $1.00M 5.8% Financing and carry $0.85M 4.9% ILLUSTRATIVE TOTAL DEVELOPMENT COST G R AY R O C K C A P I TA L / R E S E A R C H B R I E F I N G 0 1 $17.20M Hypothetical all-in budget; categories may vary by project and accounting treatment 15
  16. G R AY R O C K C A P

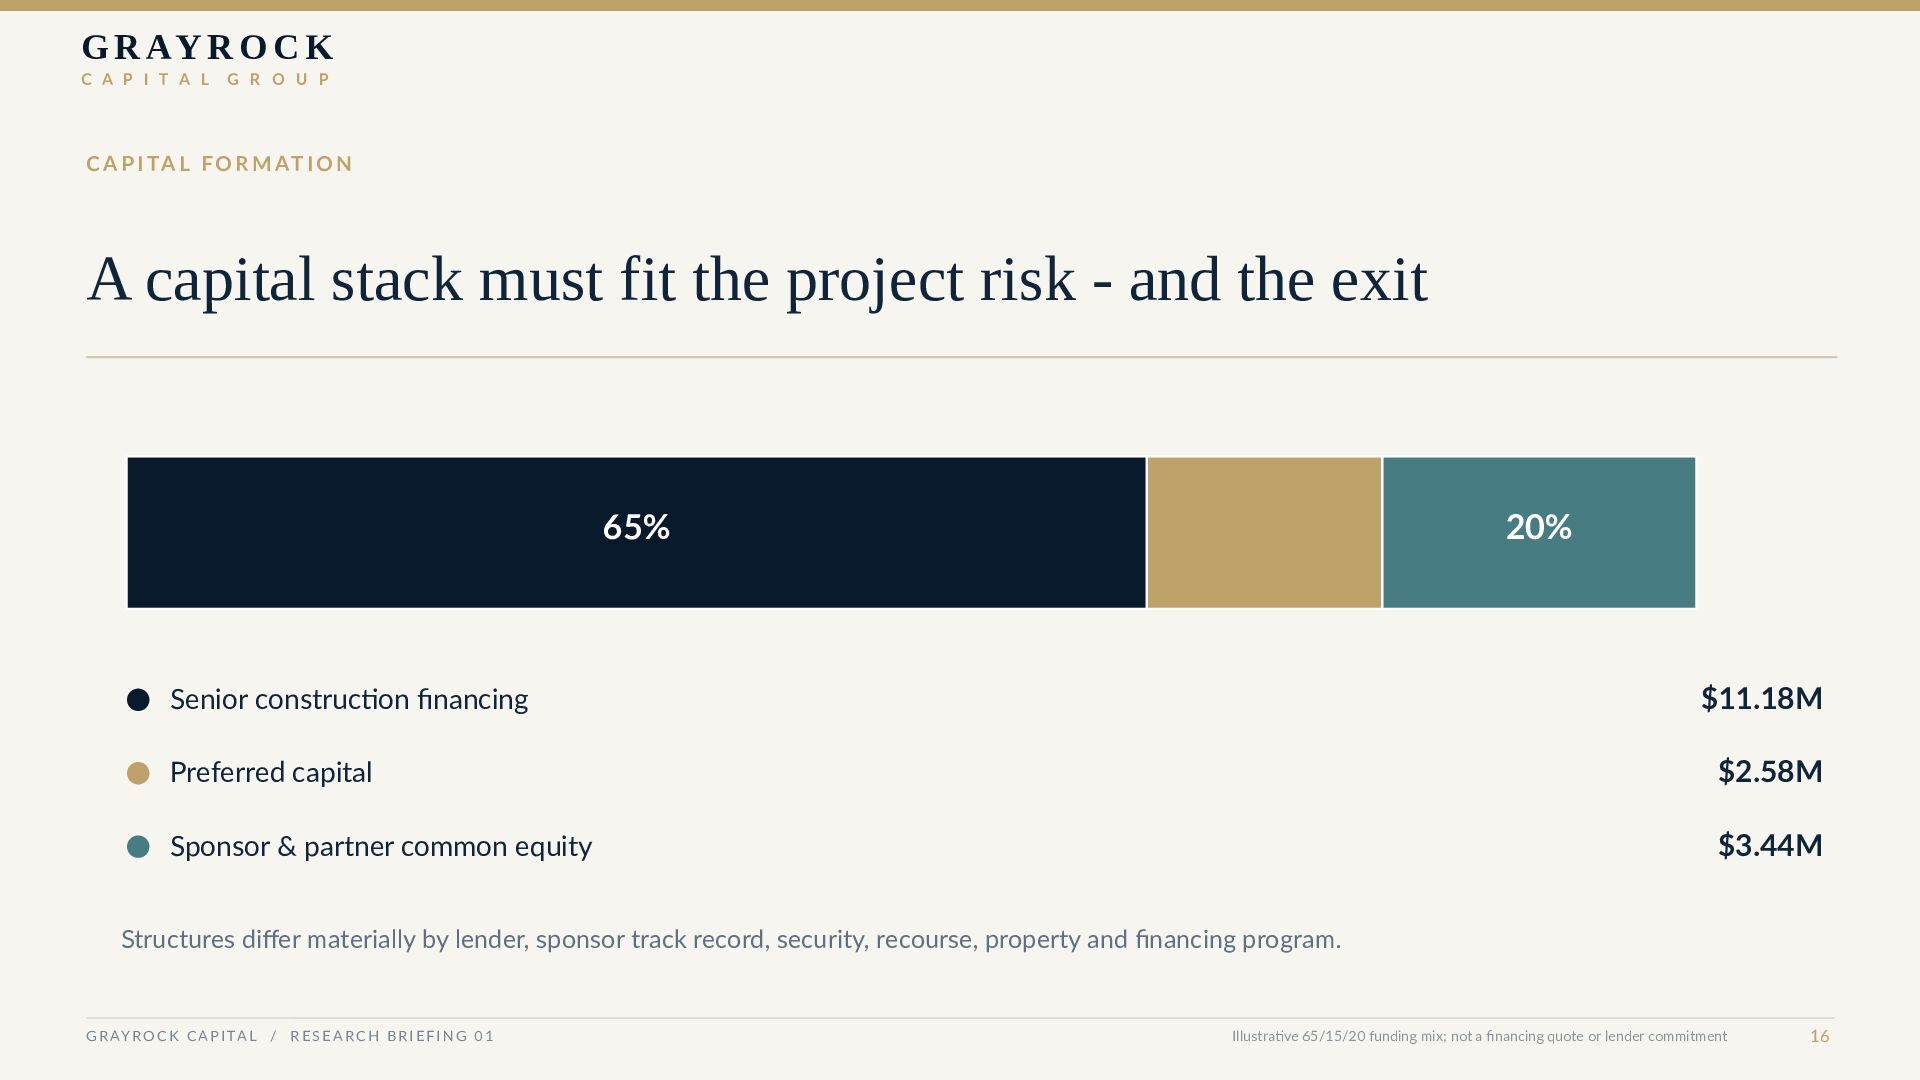
    I T A L G R O U P C A P I TA L F O R M AT I O N A capital stack must fit the project risk - and the exit 65% 20% Senior construction financing $11.18M Preferred capital $2.58M Sponsor & partner common equity $3.44M Structures differ materially by lender, sponsor track record, security, recourse, property and financing program. G R AY R O C K C A P I TA L / R E S E A R C H B R I E F I N G 0 1 Illustrative 65/15/20 funding mix; not a financing quote or lender commitment 16
  17. G R AY R O C K C A P

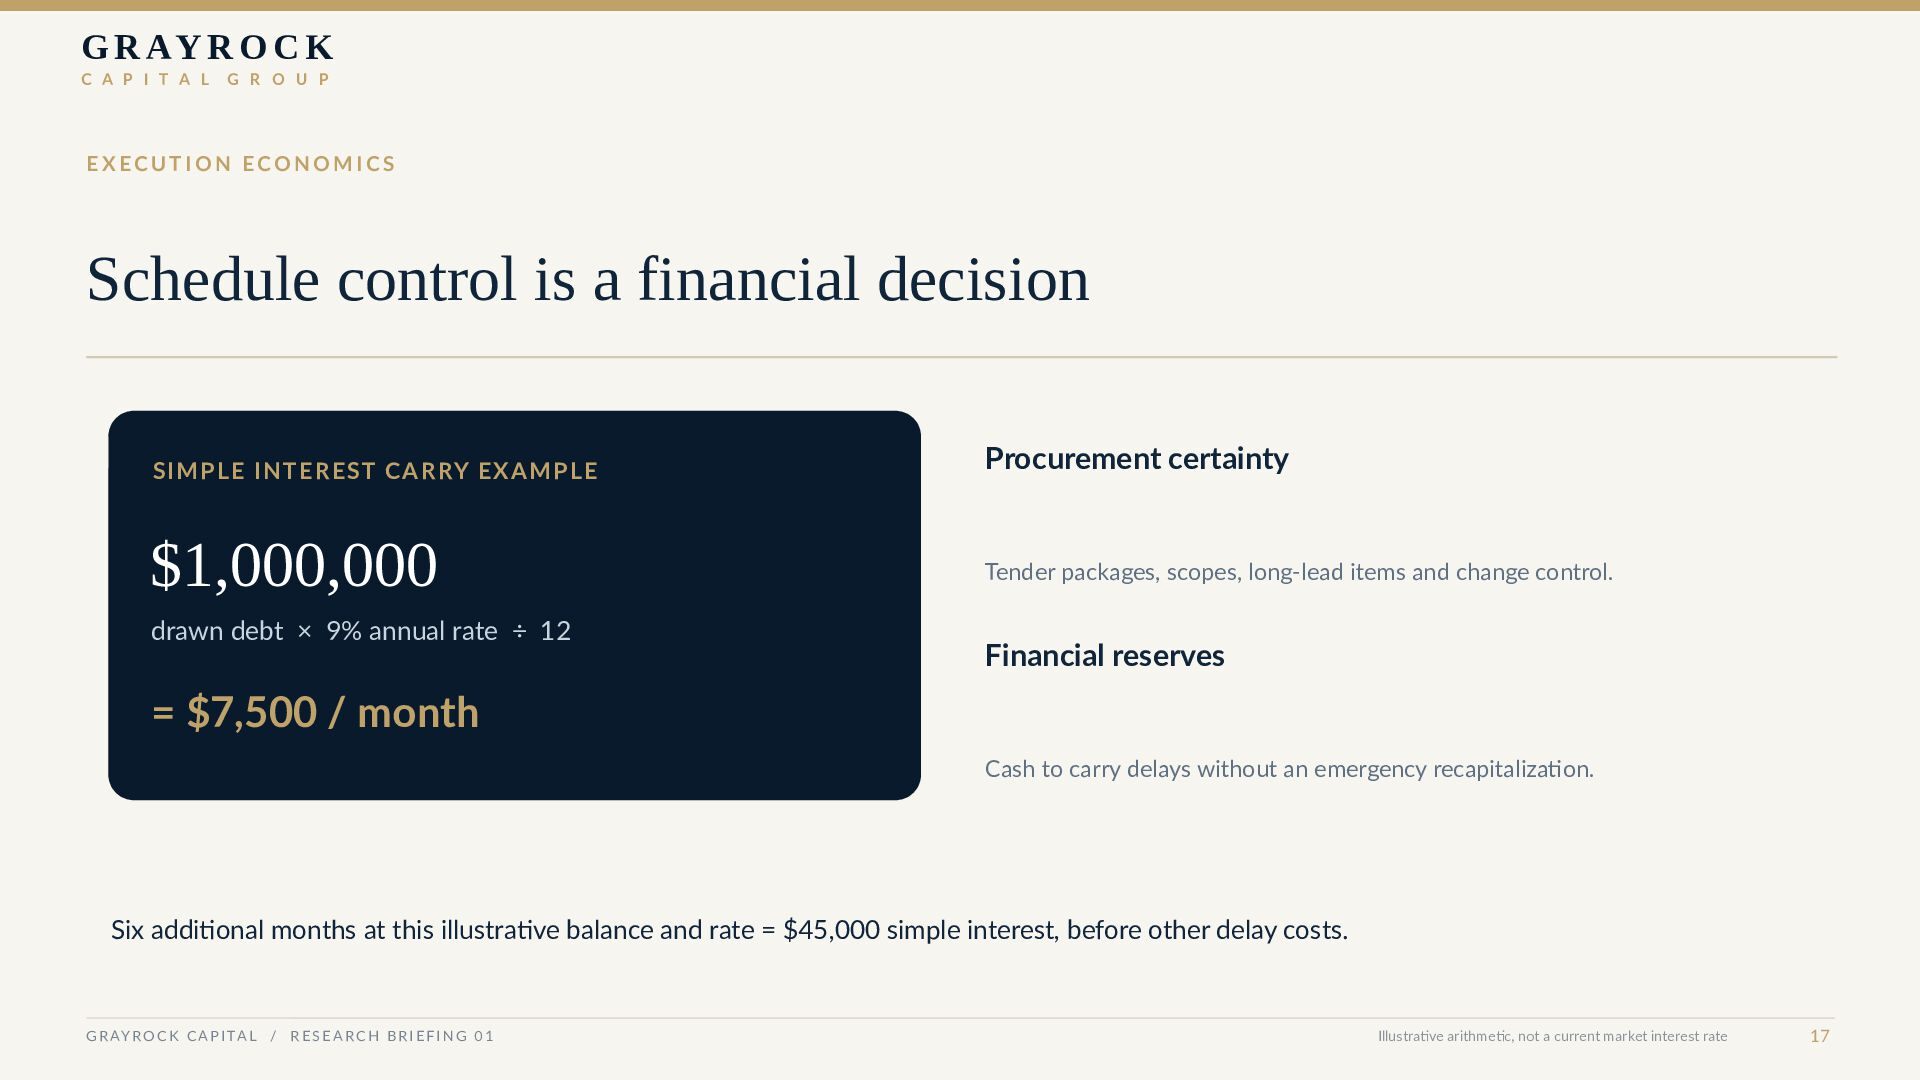
    I T A L G R O U P EXECUTION ECONOMICS Schedule control is a financial decision SIMPLE INTEREST CARRY EXAMPLE $1,000,000 drawn debt × 9% annual rate ÷ 12 Procurement certainty Tender packages, scopes, long-lead items and change control. Financial reserves = $7,500 / month Cash to carry delays without an emergency recapitalization. Six additional months at this illustrative balance and rate = $45,000 simple interest, before other delay costs. G R AY R O C K C A P I TA L / R E S E A R C H B R I E F I N G 0 1 Illustrative arithmetic, not a current market interest rate 17
  18. G R AY R O C K C A P

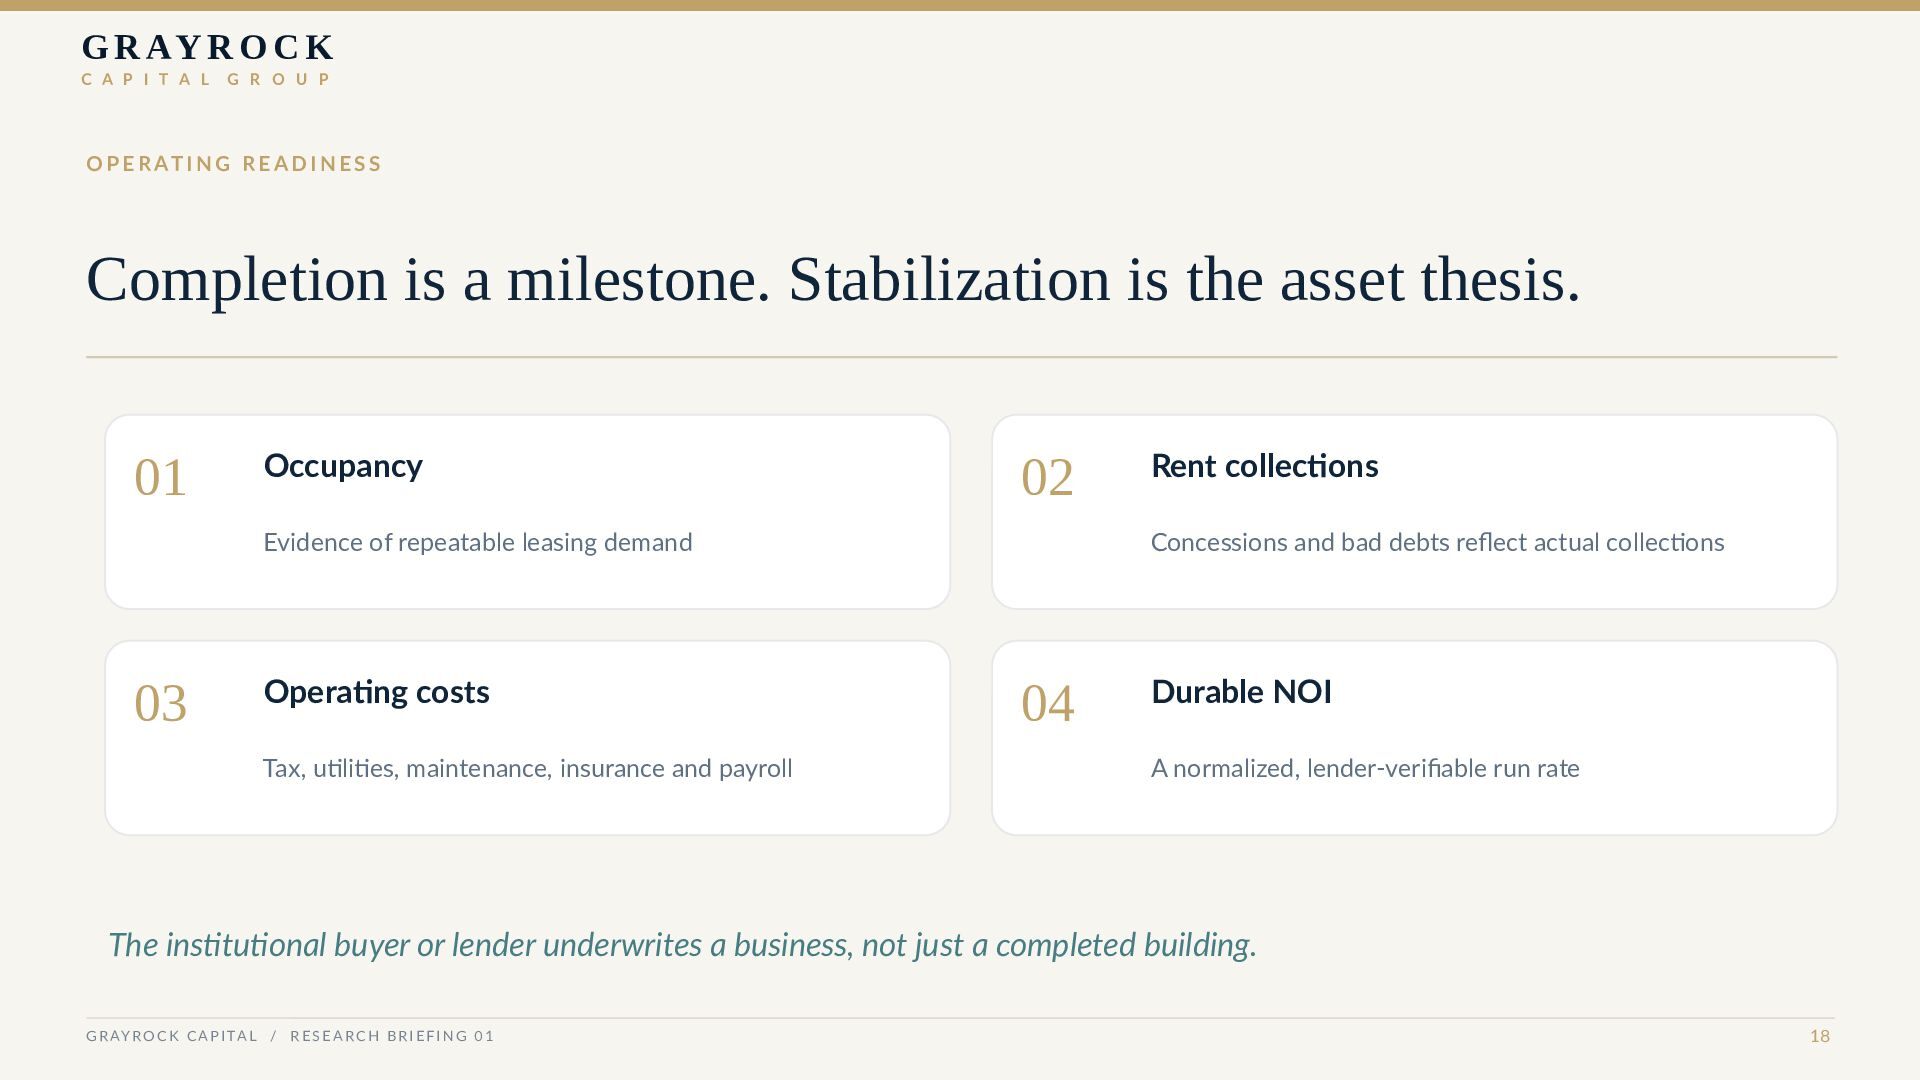
    I T A L G R O U P O P E R AT I N G R E A D I N E S S Completion is a milestone. Stabilization is the asset thesis. 01 Occupancy 02 Evidence of repeatable leasing demand 03 Operating costs Tax, utilities, maintenance, insurance and payroll Rent collections Concessions and bad debts reflect actual collections 04 Durable NOI A normalized, lender-verifiable run rate The institutional buyer or lender underwrites a business, not just a completed building. G R AY R O C K C A P I TA L / R E S E A R C H B R I E F I N G 0 1 18
  19. G R AY R O C K C A P

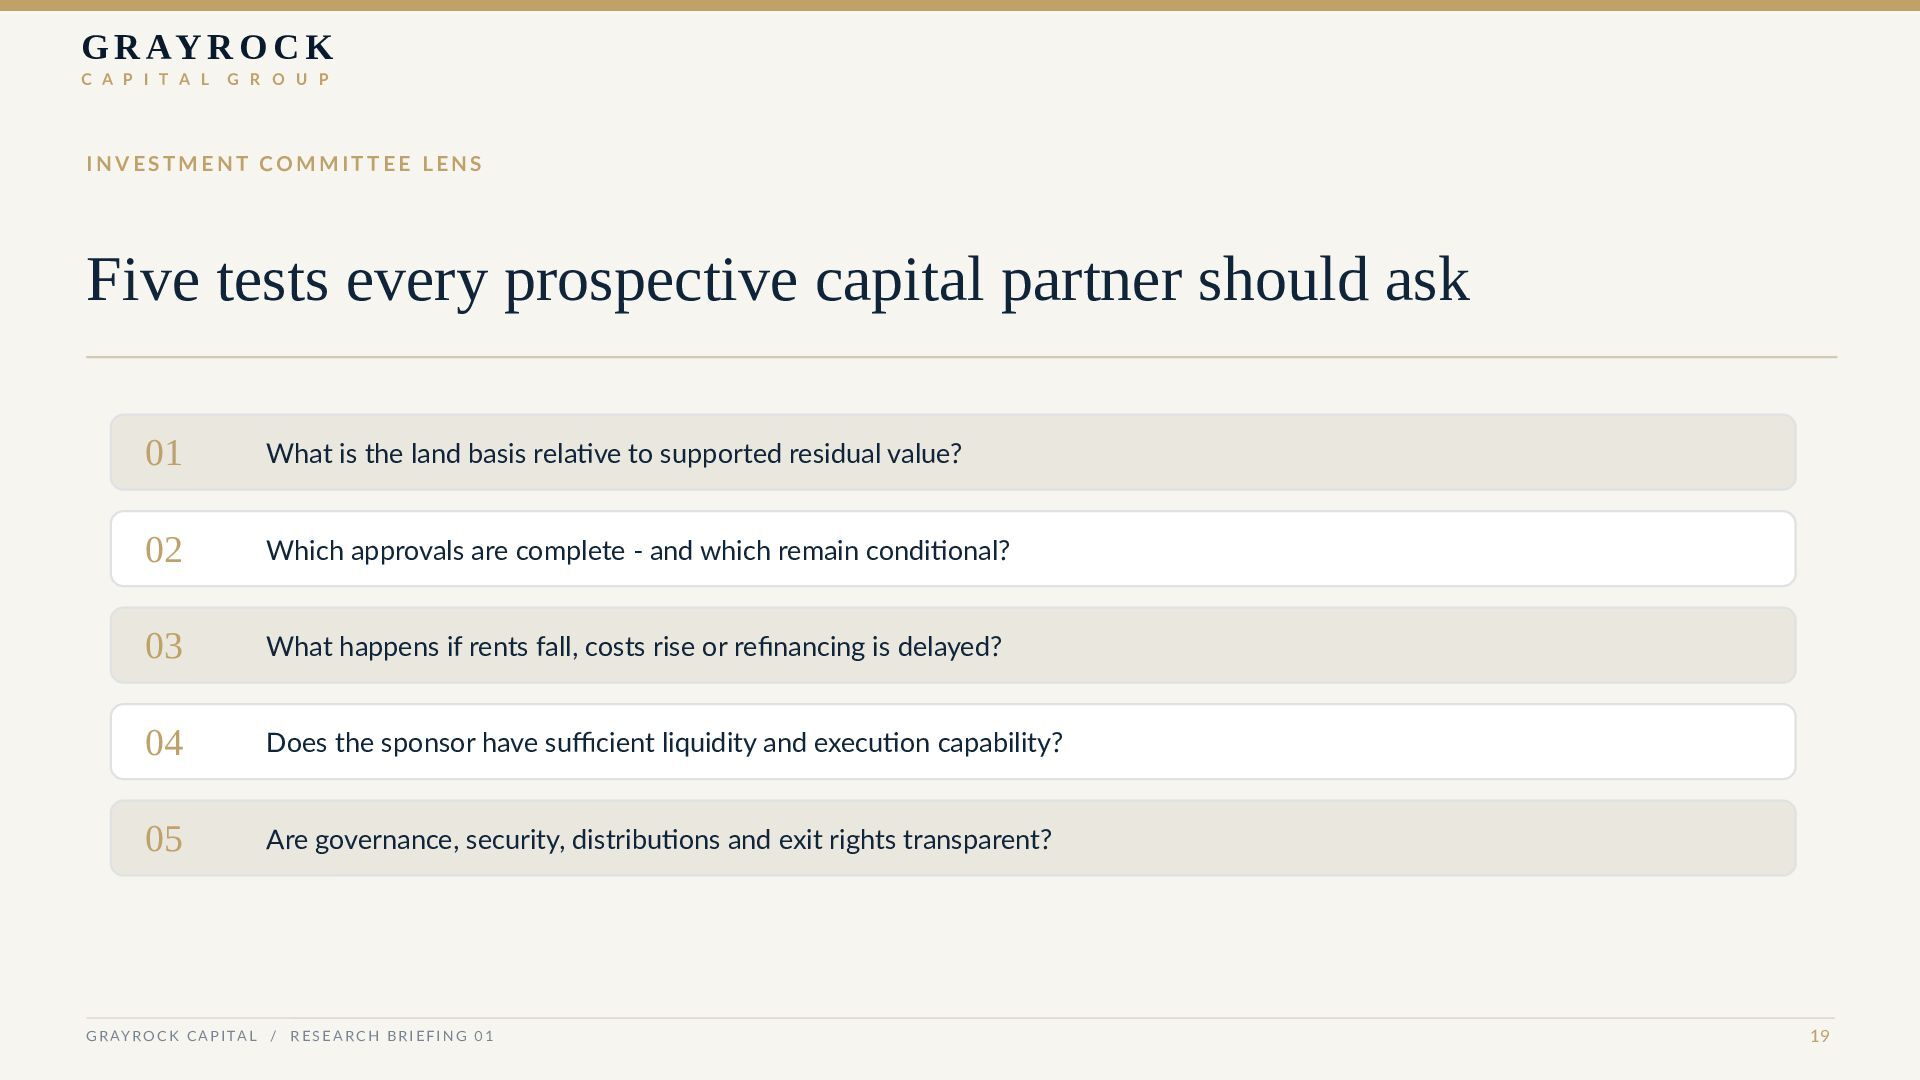
    I T A L G R O U P INVESTMENT COMMITTEE LENS Five tests every prospective capital partner should ask 01 What is the land basis relative to supported residual value? 02 Which approvals are complete - and which remain conditional? 03 What happens if rents fall, costs rise or refinancing is delayed? 04 Does the sponsor have sufficient liquidity and execution capability? 05 Are governance, security, distributions and exit rights transparent? G R AY R O C K C A P I TA L / R E S E A R C H B R I E F I N G 0 1 19
  20. G R AY R O C K C A P

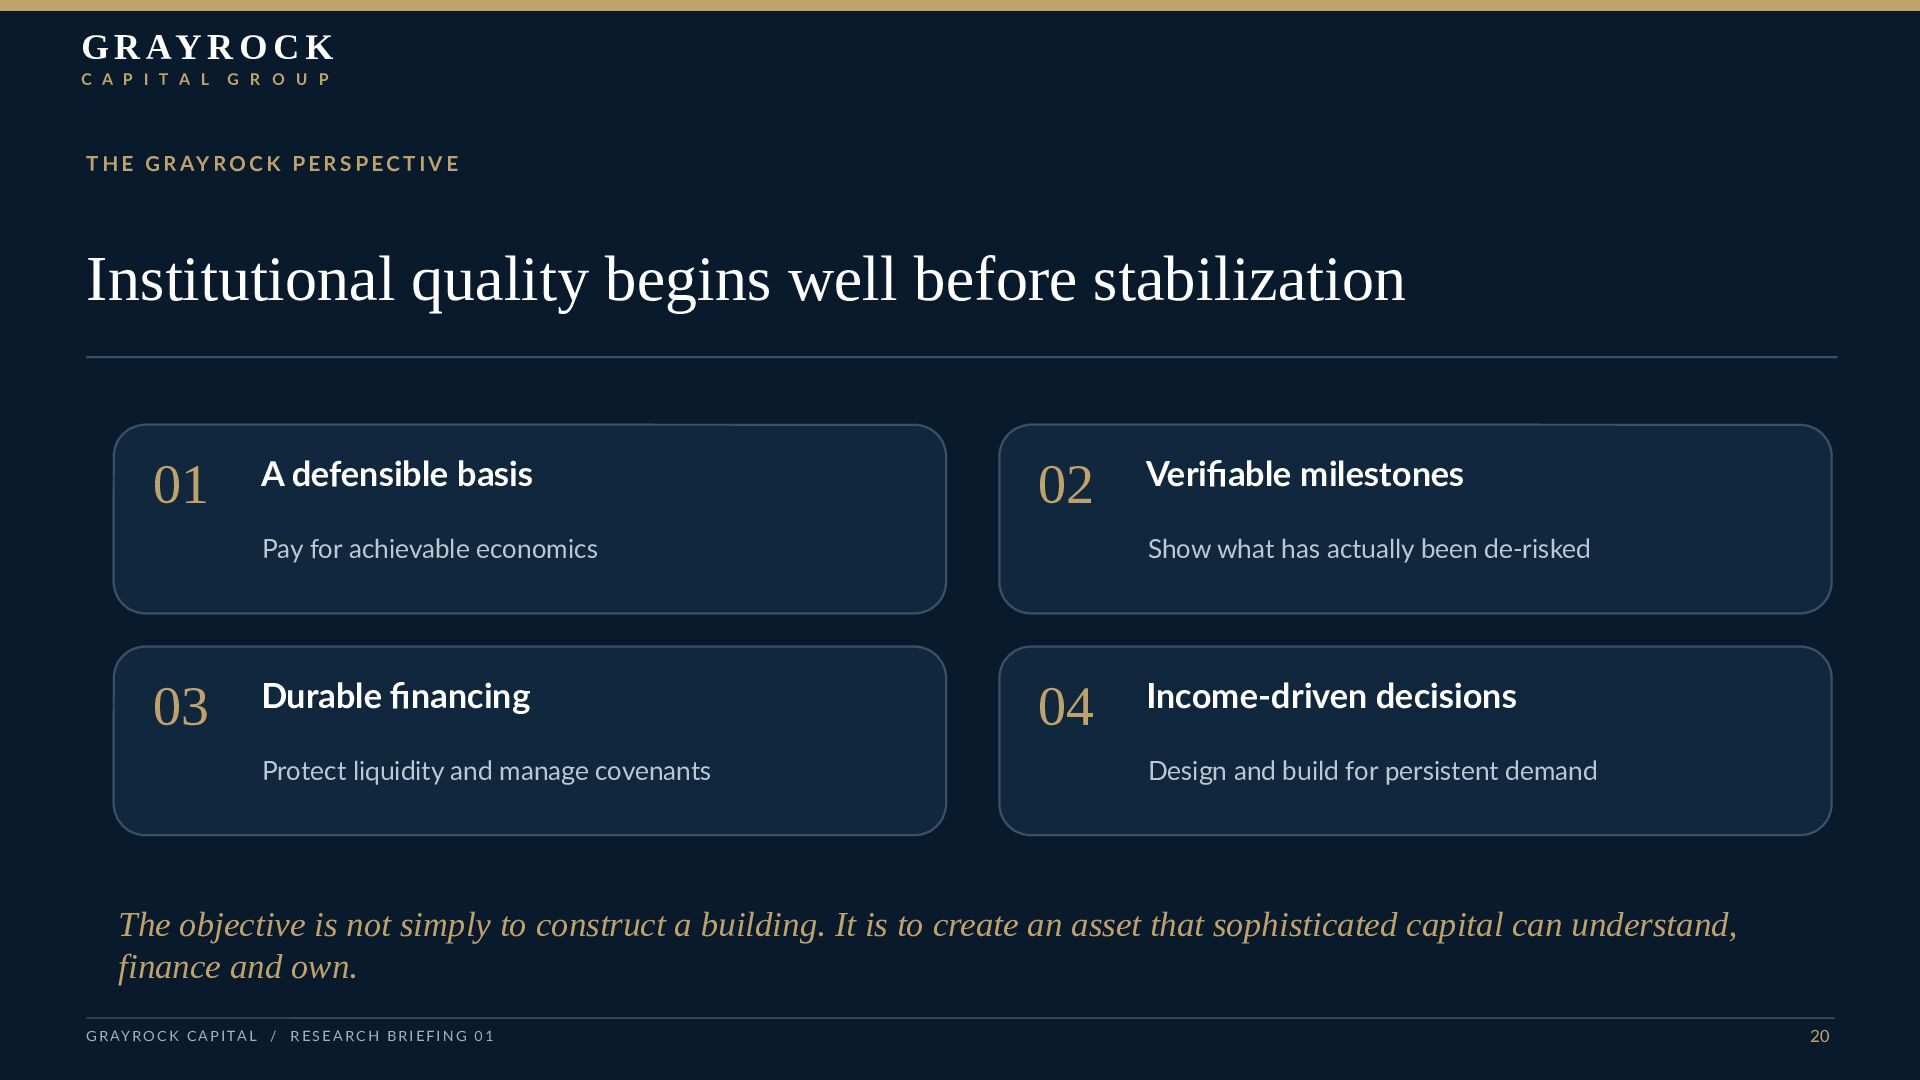
    I T A L G R O U P T H E G R AY R O C K P E R S P E C T I V E Institutional quality begins well before stabilization 01 A defensible basis 02 Pay for achievable economics 03 Durable financing Protect liquidity and manage covenants Verifiable milestones Show what has actually been de-risked 04 Income-driven decisions Design and build for persistent demand The objective is not simply to construct a building. It is to create an asset that sophisticated capital can understand, finance and own. G R AY R O C K C A P I TA L / R E S E A R C H B R I E F I N G 0 1 20
  21. G R AY R O C K C A P

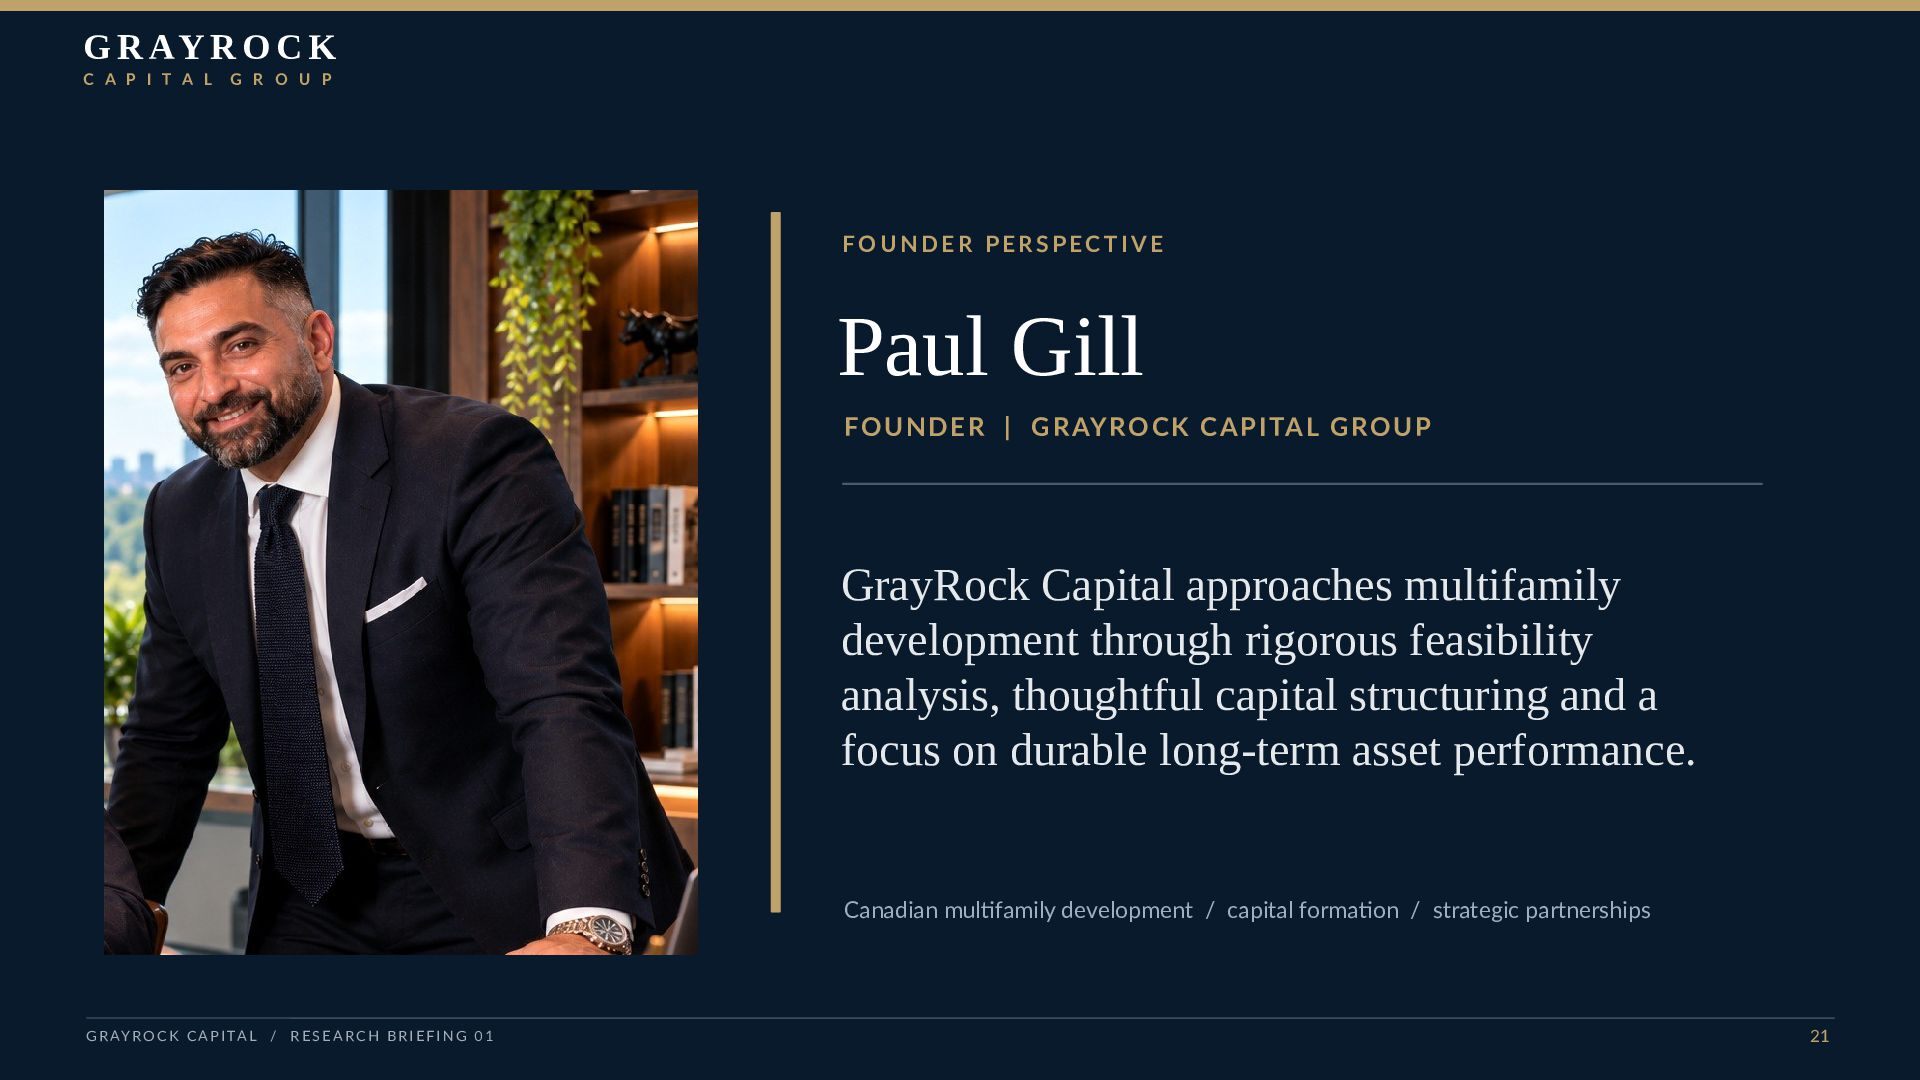
    I T A L G R O U P FOUNDER PERSPECTIVE Paul Gill FO U N D E R | G R AY RO C K C A P I TA L G RO U P GrayRock Capital approaches multifamily development through rigorous feasibility analysis, thoughtful capital structuring and a focus on durable long-term asset performance. Canadian multifamily development / capital formation / strategic partnerships G R AY R O C K C A P I TA L / R E S E A R C H B R I E F I N G 0 1 21
  22. G R AY R O C K C A P

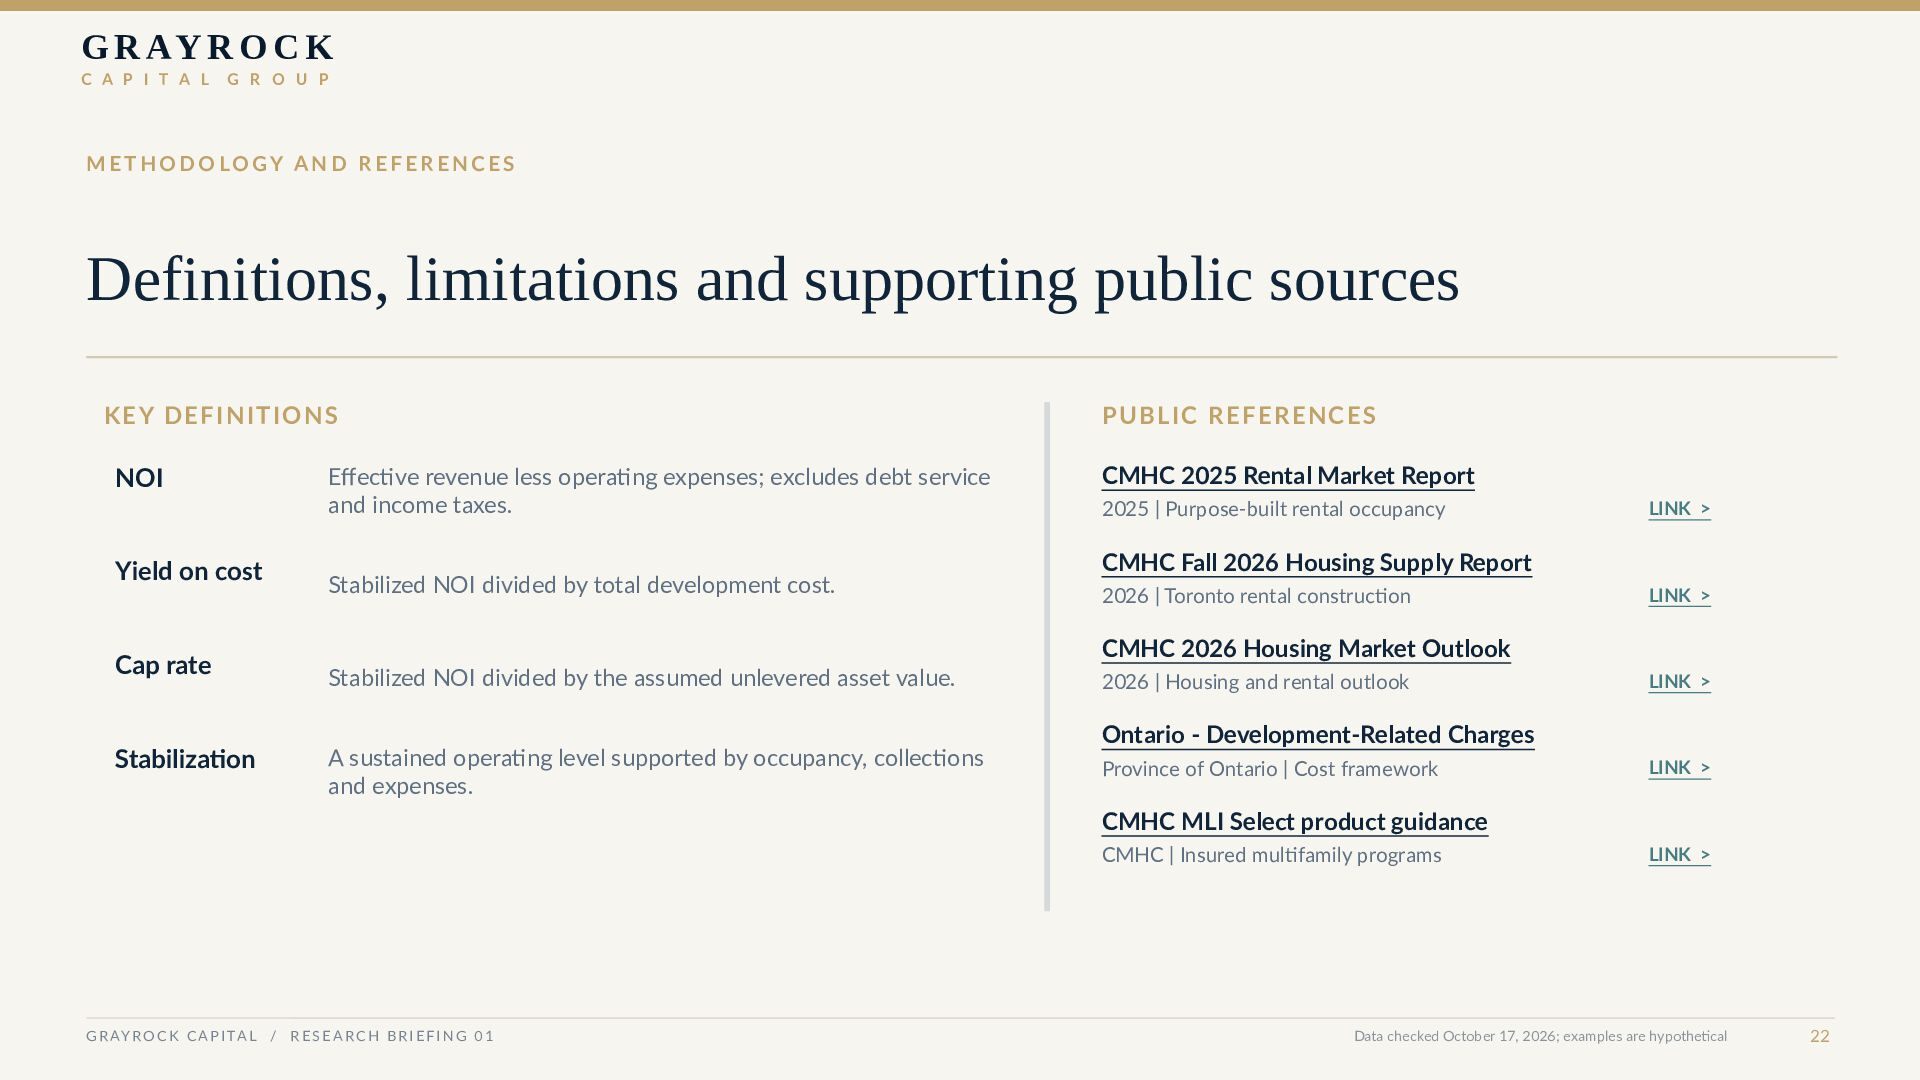
    I T A L G R O U P METHODOLOGY AND REFERENCES Definitions, limitations and supporting public sources KEY DEFIN ITIONS PUBLIC RE FE RENCE S NOI CMHC 2025 Rental Market Report Effective revenue less operating expenses; excludes debt service and income taxes. Yield on cost Stabilized NOI divided by total development cost. Cap rate Stabilized NOI divided by the assumed unlevered asset value. Stabilization 2025 | Purpose-built rental occupancy LINK > CMHC Fall 2026 Housing Supply Report 2026 | Toronto rental construction LINK > CMHC 2026 Housing Market Outlook A sustained operating level supported by occupancy, collections and expenses. 2026 | Housing and rental outlook LINK > Ontario - Development-Related Charges Province of Ontario | Cost framework LINK > CMHC MLI Select product guidance CMHC | Insured multifamily programs G R AY R O C K C A P I TA L / R E S E A R C H B R I E F I N G 0 1 LINK > Data checked October 17, 2026; examples are hypothetical 22
  23. From insight to intelligent partnership. Paul Gill | Founder, GrayRock

    Capital Group www.GrayRockCapital.ca Educational content only. Not an offering, solicitation, investment advice, lender quote or representation of completed results. All illustrative financial figures are fictional and subject to independent due diligence.