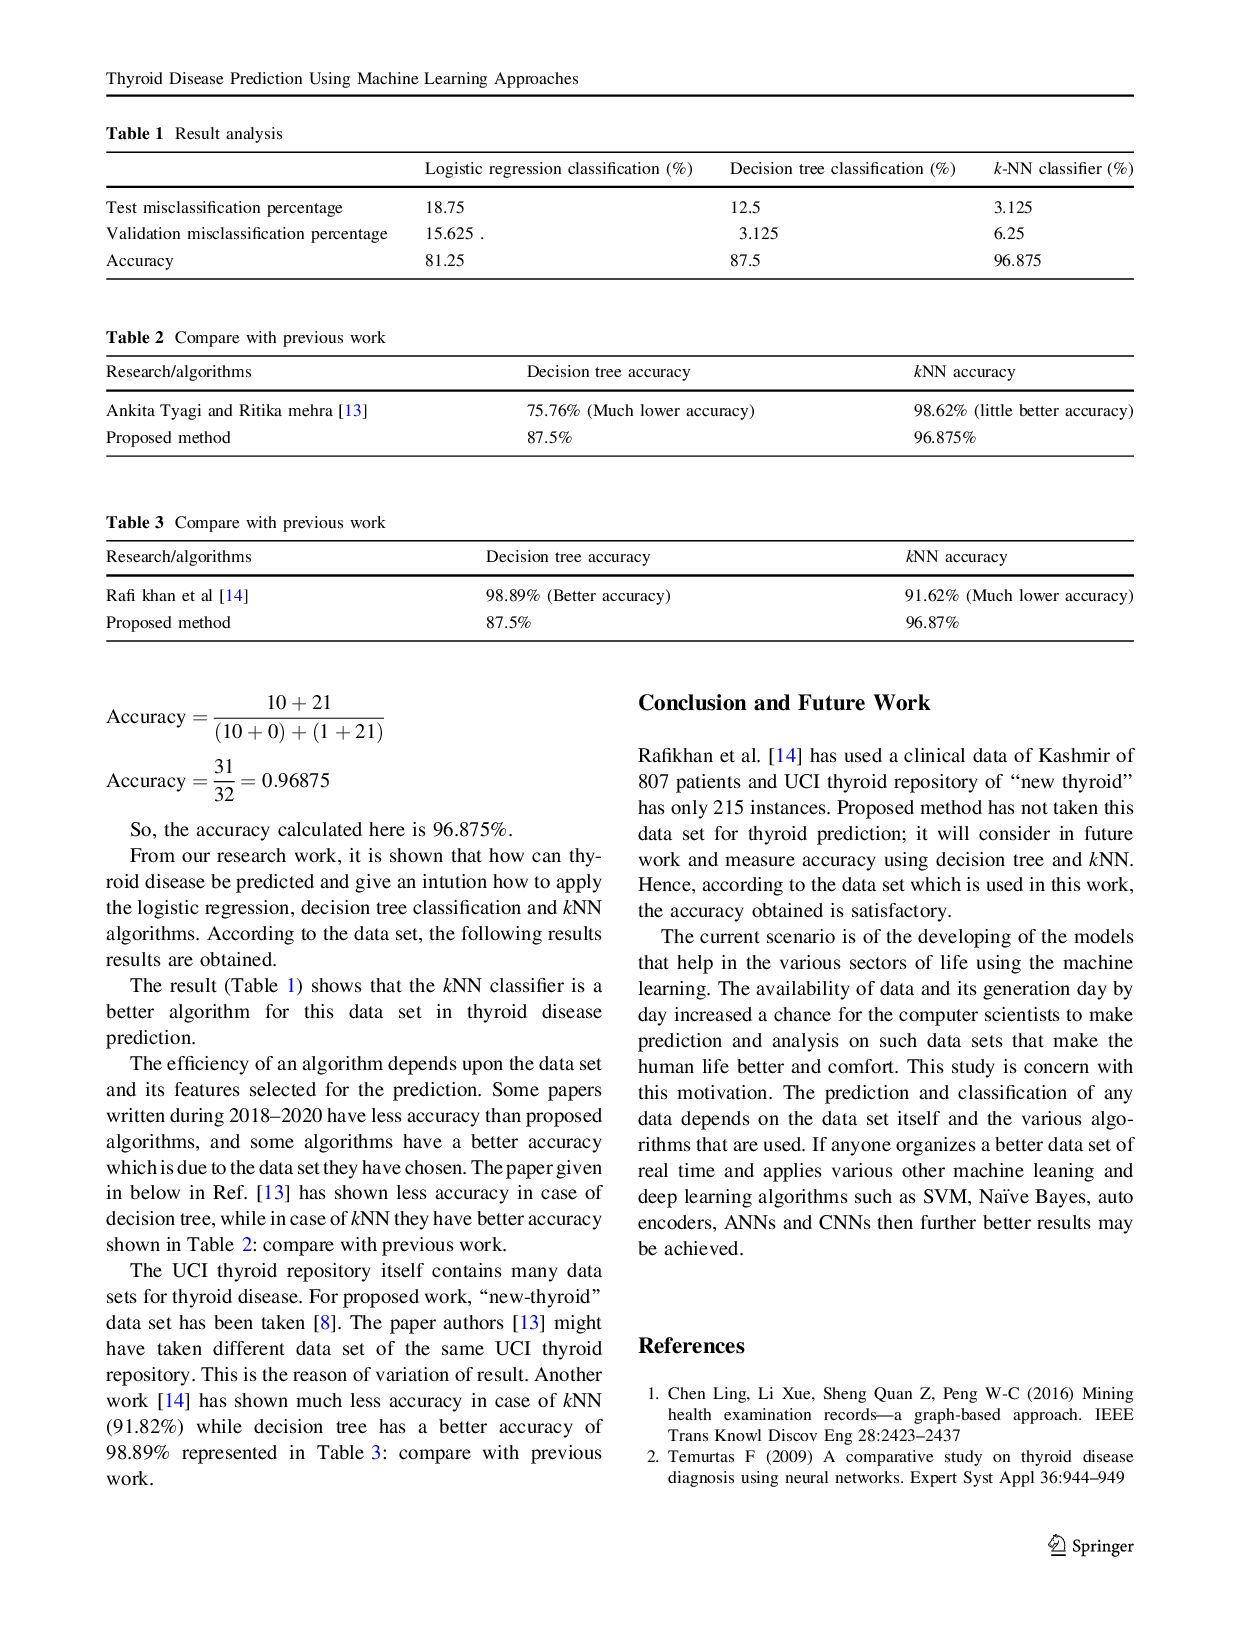
This paper is being written to provide a source of reference for the research scholars who want to work in the area of prediction of thyroid disease. From the different machine learning techniques, compared widely used three algorithms namely logistic regression, decision trees and k-nearest neighbor (kNN) algorithms to predict and evaluate their performance in terms of accuracy. This study has represented the intuition of how to predict the thyroid disease and highlighted how to apply the logistic regression, decision trees and kNN as a tool for the classification. For this, thyroid data set of machine learning repository has used from UC Irvin knowledge discovery in databases archive.