Upgrade to Pro — share decks privately, control downloads, hide ads and more …

Facts Over Opinions: How data beats gut feeling

Facts Over Opinions: How data beats gut feeling

DevOpsCon, Berlin

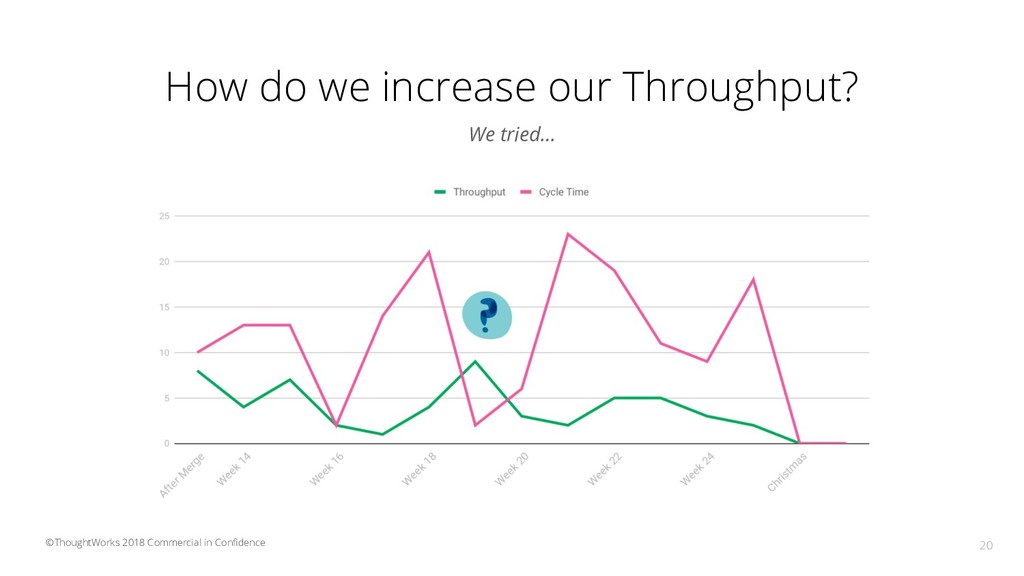
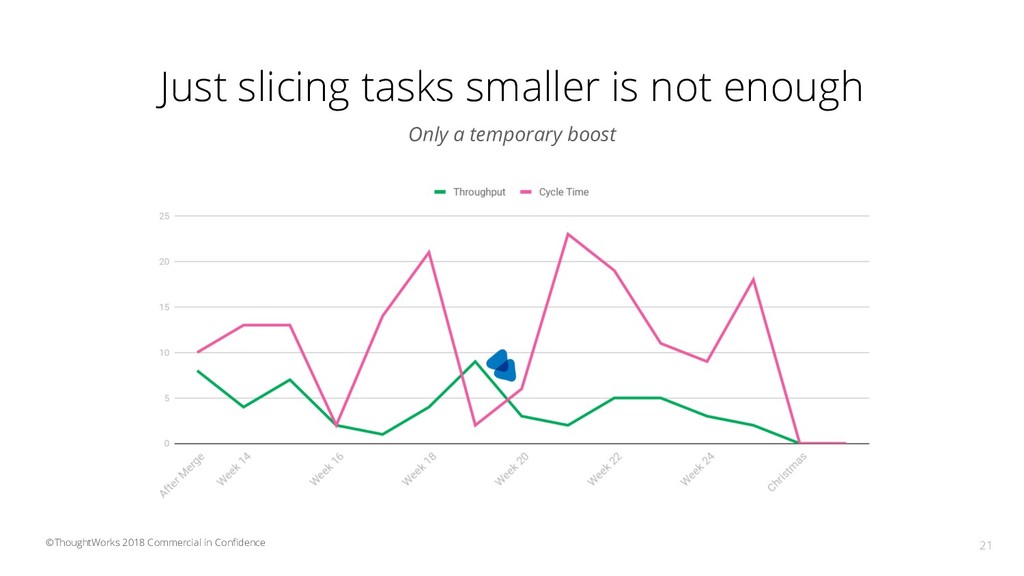
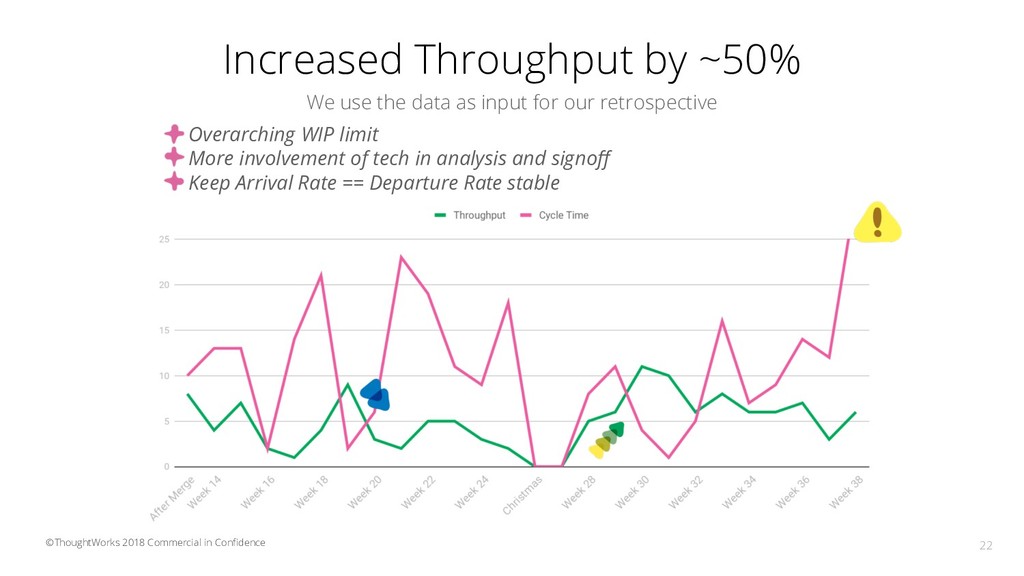
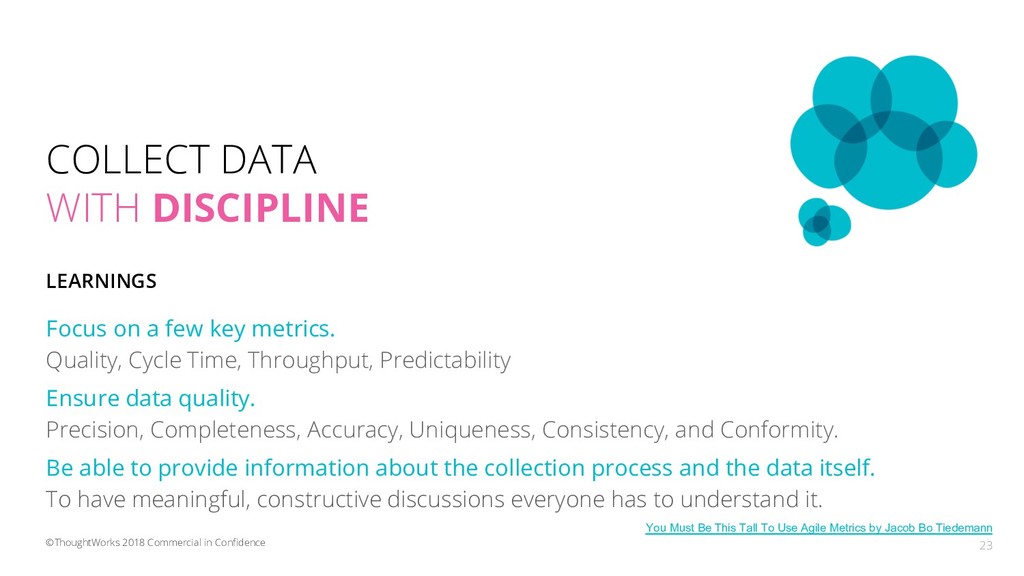
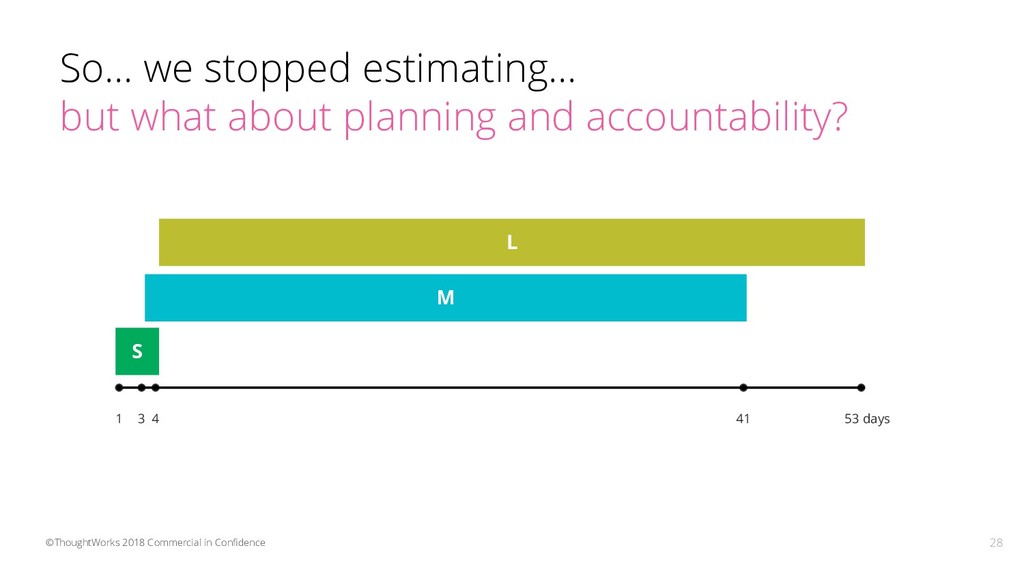
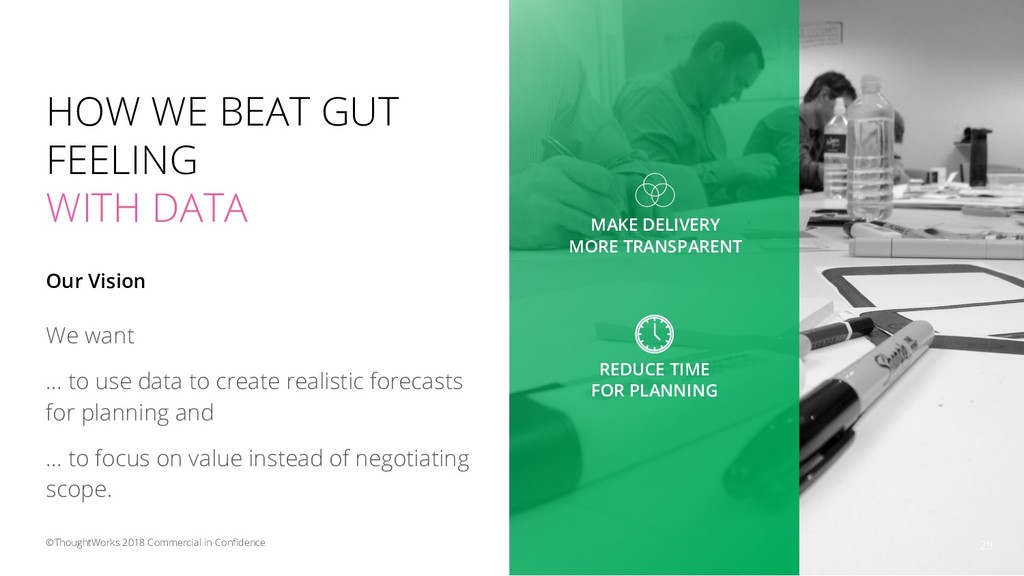
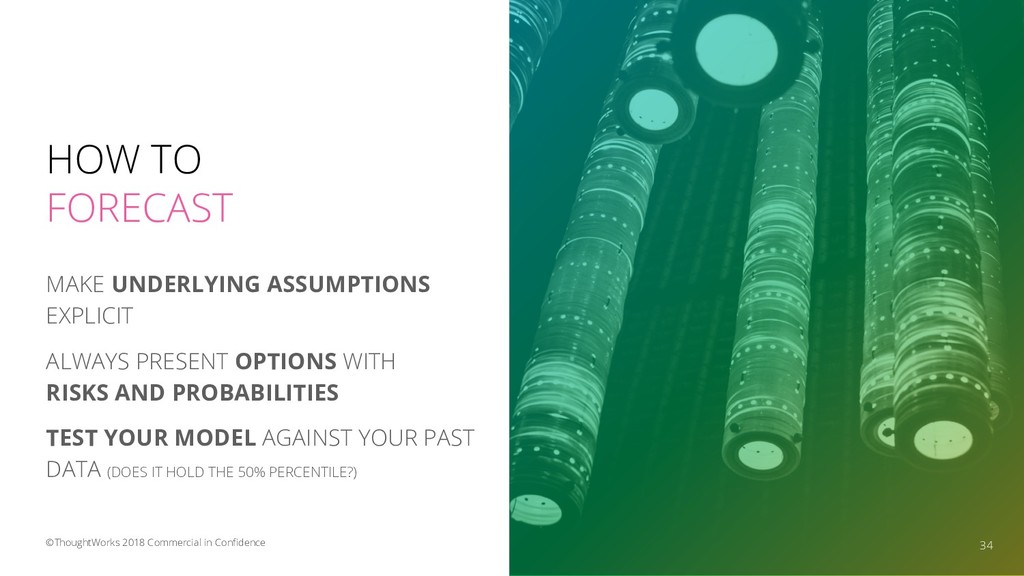
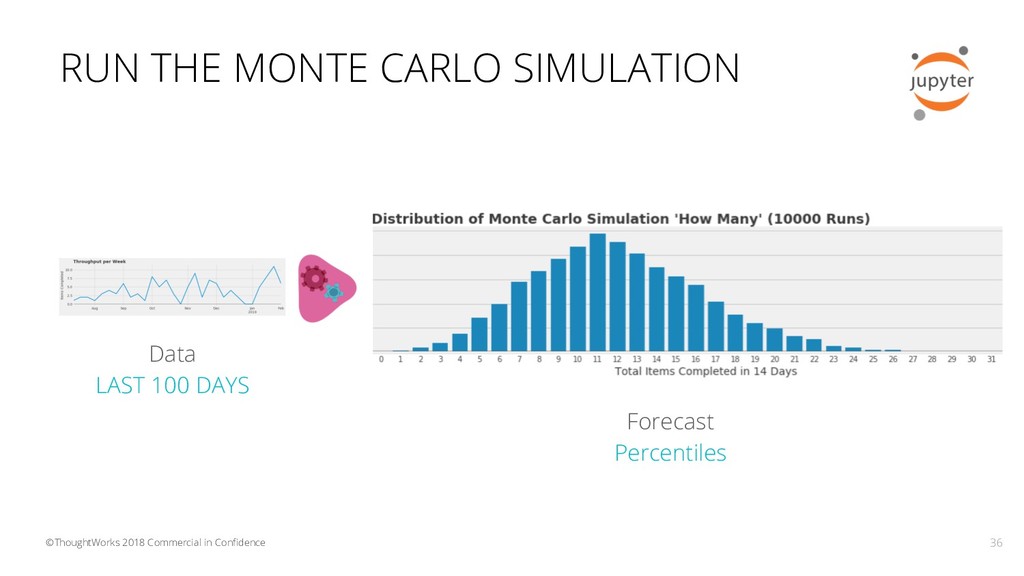
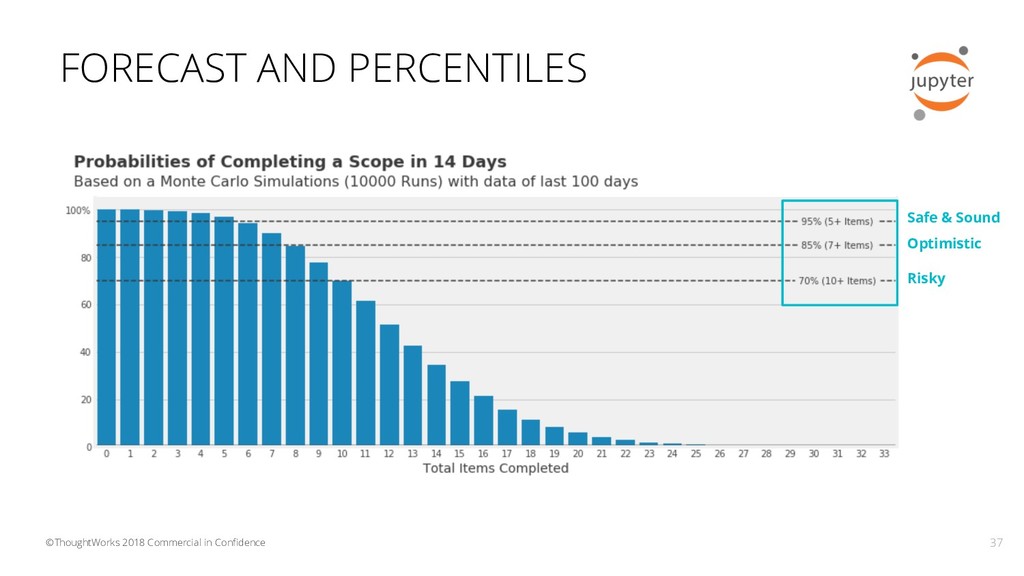
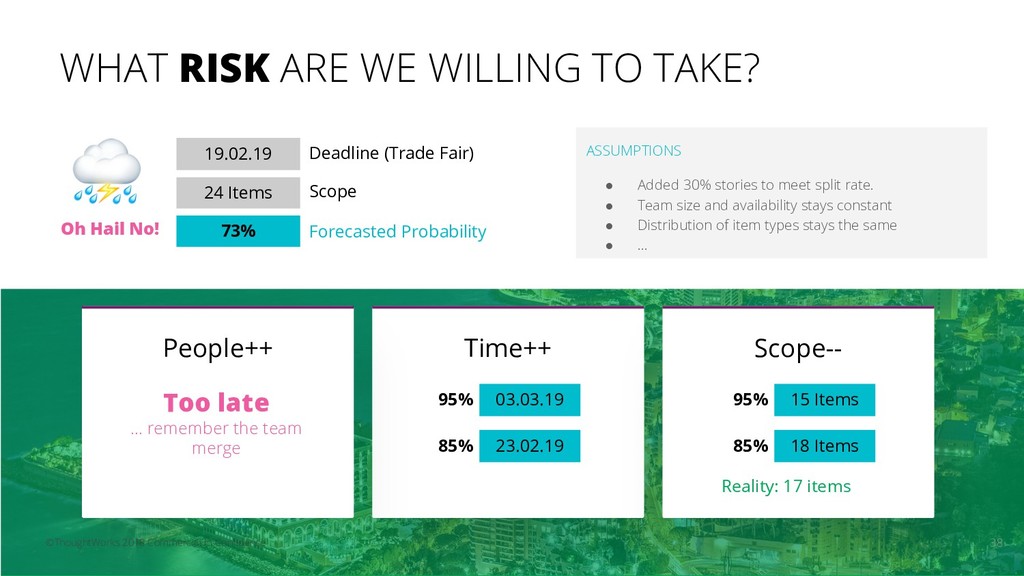
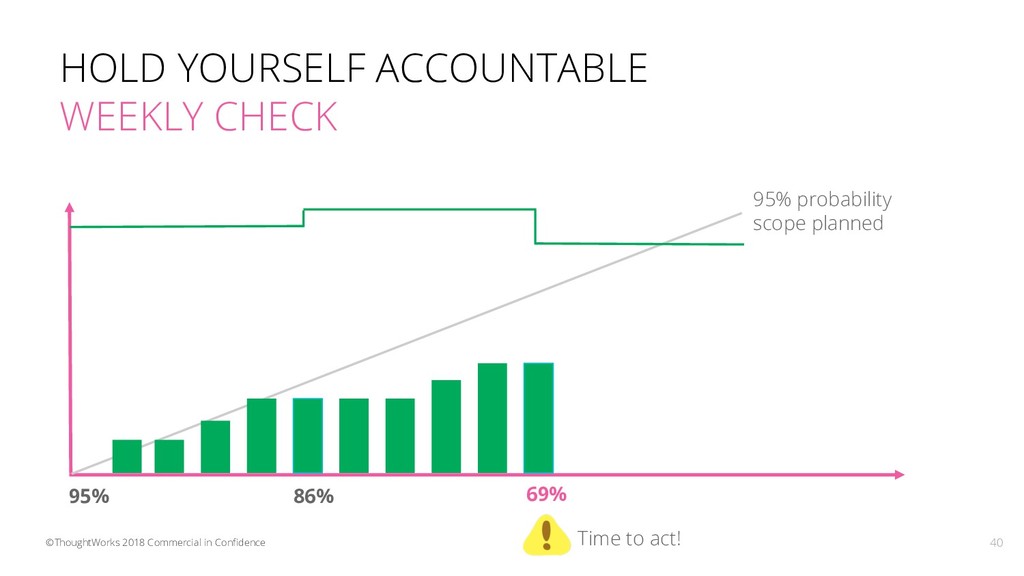
How does your product owner or team make decisions? How is the backlog or roadmap planned? Was your last improvement successful? Many teams rely only on their gut feeling and estimates in story points. Data from existing sources such as JIRA, ticket systems and CI/CD tools are waiting to be evaluated. In this session, I will introduce metrics and KPIs from Agile, Lean and DevOps, and we’ll focus on learning the Build-Measure-Learn Loop. We’ll look at digital and physical methods and tools that incorporate the data into processes and daily work. Using examples and diagrams, I’ll show how this data can be used for more realistic planning and forecasting – and how this data can help the team improve itself.

Jacob Bo Tiedemann

June 12, 2019
Tweet

More Decks by Jacob Bo Tiedemann

Other Decks in Business

Transcript

  1. GLOBAL SOFTWARE CONSULTANCY FACTS OVER OPINIONS How data beats gut

    feeling Jacob Bo Tiedemann, May 2019 1 ©ThoughtWorks 2018 Commercial in Confidence
  2. 2 Hi there That’s me Combining data and empathy for

    best results. Enabling products to create sustainable value. Hamburger. Loves pancakes. Senior Business Analyst Jacob Bo Tiedemann ©ThoughtWorks 2018 Commercial in Confidence GLOBAL SOFTWARE CONSULTANCY @jabopiti
  3. 3 HOW WE USE DATA TO BEAT OUR GUT FEELING

    OUR JOURNEY FROM ESTIMATES TO #NOESTIMATES ESTIMATES HIGH UNCERTAINTY LAME ©ThoughtWorks 2018 Commercial in Confidence
  4. UNCERTAINTY MAKES OUR PLANNING DIFFICULT AND TIME CONSUMING Photo by

    Giora Morein @gioramorein 4 ©ThoughtWorks 2018 Commercial in Confidence You know nothing, Jacob ❄
  5. ©ThoughtWorks 2018 Commercial in Confidence “Nobody noticed. Five Story Points…

    over years. I've never estimated anything else.” - Andi, Developer (Name changed by the editor or maybe not ) 6
  6. “Tasks that complete faster than estimated have no way to

    compensate for the tasks that take much longer than estimated.” - Erik Bernhardsson @fulhack 8 ©ThoughtWorks 2018 Commercial in Confidence Source: Why Software Projects Take Longer Than You Think - A Statistical Model
  7. Median Mean 99% Percentile Task A (σ = 0.5) 1.00

    1.13 3.20 Task B (σ = 0.5) 1.00 1.13 3.20 Task C (σ = 0.5) 1.00 1.13 3.20 Task D (σ = 1) 1.00 1.65 3.20 Task E (σ = 1) 1.00 1.65 10.24 Task F (σ = 1) 1.00 1.65 10.24 Task G (σ = 2) 1.00 7.39 104.87 SUM WEEKS 9.74 15.71 112.65 “One single misbehaving task basically ends up dominating the calculation, at least for the 99% case.” - Erik Bernhardsson @fulhack 10 ©ThoughtWorks 2018 Commercial in Confidence Source: Why Software Projects Take Longer Than You Think - A Statistical Model
  8. ARE OUR IMPROVEMENT MEASURES TAKING EFFECT? OUR OTHER PROBLEM 11

    ©ThoughtWorks 2018 Commercial in Confidence
  9. REDUCE TIME FOR PLANNING MAKE DELIVERY MORE TRANSPARENT IMPROVE OUR

    FLOW HOW WE BEAT GUT FEELING WITH DATA We want to use data to... … continuously improve our planning and team. … and to hold ourselves accountable. … focus on generating value. Our Vision 13 ©ThoughtWorks 2018 Commercial in Confidence
  10. Start Simple What data tells us that we perform and

    deliver value? ID Type Task 14 ©ThoughtWorks 2018 Commercial in Confidence in T-Shirt sizes (or any other type) Estimates Daily-based status changes Start & Completion Date
  11. HOW TO COLLECT & ANALYSE DATA TOOLS 16 ©ThoughtWorks 2018

    Commercial in Confidence Further interesting data to collect Tasks in Backlog Split Rate Arrival Rate WIP Collect & Extract Analyze jira-to-analytics
  12. We successfully identify small tasks! Comparison of estimation and cycle

    time 17 ©ThoughtWorks 2018 Commercial in Confidence S 3 4 53 days 1 41 M L
  13. ©ThoughtWorks 2018 Commercial in Confidence Our baseline after five weeks

    What happens now if we merge with another team? Start 18
  14. ©ThoughtWorks 2018 Commercial in Confidence Start Done (on paper) Stable

    team The impact of the team merger on our performance 19
  15. Just slicing tasks smaller is not enough 21 Only a

    temporary boost ©ThoughtWorks 2018 Commercial in Confidence
  16. Increased Throughput by ~50% We use the data as input

    for our retrospective 22 Overarching WIP limit More involvement of tech in analysis and signoff Keep Arrival Rate == Departure Rate stable ©ThoughtWorks 2018 Commercial in Confidence
  17. COLLECT DATA WITH DISCIPLINE 23 Focus on a few key

    metrics. Quality, Cycle Time, Throughput, Predictability Ensure data quality. Precision, Completeness, Accuracy, Uniqueness, Consistency, and Conformity. Be able to provide information about the collection process and the data itself. To have meaningful, constructive discussions everyone has to understand it. LEARNINGS ©ThoughtWorks 2018 Commercial in Confidence You Must Be This Tall To Use Agile Metrics by Jacob Bo Tiedemann
  18. ©ThoughtWorks 2018 Commercial in Confidence “You get what you measure.

    Metrics will affect actions and decisions. They can be counterproductive and fail when metrics are not balanced or are ill-considered” - Jacob Bo Tiedemann, @jabopiti 24
  19. ©ThoughtWorks 2018 Commercial in Confidence “Remember, with great power comes

    great responsibility.” - Uncle Ben, Spider-Man 26
  20. USE METRICS WITH A SENSE OF RESPONSIBILITY 27 Focus on

    trends rather than single data points. Track team or system metrics, not personal metrics. Keep the metrics clean of ratings. Else they are just a lever to drive someone’s behaviour. Ask the team to share data with others. Don’t start the blame game! Don’t stop thinking. Don’t let the data make decisions. LEARNINGS ©ThoughtWorks 2018 Commercial in Confidence
  21. So… we stopped estimating... but what about planning and accountability?

    28 ©ThoughtWorks 2018 Commercial in Confidence S 3 4 53 days 1 41 M L
  22. REDUCE TIME FOR PLANNING MAKE DELIVERY MORE TRANSPARENT HOW WE

    BEAT GUT FEELING WITH DATA We want … to use data to create realistic forecasts for planning and … to focus on value instead of negotiating scope. Our Vision 29 ©ThoughtWorks 2018 Commercial in Confidence
  23. WHAT WE COULD LOSE THREATS Missing discussion about tasks. Feeling

    of paternalism & loss of control. Misinterpretation & misuse of forecasts and plans. 30 ©ThoughtWorks 2018 Commercial in Confidence
  24. ©ThoughtWorks 2018 Commercial in Confidence MONTE CARLO SIMULATION “Given your

    alternatives are guessing, even a simple model will perform better.” 32
  25. HOW TO FORECAST MAKE UNDERLYING ASSUMPTIONS EXPLICIT ALWAYS PRESENT OPTIONS

    WITH RISKS AND PROBABILITIES TEST YOUR MODEL AGAINST YOUR PAST DATA (DOES IT HOLD THE 50% PERCENTILE?) 34 ©ThoughtWorks 2018 Commercial in Confidence
  26. RUN THE MONTE CARLO SIMULATION Data LAST 100 DAYS 36

    ©ThoughtWorks 2018 Commercial in Confidence Forecast Percentiles
  27. WHAT RISK ARE WE WILLING TO TAKE? 38 ©ThoughtWorks 2018

    Commercial in Confidence 24 Items Deadline (Trade Fair) 19.02.19 Scope Forecasted Probability 73% ASSUMPTIONS • Added 30% stories to meet split rate. • Team size and availability stays constant • Distribution of item types stays the same • ... Oh Hail No! Time++ 95% 85% 03.03.19 23.02.19 Scope-- 95% 85% 15 Items 18 Items People++ Too late … remember the team merge Reality: 17 items ⛈
  28. ©ThoughtWorks 2018 Commercial in Confidence 39 Dashboard 70% 85% 95%

    Current Scope 56 days 47 days 40 days 28 days 20 days 14 days 53 days 43 days 35 days PRIORITY USE RISK TO PRIORITIZE Instead of all-or-nothing negotiations Filter Detailview 24 Tasks 8 Tasks 22 Tasks Forecast 16.02 - 03.03. 02.03. - 16.03. 06.04. - 24.04. Forecasted delivery with this priority
  29. HOLD YOURSELF ACCOUNTABLE WEEKLY CHECK 40 ©ThoughtWorks 2018 Commercial in

    Confidence 95% probability scope planned 95% 86% 69% Time to act!
  30. OUR LEARNINGS IT WORKS (for us)! But… … we dedicated

    extra time to discuss tasks (still less time than estimating). … it took some time to get into the topic. OUR PLANNING BECAME MORE REALISTIC 42 ©ThoughtWorks 2018 Commercial in Confidence
  31. STILL CHALLENGING What we are doing now… … improving predictability.

    Be consistent again. … improving our forecast model (split rates, arrival rate, …) … improving our cycle time. 43 ©ThoughtWorks 2018 Commercial in Confidence SOME ASSUMPTIONS HAVE BEEN INVALIDATED
  32. HOW TO QUICK START METRICS AND FORECASTS Collect data with

    discipline Get the data quality up Collect minimum data by hand Get the team on board Team Dashboard Excel by Troy Magennis Monte Carlo Simulation Notebook By Jacob Bo Tiedemann Use free Excel sheets & Jupyter Notebooks Downloadable Package by Matt Philipp Play the #NoEstimates Game 44 ©ThoughtWorks 2018 Commercial in Confidence
  33. THANKS! I REALLY APPRECIATE QUESTIONS AND FEEDBACK (also via mail

    or Twitter) JACOB BO TIEDEMANN SENIOR CONSULTANT BUSINESS ANALYST @jabopiti | [email protected] | thoughtworks.com 45 ©ThoughtWorks 2018 Commercial in Confidence
  34. FURTHER READINGS & RESOURCES 46 ©ThoughtWorks 2018 Commercial in Confidence

    Reading & Exploration You must be this tall to use agile metrics #NoEstimates game Whole bunch of articles about metrics in Agile teams Book: #NoEstimates: How to Measure Project Progress Without Estimating Book: Actionable Agile Metrics For Predictability Book: Making Work Visible Book: Accelerate - The Science of Lean Software and DevOps: Building and Scaling High Performing Technology Organizations Book: How to measure anything Tools Actionable Agile Jira-to-analytics Kanban Monte Carlo Simulation (Jupyter Notebook) Team Dashboard
  35. “Any instinctual exercise is subject to any number of cognitive

    biases.” - Dan North, @tastapod Your judgments are influenced by what springs most easily to mind. Availability Heuristic The first thing you judge influences your judgment of all that follows. Anchoring You allow yourself to be unduly influenced by context and delivery. Framing Effect 47 ©ThoughtWorks 2018 Commercial in Confidence Content source: yourbias.is
  36. LITTLE’S LAW 1. The average output or departure rate (Throughput)

    should equal the average input or arrival rate (λ). 2. All work that is started will eventually be completed and exit the system. 3. The amount of WIP should be roughly the same at the beginning and at the end of the time interval chosen for the calculation. 4. The average age of the WIP is neither growing nor declining. 5. The calculation must be performed using consistent units. 48 IS BASED ON THE LAW ‘ARRIVAL RATE OF A SYSTEM’ OF THE QUEUING THEORY. FIVE CONDITIONS MUST EXIST IN ORDER FOR THE LAW TO BE VALID ©ThoughtWorks 2018 Commercial in Confidence If WIP increases faster than Throughput, then Cycle Times will only increase. NO MENTION OF... … EQUAL SIZE OF WORK IS NOT A CONDITION … CHARACTERISTIC STATISTICAL DISTRIBUTION OF ARRIVAL OR DEPARTURE RATE Source D. VACANTI, B. VALLET