Upgrade to Pro — share decks privately, control downloads, hide ads and more …

Facts Over Opinions - Wie Daten das Bauchgefühl schlagen

Facts Over Opinions - Wie Daten das Bauchgefühl schlagen

JAX Conference, Mainz

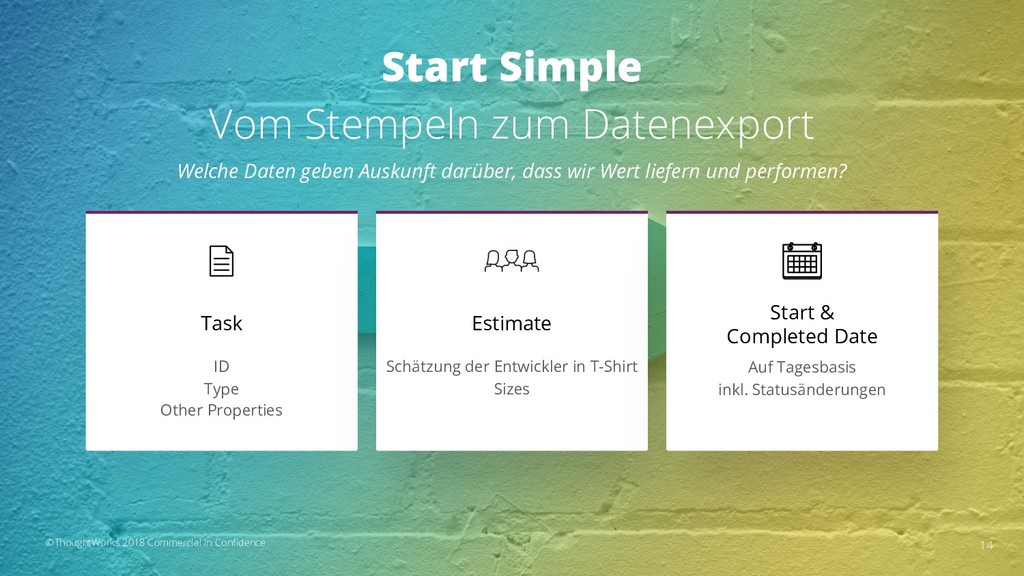
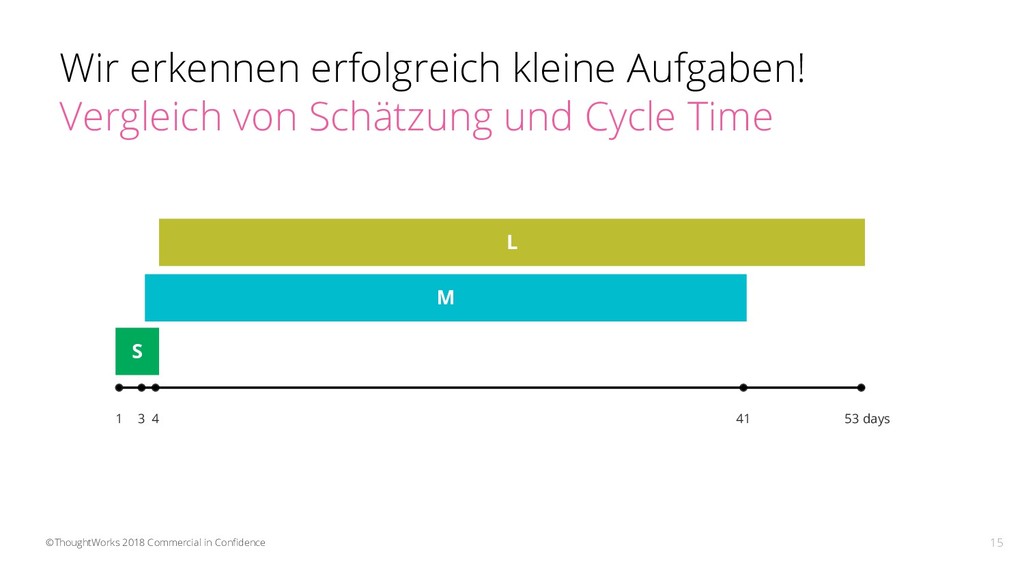
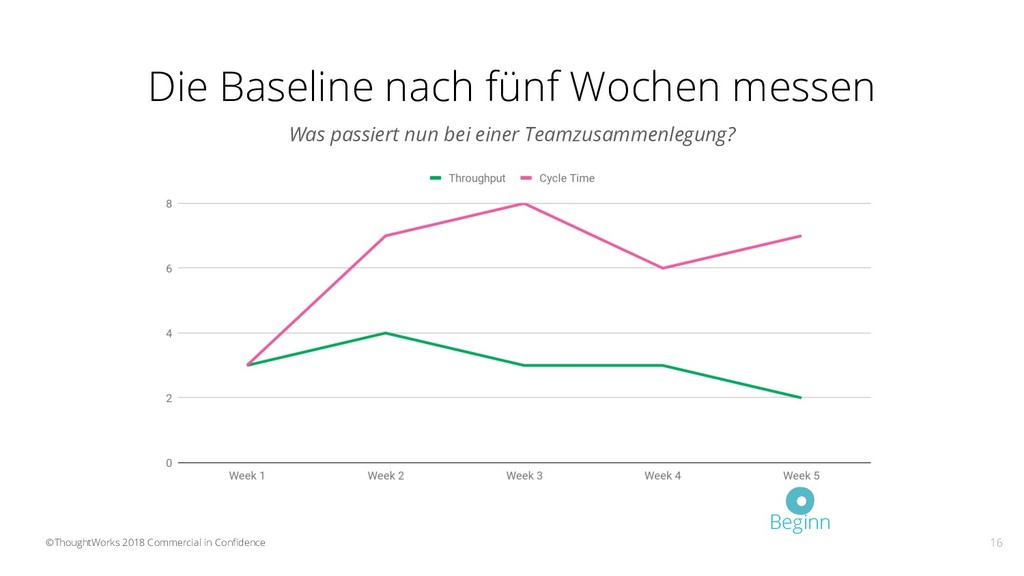
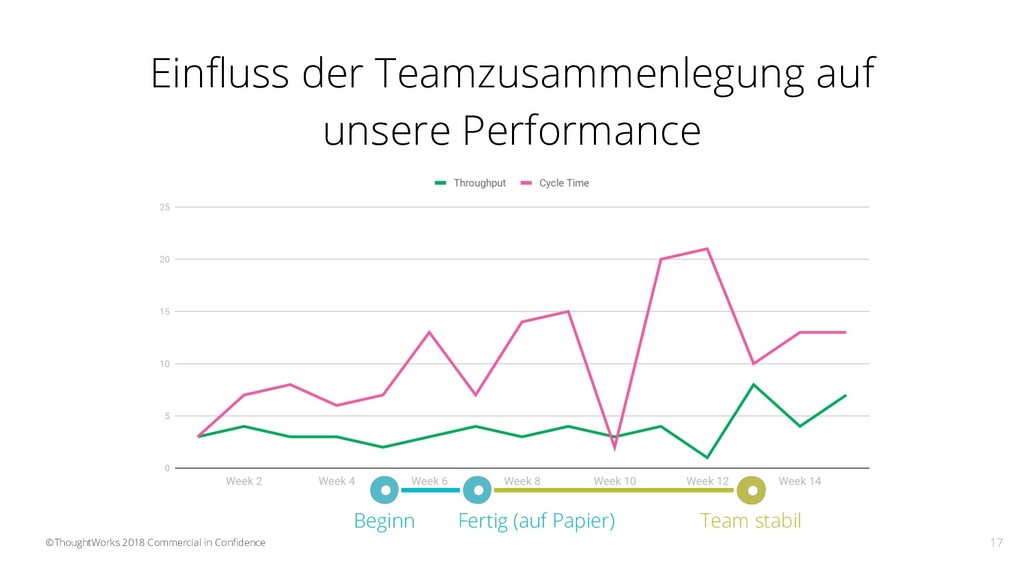
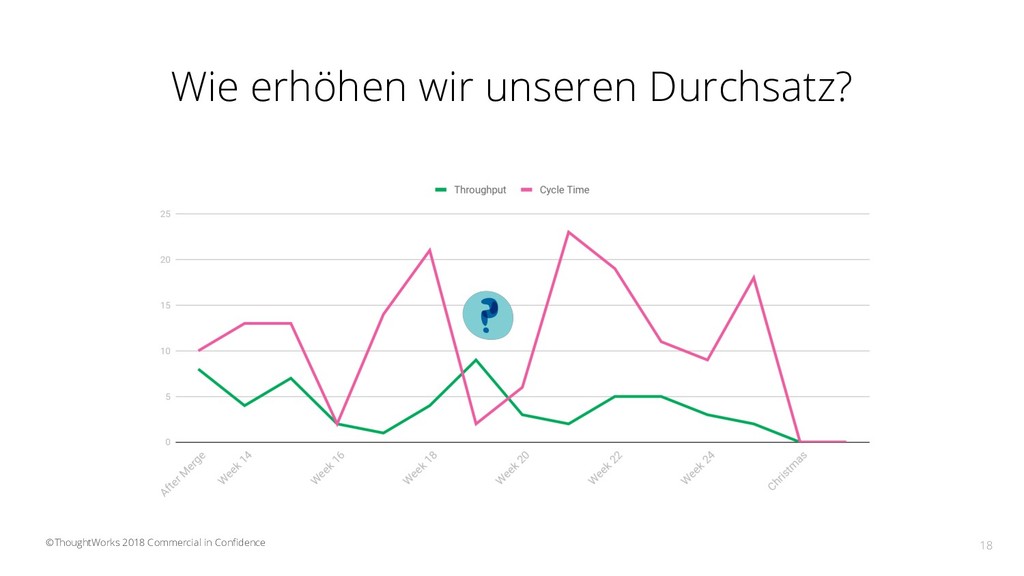
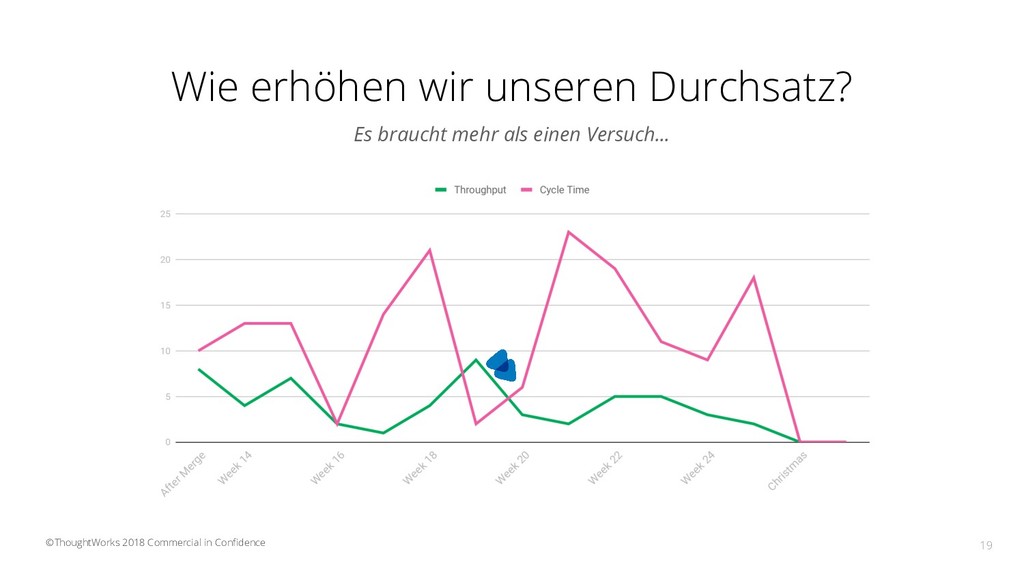
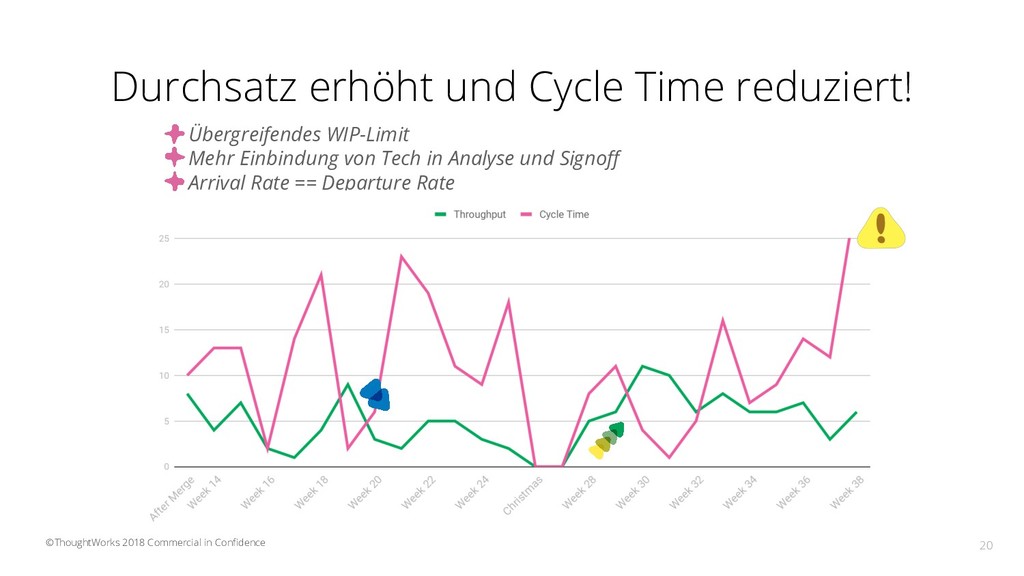
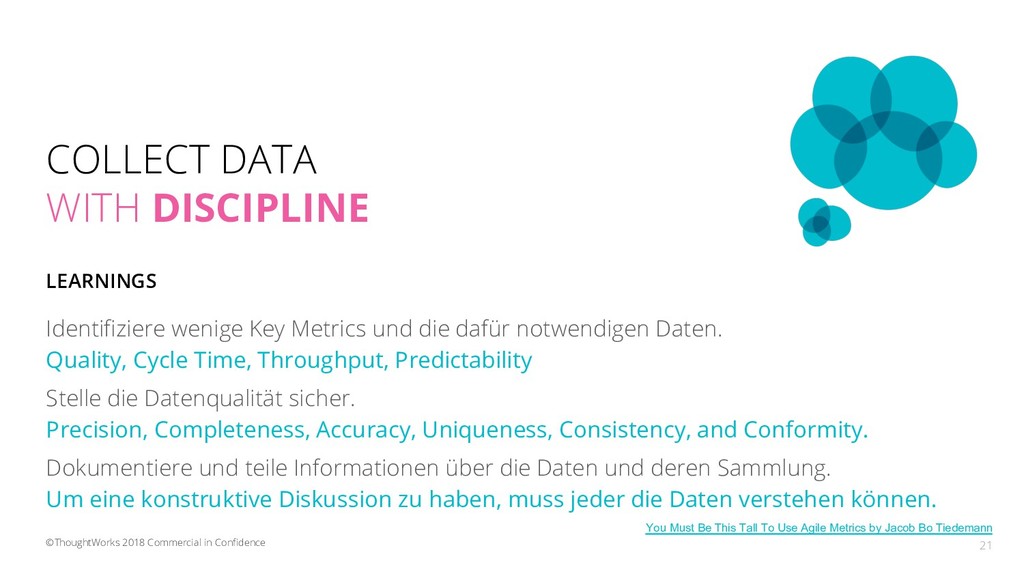
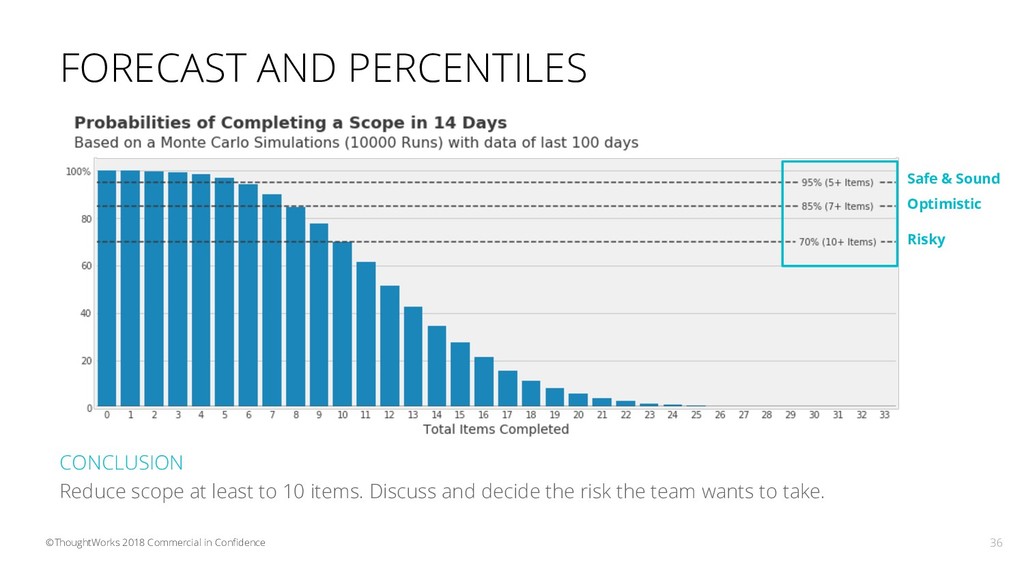
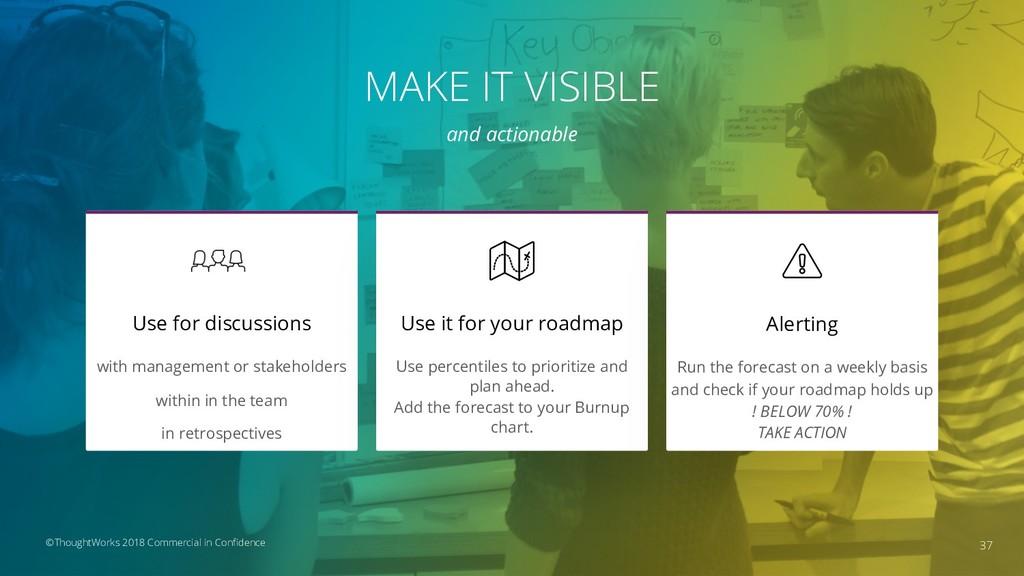
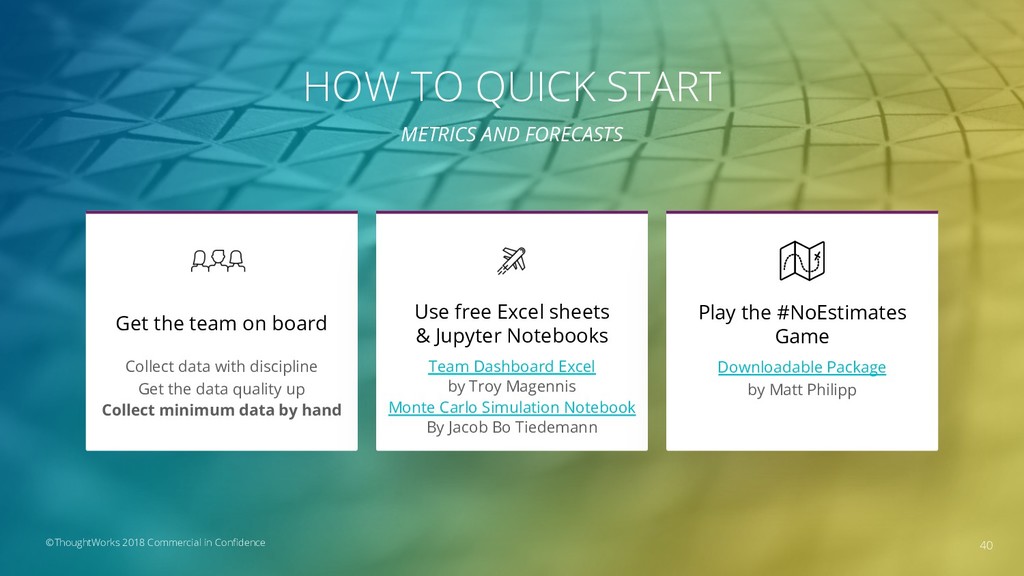
Wie fällt ihr Product Owner oder Team Entscheidungen? Wonach wird das Backlog oder die Roadmap geplant? War eine Verbesserungsmaßnahme erfolgreich? Viele Teams vertrauen hier nur auf ihr Bauchgefühl und Schätzungen in Story Points. Dabei warten bereits Daten aus vorhandenen Quellen wie JIRA, Ticketsystemen und CI/CD-Tools nur auf die Auswertung. In dieser Session stelle ich Metriken und KPIs aus Agile, Lean und DevOps vor und wir fokussieren uns auf das Lernen des Build-Measure-Learn Loops. Wir sehen uns digitale sowie physische Vorgehen und Tools an, die die Daten in Prozesse und die tägliche Arbeit einfließen lassen. Anhand von Beispielen und Diagrammen zeige ich, wie sich diese Daten für eine realistischere Roadmap-Planung nutzen lassen und wie diese Daten dem Team helfen können, sich selbst zu verbessern.

Jacob Bo Tiedemann

May 07, 2019
Tweet

More Decks by Jacob Bo Tiedemann

Other Decks in Business

Transcript

  1. GLOBAL SOFTWARE CONSULTANCY FACTS OVER OPINIONS Wie Daten das Bauchgefühl

    schlagen Jacob Bo Tiedemann, May 2019 1 ©ThoughtWorks 2018 Commercial in Confidence
  2. 2 Hi, there That’s me Combining data and empathy for

    best results. Enabling products to create sustainable value. Hamburger. Loves pancakes. Senior Business Analyst Jacob Bo Tiedemann ©ThoughtWorks 2018 Commercial in Confidence GLOBAL SOFTWARE CONSULTANCY
  3. 3 WIE WIR MIT DATEN DAS BAUCHGEFÜHL SCHLAGEN UNSERE REISE

    VON ESTIMATES ZU #NOESTIMATES ESTIMATES HIGH UNCERTAINTY MÜHSAM & NERVIG ©ThoughtWorks 2018 Commercial in Confidence
  4. WHAT MAKES OUR PLANNING DIFFICULT AND TIME CONSUMING Photo by

    Giora Morein @gioramorein 4 ©ThoughtWorks 2018 Commercial in Confidence UNCERTAINTY
  5. ©ThoughtWorks 2018 Commercial in Confidence “Es ist nie aufgefallen. Fünf

    Story Points… über Jahre hinweg. Ich habe nie etwas anderes geschätzt.” - Andi, Developer (Name durch die Redaktion geändert oder auch nicht) 6
  6. “Tasks that complete faster than estimated have no way to

    compensate for the tasks that take much longer than estimated.” - Erik Bernhardsson @fulhack 8 ©ThoughtWorks 2018 Commercial in Confidence Source: Why Software Projects Take Longer Than You Think - A Statistical Model
  7. BLOWUP FACTOR EQUALLY LIKELY: Blows up by factor of 7.4

    Completes in 14% of the estimated time 9 ©ThoughtWorks 2018 Commercial in Confidence Source: Why Software Projects Take Longer Than You Think - A Statistical Model
  8. Median Mean 99% Percentile Task A (σ = 0.5) 1.00

    1.13 3.20 Task B (σ = 0.5) 1.00 1.13 3.20 Task C (σ = 0.5) 1.00 1.13 3.20 Task D (σ = 1) 1.00 1.65 3.20 Task E (σ = 1) 1.00 1.65 10.24 Task F (σ = 1) 1.00 1.65 10.24 Task G (σ = 2) 1.00 7.39 104.87 SUM 9.74 15.71 112.65 “One single misbehaving task basically ends up dominating the calculation, at least for the 99% case.” - Erik Bernhardsson @fulhack 10 ©ThoughtWorks 2018 Commercial in Confidence Source: Why Software Projects Take Longer Than You Think - A Statistical Model
  9. GREIFEN UNSERE VERBESSERUNGS- MASSNAHMEN? OUR OTHER PROBLEM 11 ©ThoughtWorks 2018

    Commercial in Confidence Hardware Software On-site Remote Discovery Delivery Deadline Value
  10. REDUCE TIME FOR PLANNING MAKE DELIVERY MORE TRANSPARENT IMPROVE OUR

    FLOW HOW WE BEAT GUT FEELING WITH DATA Wir wollen Daten nutzen, um … … unsere Planung und unser Team kontinuierlich zu verbessern … und uns selbst zu kontrollieren. Unsere Vision 13 ©ThoughtWorks 2018 Commercial in Confidence
  11. Start Simple Vom Stempeln zum Datenexport Welche Daten geben Auskunft

    darüber, dass wir Wert liefern und performen? ID Type Other Properties Task Schätzung der Entwickler in T-Shirt Sizes Estimate Auf Tagesbasis inkl. Statusänderungen Start & Completed Date 14 ©ThoughtWorks 2018 Commercial in Confidence
  12. Wir erkennen erfolgreich kleine Aufgaben! Vergleich von Schätzung und Cycle

    Time 15 ©ThoughtWorks 2018 Commercial in Confidence S 3 4 53 days 1 41 M L
  13. ©ThoughtWorks 2018 Commercial in Confidence Die Baseline nach fünf Wochen

    messen Was passiert nun bei einer Teamzusammenlegung? Beginn 16
  14. ©ThoughtWorks 2018 Commercial in Confidence Beginn Fertig (auf Papier) Team

    stabil Einfluss der Teamzusammenlegung auf unsere Performance 17
  15. Wie erhöhen wir unseren Durchsatz? 19 Es braucht mehr als

    einen Versuch... ©ThoughtWorks 2018 Commercial in Confidence
  16. Durchsatz erhöht und Cycle Time reduziert! 20 Übergreifendes WIP-Limit Mehr

    Einbindung von Tech in Analyse und Signoff Arrival Rate == Departure Rate ©ThoughtWorks 2018 Commercial in Confidence
  17. COLLECT DATA WITH DISCIPLINE 21 Identifiziere wenige Key Metrics und

    die dafür notwendigen Daten. Quality, Cycle Time, Throughput, Predictability Stelle die Datenqualität sicher. Precision, Completeness, Accuracy, Uniqueness, Consistency, and Conformity. Dokumentiere und teile Informationen über die Daten und deren Sammlung. Um eine konstruktive Diskussion zu haben, muss jeder die Daten verstehen können. LEARNINGS ©ThoughtWorks 2018 Commercial in Confidence You Must Be This Tall To Use Agile Metrics by Jacob Bo Tiedemann
  18. ©ThoughtWorks 2018 Commercial in Confidence “You get what you measure.

    Metrics will affect actions and decisions. They can be counterproductive and fail when metrics are not balanced or are ill-considered” - Jacob Bo Tiedemann, @jabopiti 22
  19. HOW TO COLLECT & ANALYSE DATA TOOLS 24 ©ThoughtWorks 2018

    Commercial in Confidence Further interesting data to collect Tasks in Backlog Split Rate Arrival Rate WIP Collect & Extract Analyze jira-to-analytics
  20. ©ThoughtWorks 2018 Commercial in Confidence “Remember, with great power comes

    great responsibility.” - Uncle Ben, Spider-Man 25
  21. USE METRICS WITH A SENSE OF RESPONSIBILITY 26 Fokus auf

    Trends, nicht auf Datenpunkte. Messe Team oder System Metriken, keine persönlichen Metriken/ Namen. Vermeide Bewertungen in den Darstellungen. Ansonsten wird Verhalten forciert! Teile Metriken nur nach Absprache mit dem Team. Don’t start the blame game! Ihr fällt die Entscheidungen. Nicht die Daten! LEARNINGS ©ThoughtWorks 2018 Commercial in Confidence
  22. Schätzen ist nicht unser Ding… Also haben wir aufgehört zu

    schätzen! 27 ©ThoughtWorks 2018 Commercial in Confidence S 3 4 53 days 1 41 M L
  23. REDUCE TIME FOR PLANNING MAKE DELIVERY MORE TRANSPARENT HOW WE

    BEAT GUT FEELING WITH DATA Wir wollen Daten nutzen, um realistische Prognosen für die Planung zu erstellen. Unsere Vision 28 ©ThoughtWorks 2018 Commercial in Confidence
  24. WHAT WE COULD LOSE THREATS Fehlende Diskussion über Tasks. Gefühl

    der Bevormundung & Kontrollverlust. Missinterpretation & Missbrauch der Prognosen und Planungen. 29 ©ThoughtWorks 2018 Commercial in Confidence
  25. DON’T GAMBLE… WE TRIED... USING THE AVERAGE FOR FORECASTS 30

    ©ThoughtWorks 2018 Commercial in Confidence 50 50
  26. ©ThoughtWorks 2018 Commercial in Confidence MONTE CARLO SIMULATION “Given your

    alternatives are guessing, even a simple model will perform better.” 31
  27. HOW TO MONTE CARLO SIMULATION Data > 30 Data points

    32 ©ThoughtWorks 2018 Commercial in Confidence Simulation > 10000 times Model Distribution Forecast Percentiles
  28. CONSIDERATIONS & LEARNINGS MAKE UNDERLYING ASSUMPTIONS EXPLICIT ALWAYS PRESENT OPTIONS

    WITH RISKS AND PROBABILITIES TEST YOUR MODEL AGAINST YOUR PAST DATA (DOES IT HOLD THE 50% PERCENTILE?) 33 ©ThoughtWorks 2018 Commercial in Confidence
  29. MONTE CARLO SIMULATION RESEARCH SETUP 34 ©ThoughtWorks 2018 Commercial in

    Confidence CONTEXT At our planning on 28th January 2018 Jacob remarked that the planned scope of 12 items could be too large for the next 14-day sprint. QUESTION: How many items can we complete in 14 days? → Also possible: WHEN? DATA BASIS: Last 100 days ASSUMPTIONS • Team size and availability stays the same • Distribution of item types stays the same • Arrival and split rate don’t matter. • ...
  30. RUN THE MONTE CARLO SIMULATION Data LAST 100 DAYS 35

    ©ThoughtWorks 2018 Commercial in Confidence Forecast Percentiles
  31. FORECAST AND PERCENTILES 36 ©ThoughtWorks 2018 Commercial in Confidence Safe

    & Sound CONCLUSION Reduce scope at least to 10 items. Discuss and decide the risk the team wants to take. Optimistic Risky
  32. MAKE IT VISIBLE and actionable with management or stakeholders within

    in the team in retrospectives Use for discussions Use percentiles to prioritize and plan ahead. Add the forecast to your Burnup chart. Use it for your roadmap Run the forecast on a weekly basis and check if your roadmap holds up ! BELOW 70% ! TAKE ACTION Alerting 37 ©ThoughtWorks 2018 Commercial in Confidence
  33. LEARNINGS IT WORKS! But… … we dedicated extra time to

    discuss tasks (still less time than estimating). … it took some of time to get into the topic. OUR PLANNING BECAME MORE REALISTIC 38 ©ThoughtWorks 2018 Commercial in Confidence
  34. STILL CHALLENGING What we are doing now… … improving predictability.

    Be more consistent. … improving our forecast model (split rates, arrival rate, …) 39 ©ThoughtWorks 2018 Commercial in Confidence ASSUMPTIONS HAVE BEEN INVALIDATED
  35. HOW TO QUICK START METRICS AND FORECASTS Collect data with

    discipline Get the data quality up Collect minimum data by hand Get the team on board Team Dashboard Excel by Troy Magennis Monte Carlo Simulation Notebook By Jacob Bo Tiedemann Use free Excel sheets & Jupyter Notebooks Downloadable Package by Matt Philipp Play the #NoEstimates Game 40 ©ThoughtWorks 2018 Commercial in Confidence
  36. THANKS! I REALLY APPRECIATE QUESTIONS AND FEEDBACK (also via mail

    or Twitter) JACOB BO TIEDEMANN SENIOR CONSULTANT BUSINESS ANALYST @jabopiti | [email protected] | thoughtworks.com 41 ©ThoughtWorks 2018 Commercial in Confidence
  37. FURTHER READINGS & RESOURCES 42 ©ThoughtWorks 2018 Commercial in Confidence

    Reading & Exploration You must be this tall to use agile metrics #NoEstimates game Whole bunch of articles about metrics in Agile teams Book: Actionable Agile Metrics For Predictability Book: Making Work Visible Book: Accelerate - The Science of Lean Software and DevOps: Building and Scaling High Performing Technology Organizations Book: How to measure anything Tools Actionable Agile Jira-to-analytics Kanban Monte Carlo Simulation (Jupyter Notebook) Team Dashboard
  38. LITTLE’S LAW 1. The average output or departure rate (Throughput)

    should equal the average input or arrival rate (λ). 2. All work that is started will eventually be completed and exit the system. 3. The amount of WIP should be roughly the same at the beginning and at the end of the time interval chosen for the calculation. 4. The average age of the WIP is neither growing nor declining. 5. The calculation must be performed using consistent units. 43 IS BASED ON THE LAW ‘ARRIVAL RATE OF A SYSTEM’ OF THE QUEUING THEORY. FIVE CONDITIONS MUST EXIST IN ORDER FOR THE LAW TO BE VALID ©ThoughtWorks 2018 Commercial in Confidence If WIP increases faster than Throughput, then Cycle Times will only increase. NO MENTION OF... … EQUAL SIZE OF WORK IS NOT A CONDITION … CHARACTERISTIC STATISTICAL DISTRIBUTION OF ARRIVAL OR DEPARTURE RATE Source D. VACANTI, B. VALLET