Upgrade to Pro — share decks privately, control downloads, hide ads and more …

Modeling Social Data, Lecture 5: Reproducibility and replication, Part 1

Jake Hofman
February 22, 2019

Modeling Social Data, Lecture 5: Reproducibility and replication, Part 1

Jake Hofman

February 22, 2019
Tweet

More Decks by Jake Hofman

Other Decks in Education

Transcript

  1. Reproducibility, replication, etc. APAM E4990 Modeling Social Data Jake Hofman

    Columbia University February 22, 2019 Jake Hofman (Columbia University) Reproducibility, replication, etc. February 22, 2019 1 / 18
  2. Questions How should one evaluate research results? • Was the

    research done and reported honestly / correctly? • Is the result “real” or an artifact of the data / analysis? • Will it hold up over time? • How robust is the result to small changes? • How important / useful is the finding? Jake Hofman (Columbia University) Reproducibility, replication, etc. February 22, 2019 2 / 18
  3. Honesty Was the data accurately collected and reported? We’ll take

    the optimistic view that most researchers are honest, although there are exceptions Jake Hofman (Columbia University) Reproducibility, replication, etc. February 22, 2019 3 / 18
  4. Reproducibility Can you independently verify the exact results using the

    same data and the same analysis? Though a low bar, most research doesn’t currently pass this test: • Data or code aren’t available / complete • Code is difficult to run / understand • Complex software dependencies Jake Hofman (Columbia University) Reproducibility, replication, etc. February 22, 2019 5 / 18
  5. Reproducibility Can you independently verify the exact results using the

    same data and the same analysis? This is improving with better software engineering practices among researchers: • Literate programming (Jupyter, Rmarkdown) • Automated build scripts (Makefiles) • Containers (Docker, Code Ocean) Jake Hofman (Columbia University) Reproducibility, replication, etc. February 22, 2019 6 / 18
  6. Reproducibility A Practical Taxonomy of Reproducibility for Machine Learning Research

    Rachael Tatman Kaggle Seattle, WA 91803 [email protected] Jake VanderPlas eScience Institute University of Washington Seattle, WA 98195 [email protected] Sohier Dane Kaggle Seattle, WA 91803 [email protected] Abstract Discussions of reproducibility in science are often framed from the perspective of scientists and researchers who want to validate published claims. A complementary perspective is that of the practitioner who sets out to apply a new computational method within their own domain, the first step of which is often to reproduce the published results as a check for correctness of code. In this paper we discuss a taxon- omy of reproducibility from this perspective of a practitioner. Low reproducibility studies are those which merely describe algorithms, medium reproducibility studies code. As a result, they can be more portable across different machines. However, they are generally orders of magnitude larger and can require much longer startup times. VirtualBox is one popular open source option for creating and sharing virtual machines. Regardless of how the computational environment is shared, there are some general guidelines that can help improve the ease of reproduction of projects using this framework. 4.4 Improving reproducibility at this level: A high-reproducibility study can require substantial effort on the researcher’s part. In addition to the above resources, we recommend the following practical steps: • Try to minimize the number of steps reproducers will need to perform. For example, move as much code as possible into scripts that can be batch called from a notebook or include a single script that acquires the data, prepares the environment, and executes the code with a single command. • If not using a hosted service, include instructions on how to download and set up the docker or VM. You can do this by setting up the project from scratch on a new computer (ideally with a different operating system) and writing down each step as you do it. 5 Discussion & Conclusion Issues of reproducibility in ML extend beyond ICML. Of the 679 papers presented at NIPS in 2017, for instance, only 259–or less than 40%–provided links to code on the NIPS website. Far fewer provided the environment needed to actually run that code. A few notable exceptions include Liu et al.’s paper on unsupervised image-to-image translation networks [14] and the papers presented at the MLTrain NIPS workshop. As a field, ML is making strides towards reproducibility, but there is still a long way to go. There are other challenges in reproducibility beyond encouraging researchers to adopt reproducible workflows. In particular, it’s important to consider the longevity of reproducible examples. For instance, if a graduate student is hosting code on their university’s website, will it remain available after they graduate? These concerns are not just hypothetical: the rate of decay in links in published papers is very high. One study of NLP papers found that roughly 20% of links were broken or Jake Hofman (Columbia University) Reproducibility, replication, etc. February 22, 2019 7 / 18
  7. Replicability Will the result hold up with new data but

    the same analysis? • It’s easy to be fooled by randomness • Noise can dominate signal in small datasets • Asking too many questions of the data can lead to overfitting Jake Hofman (Columbia University) Reproducibility, replication, etc. February 22, 2019 9 / 18
  8. Crisis Believe about half of what you read Jake Hofman

    (Columbia University) Reproducibility, replication, etc. February 22, 2019 10 / 18
  9. Crisis insufficient specification of the conditions nec- essary or sufficient

    to obtain the results. Direct replication is the attempt to recreate the con- ditions believed sufficient for obtaining a pre- The mean effect size (r) of the replication ef- fects (Mr = 0.197, SD = 0.257) was half the mag- nitude of the mean effect size of the original effects (Mr = 0.403, SD = 0.188), representing a the original effect sizes. Moreove evidence is consistent with the co variation in the strength of in (such as original P value) was m of replication success than var characteristics of the teams co research (such as experience a The latter factors certainly can lication success, but they did no so here. Reproducibility is not well un cause the incentives for individ prioritize novelty over replica tion is the engine of discovery a a productive, effective scientif However, innovative ideas beco fast. Journal reviewers and edi miss a new test of a publishe original. The claim that “we alrea belies the uncertainty of scient Innovation points out paths tha replication points out paths th progress relies on both. Replic crease certainty when findings a and promote innovation when This project provides accumula for many findings in psycholog and suggests that there is still do to verify whether we know w we know. ▪ SCIENCE sciencemag.org 28 AUGUST 2015 • VOL 349 ISS The list of author affiliations is available in the *Corresponding author. E-mail: nosek@virg Cite this article as Open Science Collabora aac4716 (2015). DOI: 10.1126/science.aac4 Original study effect size versus replication effect size (correlation coefficients). Diagonal line represents replication effect size equal to original effect size. Dotted line represents replication effect size of 0. Points below the dotted line were effects in the opposite direction of the original. Density plots are separated by significant (blue) and nonsignificant (red) effects. Believe about half of what you read Jake Hofman (Columbia University) Reproducibility, replication, etc. February 22, 2019 11 / 18
  10. Statistics! Hypothesis testing? P-values? Statistical significance? Confidence intervals?? Effect sizes???

    xkcd.com/892 Jake Hofman (Columbia University) Reproducibility, replication, etc. February 22, 2019 12 / 18
  11. Quiz #1 (h/t Shane Frederick) Which treatment would you prefer?

    • Treatment A was found to improve health over a placebo by 10 points on average (with a standard error of 5 points) in a study with N = 100 participants. • Treatment B was found to improve health over a placebo by 10 points on average (with a standard error of 5 points) in a study with N = 1,000 participants. Jake Hofman (Columbia University) Reproducibility, replication, etc. February 22, 2019 13 / 18
  12. Quiz #2 (Oakes 1986) Gigerenzer y - - t -

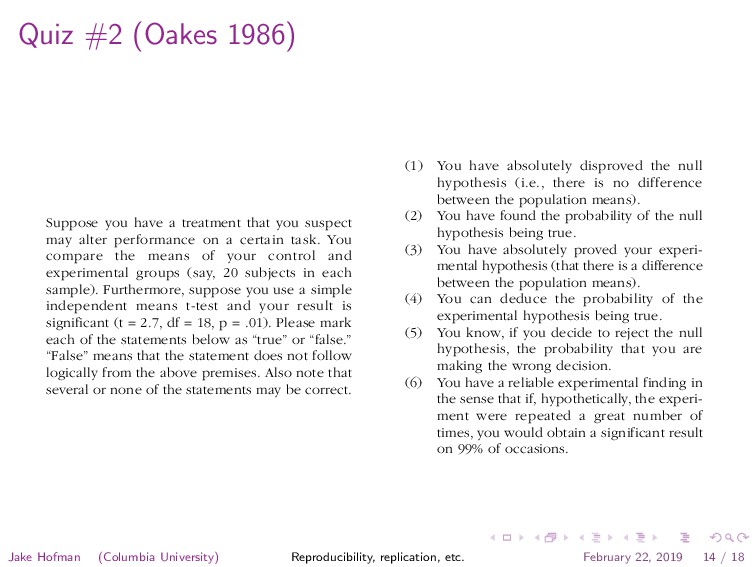
    r - h d, f - n - m s & - s - - e n - n, s t e partly blocked and they should endorse these beliefs about the importance of significant results. Table 2 reviews the relevant studies that have been conducted. In the British study mentioned earlier, Oakes (1986, p. 80) asked academic psychologists what a significant result (p = .01) means: Suppose you have a treatment that you suspect may alter performance on a certain task. You compare the means of your control and experimental groups (say, 20 subjects in each sample). Furthermore, suppose you use a simple independent means t-test and your result is significant (t = 2.7, df = 18, p = .01). Please mark each of the statements below as “true” or “false.” “False” means that the statement does not follow logically from the above premises. Also note that several or none of the statements may be correct. (1) You have absolutely disproved the null hypothesis (i.e., there is no difference between the population means). (2) You have found the probability of the null hypothesis being true. (3) You have absolutely proved your experi- mental hypothesis (that there is a difference between the population means). (4) You can deduce the probability of the the numbers in Table 1 are probably underestimates of the true frequency of the replication delusion. A study with members of the Mathematical Psychol- ogy Group and the American Psychological Association (not included in Table 1 because the survey asked dif- ferent kinds of questions) also found that most of them trusted in small samples and had high expectations about the replicability of significant results (Tversky & Kahneman, 1971). A glance into textbooks and editori- als reveals that the delusion was already promoted as early as the 1950s. For instance, in her textbook Dif- ferential Psychology, Anastasi (1958) wrote: “The ques- tion of statistical significance refers primarily to the extent to which similar results would be expected if an investigation were to be repeated” (p. 9). In his Intro- duction to Statistics for Psychology and Education, Nunnally (1975) stated: “If the statistical significance is at the 0.05 level . . . the investigator can be confident with odds of 95 out of 100 that the observed difference will hold up in future investigations” (p. 195). Similarly, former editor of the Journal of Experimental Psychology A. W. Melton (1962) explained that he took the level of significance as a measure of the “confidence that the results of the experiment would be repeatable under the conditions described” (p. 553). The illusion of certainty and Bayesian wishful thinking As I have mentioned, a p value is a statement about the probability of a statistical summary of data, assuming that the null hypothesis is true. It delivers probability, not certainty. It does not tell us the probability that a hypothesis—whether the null or the alternative—is compare the means of your control and experimental groups (say, 20 subjects in each sample). Furthermore, suppose you use a simple independent means t-test and your result is significant (t = 2.7, df = 18, p = .01). Please mark each of the statements below as “true” or “false.” “False” means that the statement does not follow logically from the above premises. Also note that several or none of the statements may be correct. (1) You have absolutely disproved the null hypothesis (i.e., there is no difference between the population means). (2) You have found the probability of the null hypothesis being true. (3) You have absolutely proved your experi- mental hypothesis (that there is a difference between the population means). (4) You can deduce the probability of the experimental hypothesis being true. (5) You know, if you decide to reject the null hypothesis, the probability that you are making the wrong decision. (6) You have a reliable experimental finding in the sense that if, hypothetically, the experi- ment were repeated a great number of times, you would obtain a significant result on 99% of occasions. Each of the six beliefs is false, a possibility explicitly stated in the instruction. Beliefs 1 and 3 are illusions of certainty: significance tests provide probabilities, not certainties. Beliefs 2, 4, and 5 are versions of Bayesian wishful thinking. Belief 2 is incorrect because a p value Jake Hofman (Columbia University) Reproducibility, replication, etc. February 22, 2019 14 / 18
  13. Quiz #3a (Hofman, Hullman, Goldstein 2019?) Below are results of

    an experiment with 1,000 slides of a standard boulder (left) and special boulder (right), with bars showing two standard errors on the mean. Estimate the probability that a slide of the special boulder goes farther than a slide of the standard boulder. Jake Hofman (Columbia University) Reproducibility, replication, etc. February 22, 2019 15 / 18
  14. Quiz #3b (Hofman, Hullman, Goldstein 2019?) Below are results of

    an experiment with 1,000 slides of a standard boulder (left) and special boulder (right), with bars showing two standard errors on the mean and points showing individual slides. Estimate the probability that a slide of the special boulder goes farther than a slide of the standard boulder. Jake Hofman (Columbia University) Reproducibility, replication, etc. February 22, 2019 16 / 18
  15. Misunderstandings ESSAY Statistical tests, P values, confidence intervals, and power:

    a guide to misinterpretations Sander Greenland1 • Stephen J. Senn2 • Kenneth J. Rothman3 • John B. Carlin4 • Charles Poole5 • Steven N. Goodman6 • Douglas G. Altman7 Received: 9 April 2016 / Accepted: 9 April 2016 / Published online: 21 May 2016 Ó The Author(s) 2016. This article is published with open access at Springerlink.com Abstract Misinterpretation and abuse of statistical tests, confidence intervals, and statistical power have been decried for decades, yet remain rampant. A key problem is that there are no interpretations of these concepts that are at once simple, intuitive, correct, and foolproof. Instead, correct use and interpretation of these statistics requires an attention to detail which seems to tax the patience of working scientists. This high cognitive demand has led to an epidemic of shortcut definitions and interpretations that are simply wrong, sometimes disastrously so—and yet these misinterpretations dominate much of the scientific literature. In light of this problem, we provide definitions and a discussion of basic statistics that are more general and critical than typically found in traditional introductory expositions. Our goal is to provide a resource for instruc- tors, researchers, and consumers of statistics whose knowledge of statistical theory and technique may be limited but who wish to avoid and spot misinterpretations. We emphasize how violation of often unstated analysis protocols (such as selecting analyses for presentation based on the P values they produce) can lead to small P values even if the declared test hypothesis is correct, and can lead to large P values even if that hypothesis is incorrect. We then provide an explanatory list of 25 misinterpretations of P values, confidence intervals, and power. We conclude with guidelines for improving statistical interpretation and reporting. Editor’s note This article has been published online as supplementary material with an article of Wasserstein RL, Lazar NA. The ASA’s statement on p-values: context, process and purpose. The American Statistician 2016. Albert Hofman, Editor-in-Chief EJE. 3 Eur J Epidemiol (2016) 31:337–350 DOI 10.1007/s10654-016-0149-3 Jake Hofman (Columbia University) Reproducibility, replication, etc. February 22, 2019 17 / 18
  16. Statistical rituals https://doi.org/10.1177/2515245918771329 Advances in Methods and Practices in Psychological

    Science 2018, Vol. 1(2) 198 –218 © The Author(s) 2018 Reprints and permissions: sagepub.com/journalsPermissions.nav DOI: 10.1177/2515245918771329 www.psychologicalscience.org/AMPPS 771329 AMPXXX10.1177/2515245918771329GigerenzerStatistical Rituals research-article2018 Statistical Rituals: The Replication Delusion and How We Got There Gerd Gigerenzer Harding Center for Risk Literacy, Max-Planck Institute for Human Development, Berlin, Germany Abstract The “replication crisis” has been attributed to misguided external incentives gamed by researchers (the strategic-game hypothesis). Here, I want to draw attention to a complementary internal factor, namely, researchers’ widespread faith in a statistical ritual and associated delusions (the statistical-ritual hypothesis). The “null ritual,” unknown in statistics proper, eliminates judgment precisely at points where statistical theories demand it. The crucial delusion is that the p value specifies the probability of a successful replication (i.e., 1 – p), which makes replication studies appear to be superfluous. A review of studies with 839 academic psychologists and 991 students shows that the replication delusion existed among 20% of the faculty teaching statistics in psychology, 39% of the professors and lecturers, and 66% of the students. Two further beliefs, the illusion of certainty (e.g., that statistical significance proves that an effect exists) and Bayesian wishful thinking (e.g., that the probability of the alternative hypothesis being true is 1 – p), also make successful replication appear to be certain or almost certain, respectively. In every study reviewed, the majority of researchers (56%–97%) exhibited one or more of these delusions. Psychology departments need to begin teaching statistical thinking, not rituals, and journal editors should no longer accept manuscripts that report results as “significant” or “not significant.” Keywords General Article Jake Hofman (Columbia University) Reproducibility, replication, etc. February 22, 2019 18 / 18