Upgrade to Pro — share decks privately, control downloads, hide ads and more …

Modeling Social Data, Lecture 10: Networks

Modeling Social Data, Lecture 10: Networks

Jake Hofman

April 05, 2019
Tweet

More Decks by Jake Hofman

Other Decks in Education

Transcript

  1. Networks APAM E4990 Modeling Social Data Jake Hofman Columbia University

    April 5, 2019 Jake Hofman (Columbia University) Networks April 5, 2019 1 / 16
  2. ∼1960s: Random graph theory p > (1 + ) ln

    n n Erd˝ os & R´ enyi (1959) Jake Hofman (Columbia University) Networks April 5, 2019 4 / 16
  3. ∼1970s: Cumulative advantage have never been cited, about 10 percent

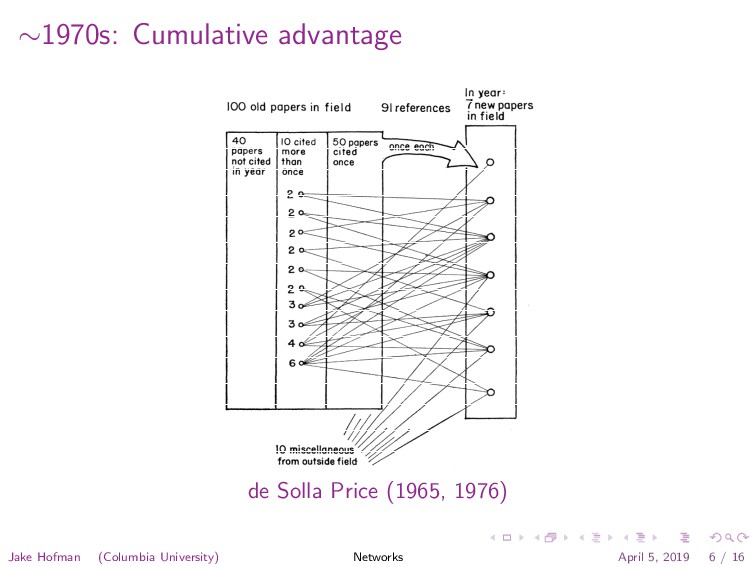
    woulld prove so distinctive that they have been cited once, about 9 percent could be picked automatically by twice, and so on, the percentages slowly means of citation-index-production ‘pro- decreasing, so that half of all papers cedures and published as a single U.X will be cited eventually five times or (or World) Journal of Really Impor- more, and a quarter of all papers, ten tan t Papers, In year’ 100 old papers in field 91 references ~n~~i~, 40 papers not cited in year - . IO cited more than unce 2w *% 2s 2T 2y 2 3 3 4 6 50 papers cited once 10 miscellaneous from outside field Fig. 3. Idealized representation of the balance of papers and citations for a given “almost closed” field in a single year. It is assumed that the field consists of 1010 papers whose numbers have been growing exponentially at the normal rate. If we assume that each of the seven new papers contains about 13 references to journal papers and that about 11 percent of these 91 cited papers (or ten papers) are outside the field, we find that 50 of the old papers are connected by one citation each to the new papers (these links are not shown) and that 40 of the old papers are not cited at all during the year. The seven new papers, then, are linked to ten sf the old ones by the complex network shown here, 512 relation, if one exists, is very smalf, Certainly, there is no strong tendency for review papers ‘to be cited unusually often Tf my conjecture is valid, it is worth noting that, since 10 percent of all papers contain no ~bibliogrXapbic ref- erences and another, presumably almost independent, 10 percent of all pa.pers are never cited, it follows that there is a lower Ibound of -1. percent of all papers on the number of papers tlhat are totally disconnected in a pure ci- tation network and could be found only by topical indexing or similar methods; this is a very small class, and probaibly a most unim:portant one. The balance of references and ci- tations in a single. year indicates one very important attribute of the net- work (see Fig. 3). Although most papers produced in the year contain a near- average number of bibliographic refer- ences, half of these are references to about half of all the papers that have been published in previous years. The other half of the references tie these new papers to a quite small group of earlier ones, and generate a rather tight pattern of multiple relationships. Thus each group of new papers is “knitted” to a small, select part of the existing scientific literature tbut connected rath- er weakly and randomly to a much greater part. Since only a small part of the earlier literature is knitted together by the new year’s crop of papers, we may look upon this small part as a sort of growing tip or epidermal Jayer, an active research front. I believe it is the existence of a research front, in this sense, that distinguishes the sciences from the rest of scholarship, a.nd, be- cause of it, I propose that one of the major ,tasks of statistical analysis is to determine the mechanism that enables science to cumulate so ~much faster than nonscience that it produces a literature crisis, An analysis of the distribution of publication dates of all -papers cited in a single year (Fig. 4) sheds further light on the existence of such a research front. Taking [from Garfield (2)] data for 1961, the ‘most numerous count SCIENCE, VOL. 149 de Solla Price (1965, 1976) Jake Hofman (Columbia University) Networks April 5, 2019 6 / 16
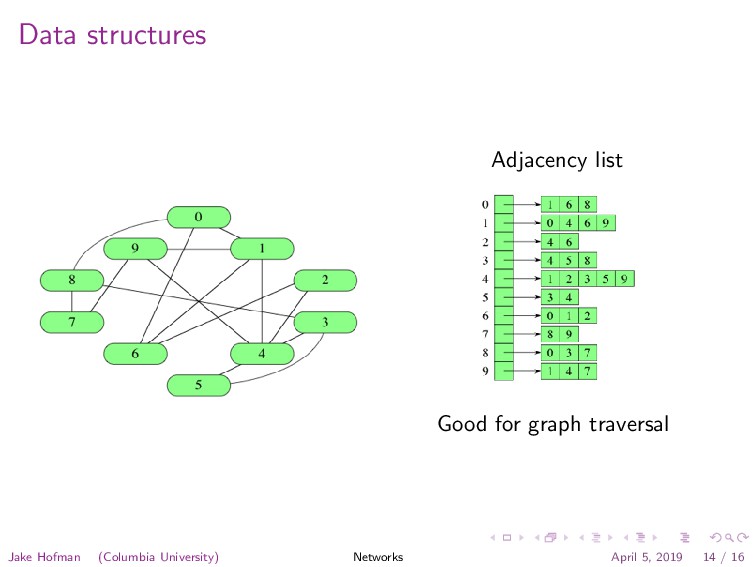
  4. ∼1970s: Cumulative advantage 4 1 dex. ndex. d data for

    rterly and I fmd for five years, and inde- ues of 1.4, efore that the quin- nafifth of we should for n = 29,655 we have m = 0.53. . . 2 . . Dimibution 1 10 100 Fig. I . Number of papers w i t h (a) exactly and (b) at least n cita- tions in %, 1, and 5-year indexes. fomation Science-September-October 1976 de Solla Price (1965, 1976) Jake Hofman (Columbia University) Networks April 5, 2019 6 / 16
  5. ∼1990s: Empirical structure and dynamics of networks Newman, Barabasi, Watts

    (2006) Jake Hofman (Columbia University) Networks April 5, 2019 8 / 16
  6. ∼2000s: Homophily, contagion, and all that Figure 1: Community structure

    of political blogs (expanded set), shown using utilizing the GUESS visual- ization and analysis tool[2]. The colors reflect political orientation, red for conservative, and blue for liberal. Orange links go from liberal to conservative, and purple ones from conservative to liberal. The size of each blog reflects the number of other blogs that link to it. Because of bloggers’ ability to identify and frame break- ing news, many mainstream media sources keep a close eye on the best known political blogs. A number of mainstream news sources have started to discuss and even to host blogs. neighborhoods of Atrios, a popular liberal blog, and In- stapundit, a popular conservative blog. He found the In- stapundit neighborhood to include many more blogs than the Atrios one, and observed no overlap in the URLs cited Adamic & Glance (2005) Jake Hofman (Columbia University) Networks April 5, 2019 9 / 16
  7. Types of networks Networks are a useful abstractions for many

    different types of data • Social networks (e.g., Facebook) • Information networks (e.g., the Web) • Activity networks (e.g., email) • Biological networks (e.g., protein interactions) • Geographical networks (e.g., roads) Jake Hofman (Columbia University) Networks April 5, 2019 11 / 16
  8. Representations There are many different levels of abstraction for representing

    networks (e.g., directed, weighted, metadata, etc.) 32 CHAPTER 2. GRAPHS B A C D (a) A graph on 4 nodes. B A C D (b) A directed graph on 4 nodes. Figure 2.1: Two graphs: (a) an undirected graphs, and (b) a directed graph. will be undirected unless noted otherwise. Graphs as Models of Networks. Graphs are useful because they serve as mathematical models of network structures. With this in mind, it is useful before going further to replace the toy examples in Figure 2.1 with a real example. Figure 2.2 depicts the network structure Jake Hofman (Columbia University) Networks April 5, 2019 12 / 16
  9. Representations There are many different levels of abstraction for representing

    networks (e.g., directed, weighted, metadata, etc.) 2.2. PATHS AND CONNECTIVITY 33 Jake Hofman (Columbia University) Networks April 5, 2019 12 / 16
  10. Representations There are many different levels of abstraction for representing

    networks (e.g., directed, weighted, metadata, etc.) Relational Topic Models for Document Networks 52 478 430 2487 75 288 1123 2122 2299 1354 1854 1855 89 635 92 2438 136 479 109 640 119 686 120 1959 1539 147 172 177 965 911 2192 1489 885 178 378 286 208 1569 2343 1270 218 1290 223 227 236 1617 254 1176 256 634 264 1963 2195 1377 303 426 2091 313 1642 534 801 335 344 585 1244 2291 2617 1627 2290 1275 375 1027 396 1678 2447 2583 1061 692 1207 960 1238 2012 1644 2042 381 418 1792 1284 651 524 1165 2197 1568 2593 1698 547 683 2137 1637 2557 2033 632 1020 436 442 449 474 649 2636 2300 539 541 603 1047 722 660 806 1121 1138 831 837 1335 902 964 966 981 1673 1140 1481 1432 1253 1590 1060 992 994 1001 1010 1651 1578 1039 1040 1344 1345 1348 1355 1420 1089 1483 1188 1674 1680 2272 1285 1592 1234 1304 1317 1426 1695 1465 1743 1944 2259 2213 We address the problem of finding a subset of features that allows a supervised induction algorithm to induce small high- accuracy concepts... Irrelevant features and the subset selection problem In many domains, an appropriate inductive bias is the MIN- FEATURES bias, which prefers consistent hypotheses definable over as few features as possible... Learning with many irrelevant features In this introduction, we define the term bias as it is used in machine learning systems. We motivate the importance of automated methods for evaluating... Evaluation and selection of biases in machine learning The inductive learning problem consists of learning a concept given examples and nonexamples of the concept. To perform this learning task, inductive learning algorithms bias their learning method... Utilizing prior concepts for learning The problem of learning decision rules for sequential tasks is addressed, focusing on the problem of learning tactical plans from a simple flight simulator where a plane must avoid a missile... Improving tactical plans with genetic algorithms Evolutionary learning methods have been found to be useful in several areas in the development of intelligent robots. In the approach described here, evolutionary... An evolutionary approach to learning in robots Navigation through obstacles such as mine fields is an important capability for autonomous underwater vehicles. One way to produce robust behavior... Using a genetic algorithm to learn strategies for collision avoidance and local navigation ... ... ... ... ... ... ... ... ... ... Figure 1: Example data appropriate for the relational topic model. Each document is represented as a bag of words and linked to other documents via citation. The RTM defines a joint distribution over the words in each document and the citation links between them. The RTM is based on latent Dirichlet allocation (LDA) (Blei et al. 2003). LDA is a generative probabilistic model that uses a set of “topics,” distributions over a fixed vocab- Figure 2 illustrates the graphical model for this process for a single pair of documents. The full model, which is dif- ficult to illustrate, contains the observed words from all D Jake Hofman (Columbia University) Networks April 5, 2019 12 / 16
  11. Which network? 3.4. TIE STRENGTH, SOCIAL MEDIA, AND PASSIVE ENGAGEMENT

    69 All Friends One-way Communication Mutual Communication Maintained Relationships Figure 3.8: Four di erent views of a Facebook user’s network neighborhood, showing the structure of links coresponding respectively to all declared friendships, maintained relation- ships, one-way communication, and reciprocal (i.e. mutual) communication. (Image from [281].) Notice that these three categories are not mutually exclusive — indeed, the links classified as reciprocal communication always belong to the set of links classified as one-way commu- nication. Jake Hofman (Columbia University) Networks April 5, 2019 13 / 16
  12. Which network? 636 CHAPTER 20. THE SMALL-WORLD PHENOMENON Figure 20.12:

    The pattern of e-mail communication among 436 employees of Hewlett Packard Research Lab is superimposed on the o⌅cial organizational hierarchy, show- ing how network links span di erent social foci [6]. (Image from http://www- personal.umich.edu/ ladamic/img/hplabsemailhierarchy.jpg) Social Foci and Social Distance. When we first discussed the Watts-Strogatz model in Jake Hofman (Columbia University) Networks April 5, 2019 13 / 16
  13. Which network? Figure 1: Topology of the largest components over

    various choices of threshold conditions for (a) a dataset based on email server logs at a US university, and (b) the Enron email corpus. Significant changes in topology are observed as the thresholding condition of the network is varied. where alternative definitions are considered [15, 17], the pur- pose is exclusively to serve as a robustness check on the find- ings; thus the scope of possibilities is typically limited to within some range of the original choice of threshold. Most closely related to the current work are two recent studies us- ing mobile phone data [27, 9]. In [27], the authors systemat- ically deleted edges as a function of call frequency in order to investigate the connectivity of the network, and its impact The emails contain encrypted IDs of the sender and recipi- ent(s) of each email and the timestamp, but do not contain the content. The dataset also features several (anonymized) personal attributes, including status, gender, age, depart- mental affiliation, number of years in the community, dorm and home zipcode information for the students, as well as course affiliations for the students at each semester. In order to focus on a population of users who use emails WWW 2010 • Full Paper April 26-30 • Raleigh • NC • USA Jake Hofman (Columbia University) Networks April 5, 2019 13 / 16
  14. Data structures [ [0,1], [0,6], [0,8], [1,4], [1,6], [1,9], [2,4],

    [2,6], [3,4], [3,5], [3,8], [4,5], [4,9], [7,8], [7,9] ] Simple for storage, but difficult to compute with Jake Hofman (Columbia University) Networks April 5, 2019 14 / 16
  15. Data structures Adjacency matrix Quick to check edges, good for

    linear algebra, often sparse Jake Hofman (Columbia University) Networks April 5, 2019 14 / 16
  16. Data structures Adjacency list Good for graph traversal Jake Hofman

    (Columbia University) Networks April 5, 2019 14 / 16
  17. Descriptive statistics • Degree: How many connections does a node

    have? • Path length: What’s the shortest path between two nodes? • Clustering: How many friends of friends are also friends? • Components: How many disconnected parts does the network have? Jake Hofman (Columbia University) Networks April 5, 2019 16 / 16
  18. Algorithms for Descriptive statistics • Degree: How many connections does

    a node have? → Degree distributions • Path length: What’s the shortest path between two nodes? → Breadth first search • Clustering: How many friends of friends are also friends? → Triangle counting • Components: How many disconnected parts does the network have? → Connected components Jake Hofman (Columbia University) Networks April 5, 2019 16 / 16