the best programming language out there • But it happens to be great for data analysis • The result is a steep learning curve with a high payoff Jake Hofman (Columbia University) Data manipulation in R February 8, 2019 2 / 26
of camelCase, this.that, and snake case conventions • Dots (.) (mostly) don’t mean anything special • Likewise, $ gets used in funny ways • R is loosely typed, which can lead to unexpected coercions and silent fails • It also tries to be clever about variable scope, which can backfire if you’re not careful Jake Hofman (Columbia University) Data manipulation in R February 8, 2019 3 / 26
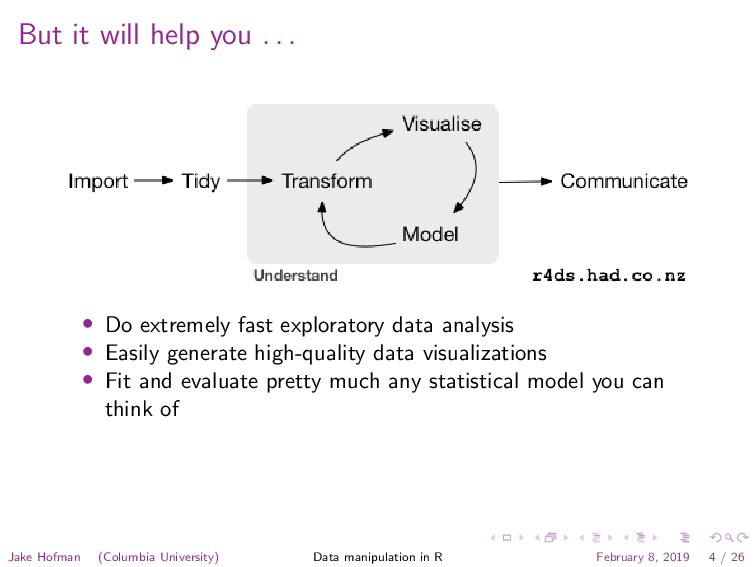
extremely fast exploratory data analysis • Easily generate high-quality data visualizations • Fit and evaluate pretty much any statistical model you can think of Jake Hofman (Columbia University) Data manipulation in R February 8, 2019 4 / 26
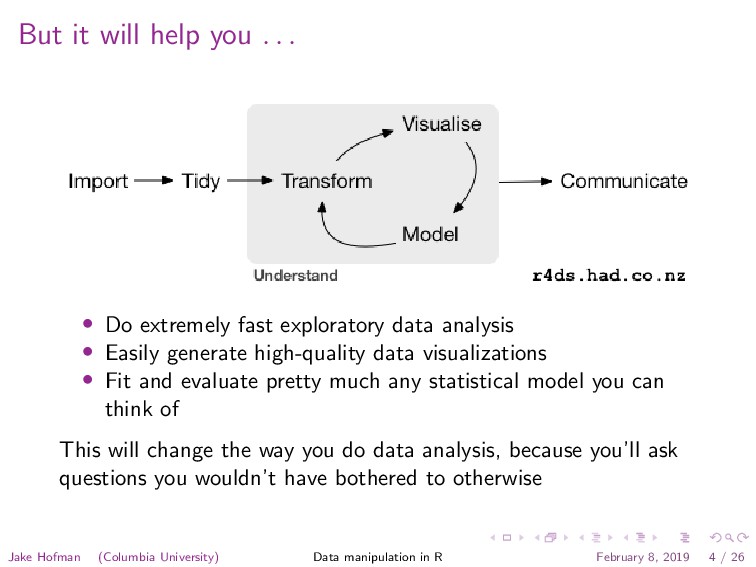
extremely fast exploratory data analysis • Easily generate high-quality data visualizations • Fit and evaluate pretty much any statistical model you can think of This will change the way you do data analysis, because you’ll ask questions you wouldn’t have bothered to otherwise Jake Hofman (Columbia University) Data manipulation in R February 8, 2019 4 / 26
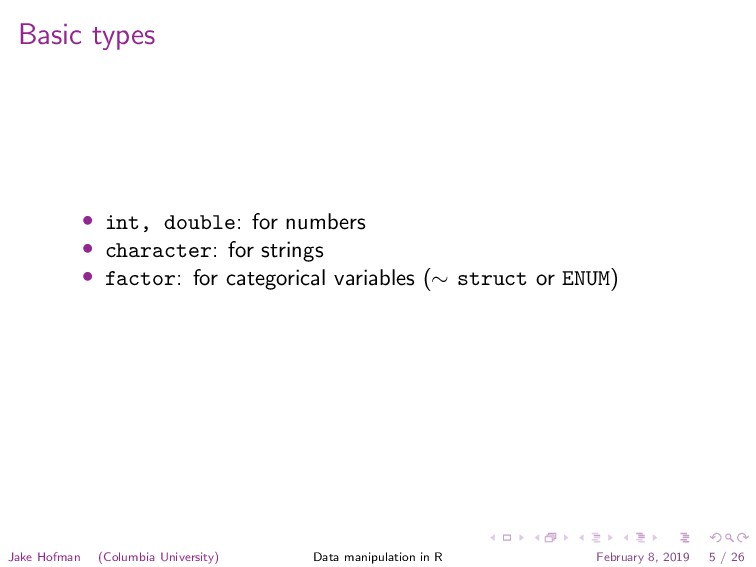
strings • factor: for categorical variables (∼ struct or ENUM) Factors are handy, but take some getting used to Jake Hofman (Columbia University) Data manipulation in R February 8, 2019 5 / 26
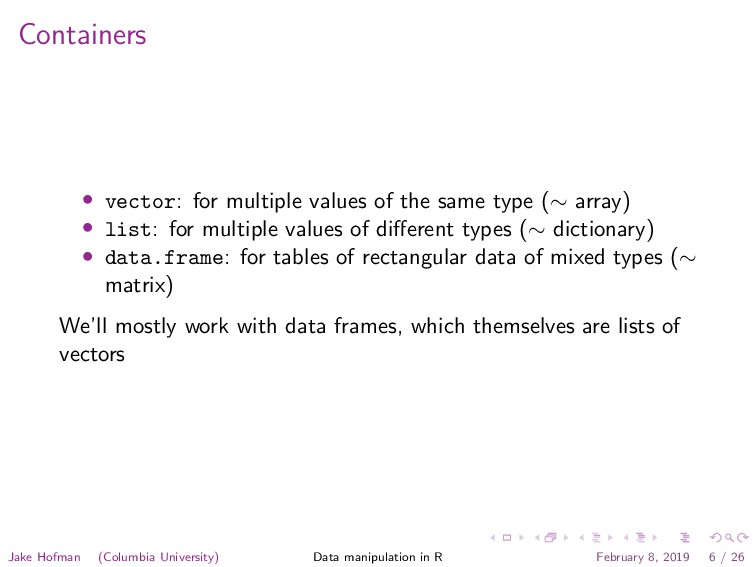
(∼ array) • list: for multiple values of different types (∼ dictionary) • data.frame: for tables of rectangular data of mixed types (∼ matrix) Jake Hofman (Columbia University) Data manipulation in R February 8, 2019 6 / 26
(∼ array) • list: for multiple values of different types (∼ dictionary) • data.frame: for tables of rectangular data of mixed types (∼ matrix) We’ll mostly work with data frames, which themselves are lists of vectors Jake Hofman (Columbia University) Data manipulation in R February 8, 2019 6 / 26
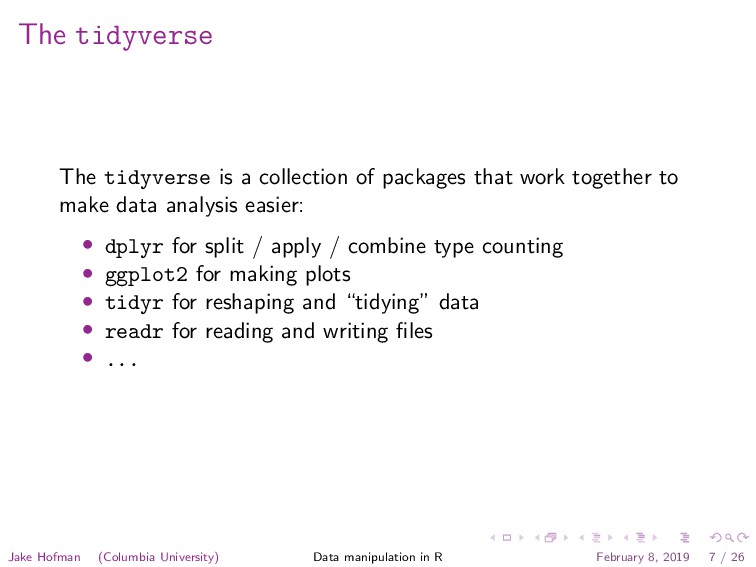
work together to make data analysis easier: • dplyr for split / apply / combine type counting • ggplot2 for making plots • tidyr for reshaping and “tidying” data • readr for reading and writing files • ... Jake Hofman (Columbia University) Data manipulation in R February 8, 2019 7 / 26
be in a “tidy” table with: • One variable per column • One observation per row • One measured value per cell Jake Hofman (Columbia University) Data manipulation in R February 8, 2019 8 / 26
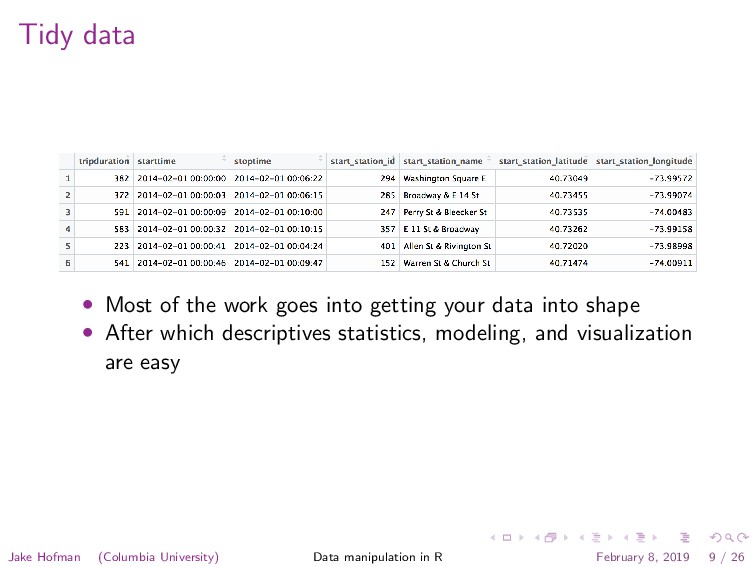
your data into shape • After which descriptives statistics, modeling, and visualization are easy Jake Hofman (Columbia University) Data manipulation in R February 8, 2019 9 / 26
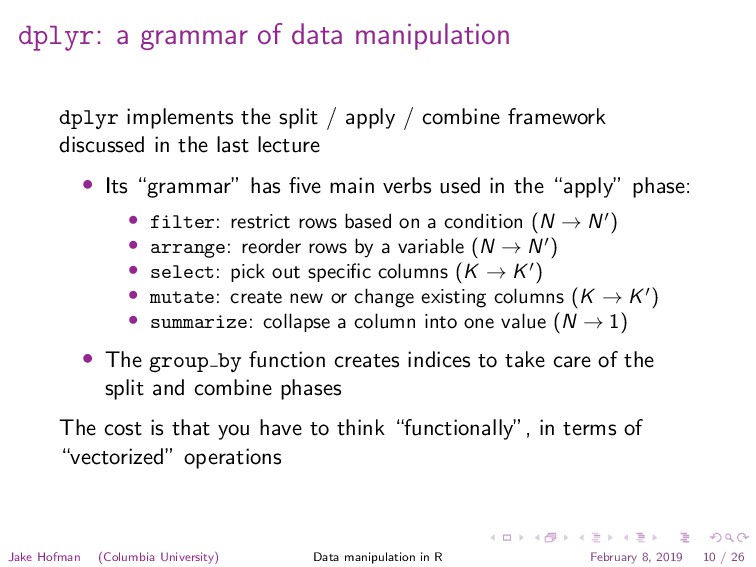
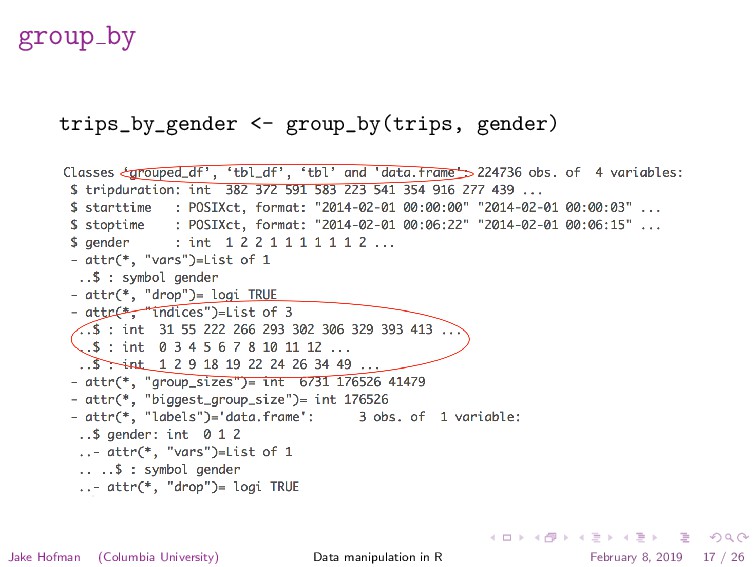
/ apply / combine framework discussed in the last lecture • Its “grammar” has five main verbs used in the “apply” phase: • filter: restrict rows based on a condition (N → N ) • arrange: reorder rows by a variable (N → N ) • select: pick out specific columns (K → K ) • mutate: create new or change existing columns (K → K ) • summarize: collapse a column into one value (N → 1) • The group by function creates indices to take care of the split and combine phases Jake Hofman (Columbia University) Data manipulation in R February 8, 2019 10 / 26
/ apply / combine framework discussed in the last lecture • Its “grammar” has five main verbs used in the “apply” phase: • filter: restrict rows based on a condition (N → N ) • arrange: reorder rows by a variable (N → N ) • select: pick out specific columns (K → K ) • mutate: create new or change existing columns (K → K ) • summarize: collapse a column into one value (N → 1) • The group by function creates indices to take care of the split and combine phases The cost is that you have to think “functionally”, in terms of “vectorized” operations Jake Hofman (Columbia University) Data manipulation in R February 8, 2019 10 / 26