Upgrade to Pro — share decks privately, control downloads, hide ads and more …

Carbon footprint of images on the web

Carbon footprint of images on the web

Talk prepared for Toronto Web Performance Group meetup:
In Commission to No Emissions: Conversations on Kb, Kw and Climate
https://www.meetup.com/Toronto-Web-Performance-Group/events/283332963/

Some stats from ImageEngine

Jon Arne Sæterås

February 07, 2022
Tweet

More Decks by Jon Arne Sæterås

Other Decks in Technology

Transcript

  1. VP a t im a geengine.io | @im a geCDN

    Carbon footprint of images Jon Arne Sæter å s 
 @jon a rnes
  2. of CO2 eq s a ved by Im a geEngine

    in December 2021 243 tonnes Same as from burning almost 900 barrels of gasoline or planting 4018 trees and let them grow for 10 years
  3. How to calculate Co2 footprint? 1. Find the kWh needed

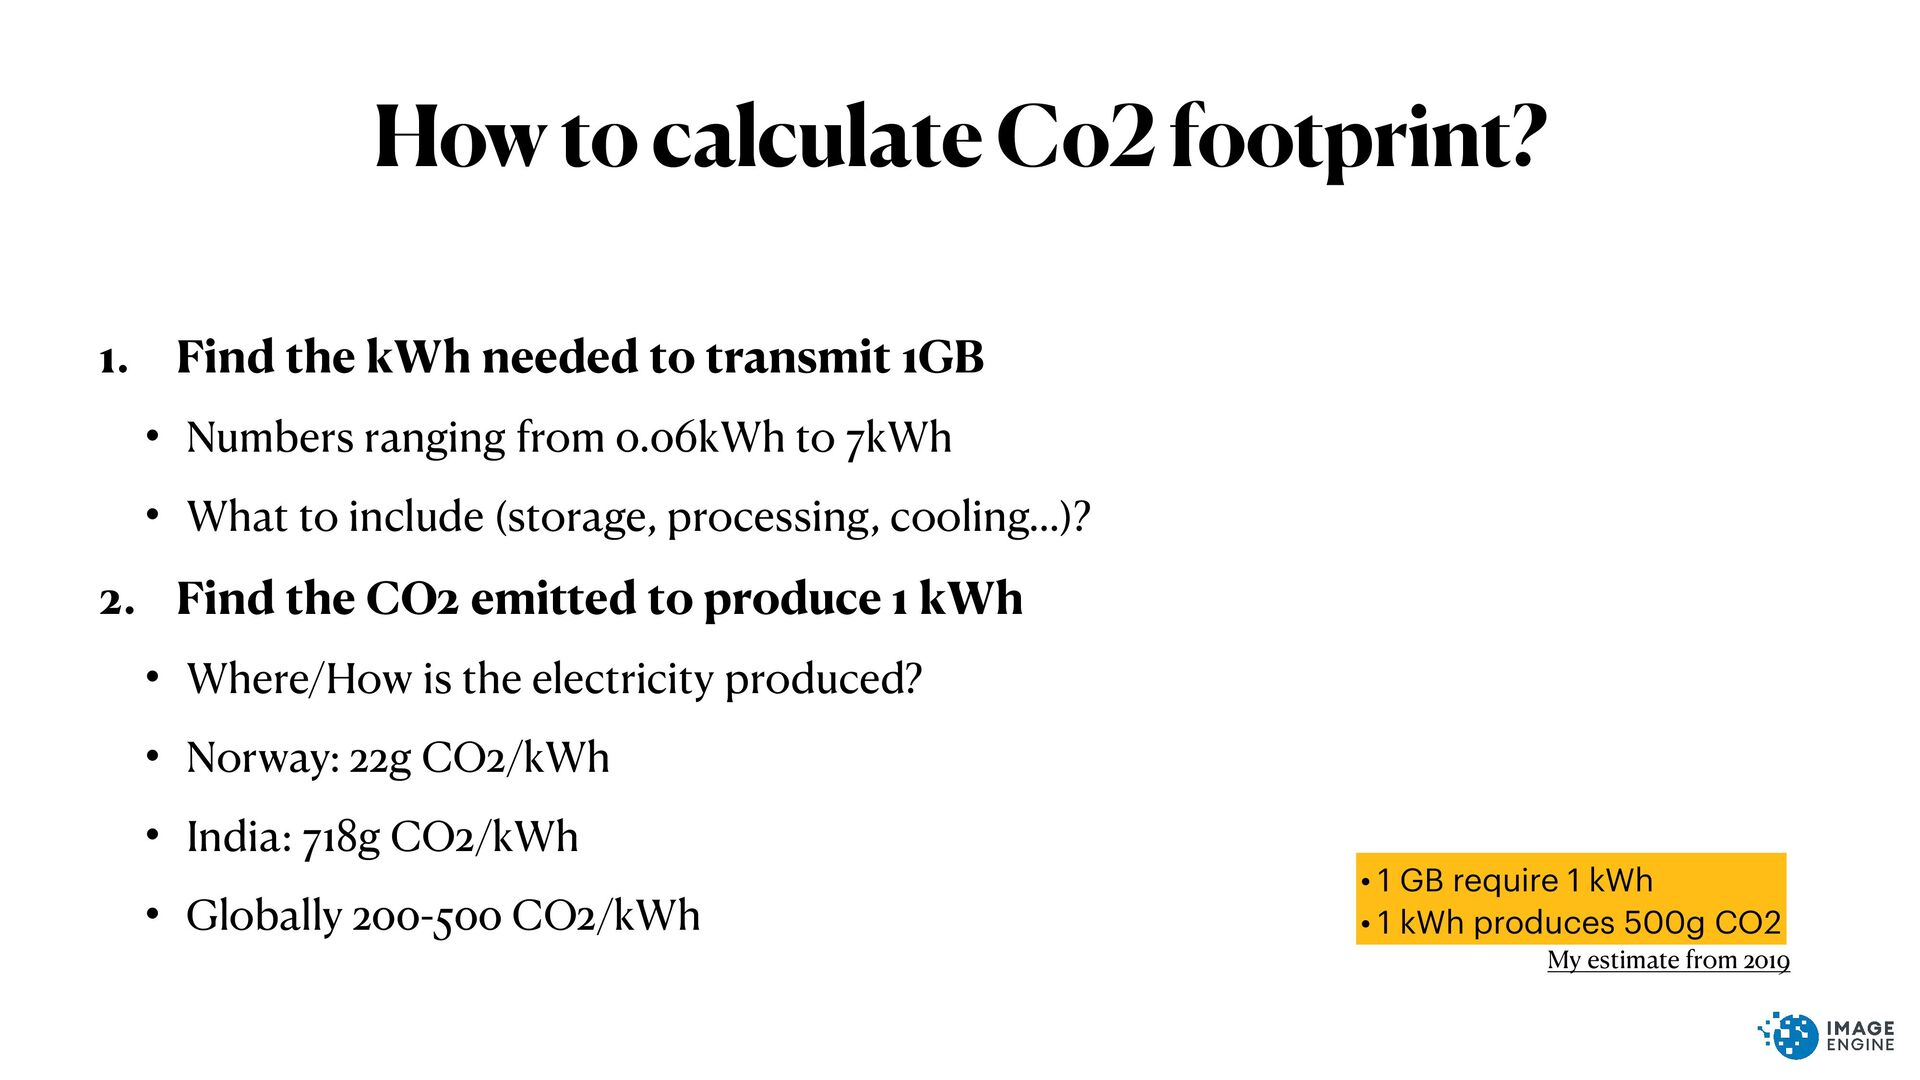
    to transmit 1GB • Numbers ranging from 0.06kWh to 7kWh • What to include (storage, processing, cooling…)? 2. Find the CO2 emitted to produce 1 kWh • Where/How is the electricity produced? • Norway: 22g CO2/kWh • India: 718g CO2/kWh • Globally 200-500 CO2/kWh • 1 GB require 1 kWh • 1 kWh produces 500g CO2 My estimate from 2019
  4. The system Mobile Desk/Laptop 2G 3G 4G Wi fi /ether

    Internet plumbing Processing Storage, backup 0.08 kWh/GB 37 kWh/GB 2.9kWh/GB 0.5 kWh/GB 0.08 kWh/GB 0,0316 kWh/GB 0,072 kWh/GB 0,0128 kWh/GB Shift Project: 36% 29% 35%
  5. ImageEngine Mobile a nd connectivity 25 % 75 % 4G

    3G and less 20 % 80 % Mobile connectivity Non-mobile 49 % 51 % Mobile connectivity Non-mobile Globally India Connectivity, India
  6. • 12 image variants are required to serve 95% of

    your users with the best image. (3 variants cover 75%) 0 20 40 60 80 100 120 1 3 5 7 9 11 13 15 17 19 21 23 25 27 29 31 33 35 37 39 41 43 45 47 49 51 53 55 57 59 61 63 65 Variants • 21% of requests have the “Save Data”/“Lite mode” enabled. 21 %
  7. • Converting JPEG → WEBP = >90% savings • Optimising

    JPEG → JPEG = >80% savings JPEG WEBP 0 25 50 75 100 JPEG JPEG (o) 0 25 50 75 100 • The byte saving potential of images is between 60-90% Original Optimized 0 25 50 75 100
  8. • Optimising PNG → WEBP = >95% savings 
 (why

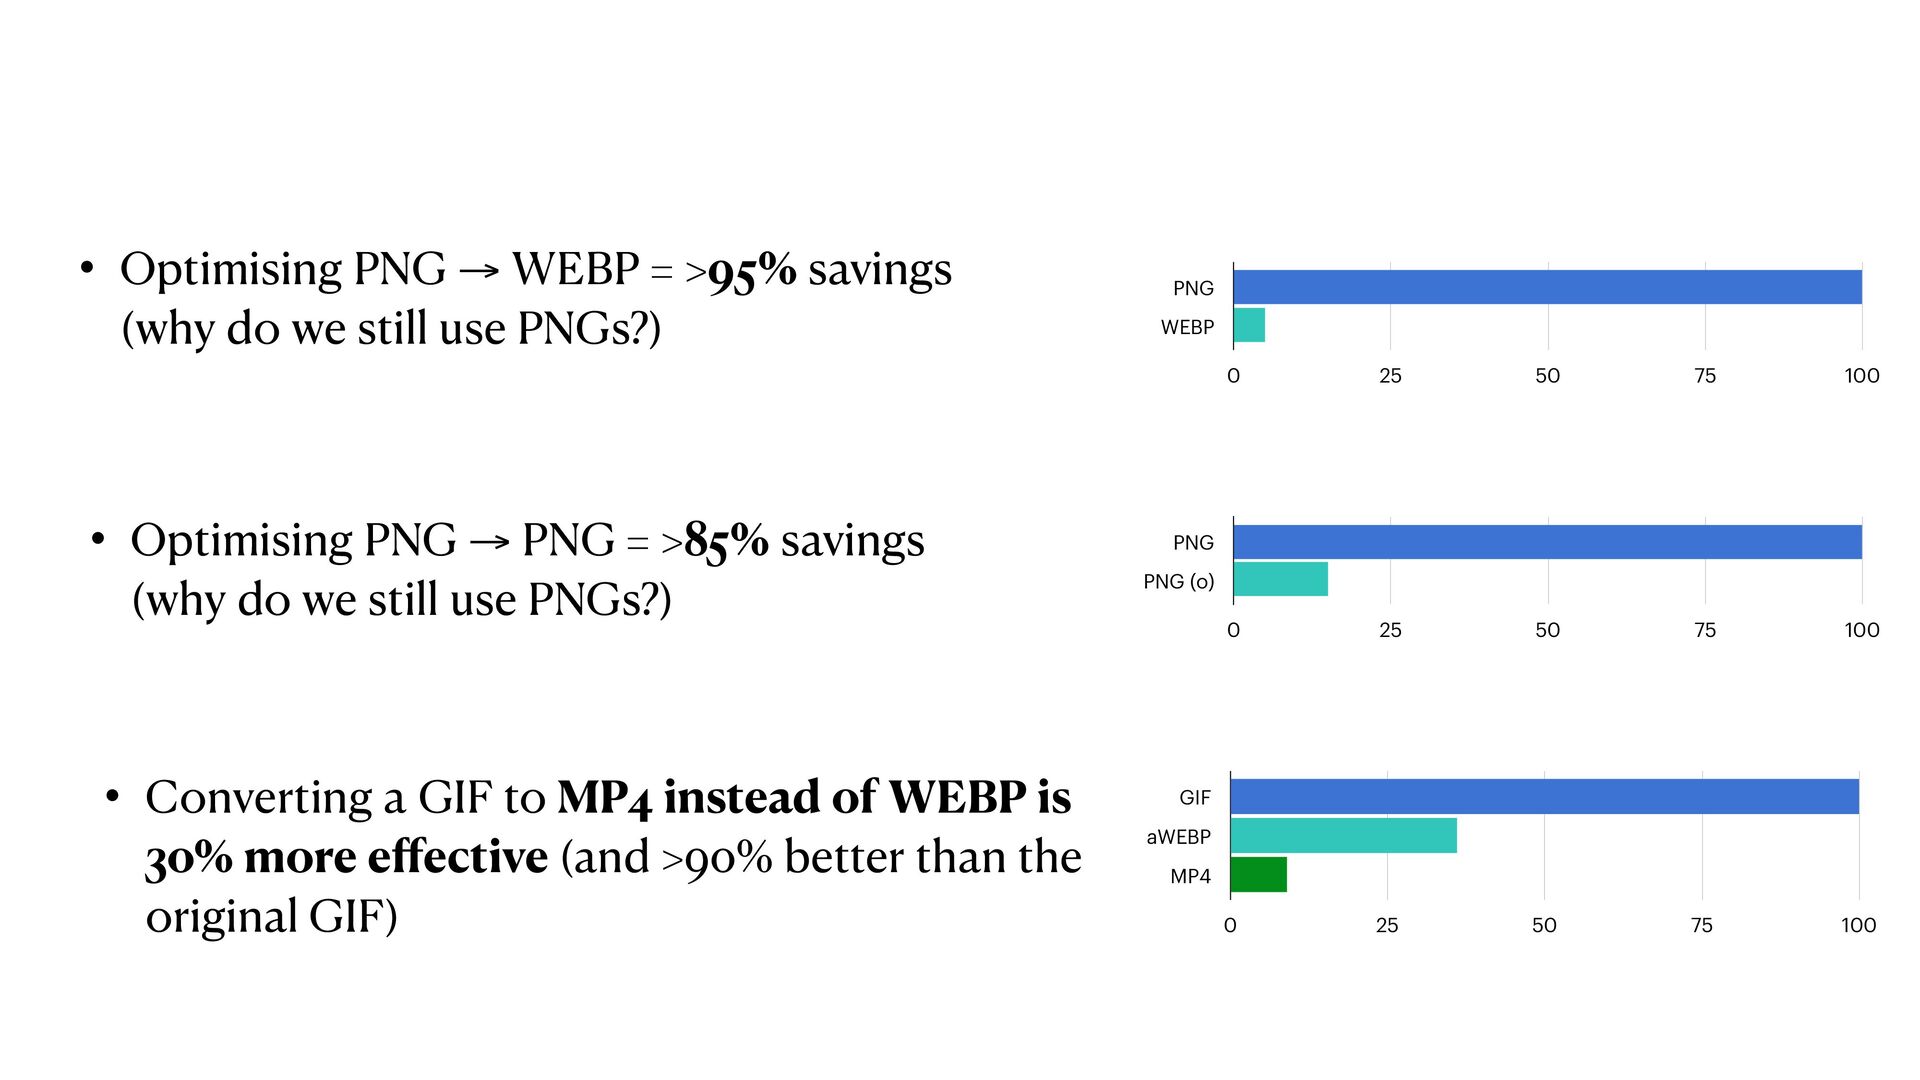
    do we still use PNGs?) • Optimising PNG → PNG = >85% savings 
 (why do we still use PNGs?) PNG WEBP 0 25 50 75 100 PNG PNG (o) 0 25 50 75 100 GIF aWEBP MP4 0 25 50 75 100 • Converting a GIF to MP4 instead of WEBP is 30% more e ff ective (and >90% better than the original GIF)
  9. • JPEG2000 in many cases perform better than WEBP and

    AVIF • AVIF? • Jury is still out… It’s a tradeo f between visual quality, byte size and encoding/decoding e ff i ciency.
  10. Bec a use it h a s to be tr

    a nsferred a nd stored Reduce Payload! <aside>Data centres may be “green”, but what’s the alternative use if that electricity?</aside>
  11. References • https://www.carbonbrief.org/factcheck-what-is-the-carbon-footprint-of-streaming-video-on-net fl ix • https://www.mdpi.com/2071-1050/10/7/2494/htm • https://www.epa.gov/energy/greenhouse-gas-equivalencies-calculator •

    https://app.electricitymap.org/ • https://www.iea.org/reports/global-energy-co2-status-report-2019/emissions • https://theshiftproject.org/en/home/ • https://energyinnovation.org/2020/03/17/how-much-energy-do-data-centers-really-use/ • https://www.cmswire.com/digital-experience/calculating-the-pollution-e ff ect-of-data/ • https://www.mdpi.com/2078-1547/6/1/117/htm • https://onlinelibrary.wiley.com/doi/10.1111/jiec.12630 • https://www.wholegraindigital.com/blog/website-energy-consumption/