Upgrade to Pro — share decks privately, control downloads, hide ads and more …

Metric-Driven Coaching

Metric-Driven Coaching

W. Edwards Deming said, “You can’t manage what you can’t measure.” But how do you know if you’re measuring the right things? All too often teams fall prey to misleading metrics, missing invaluable opportunities to grow and improve.

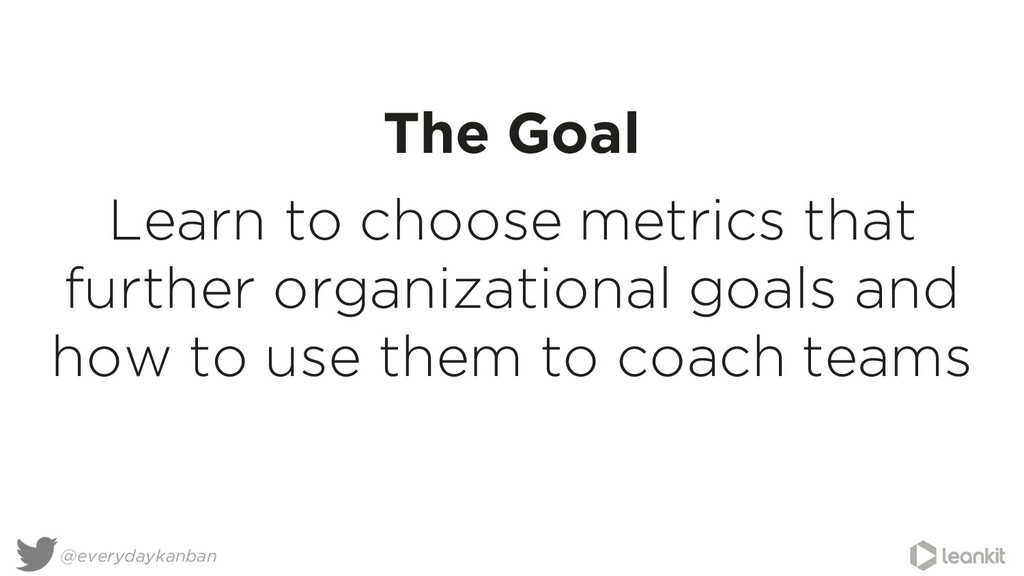
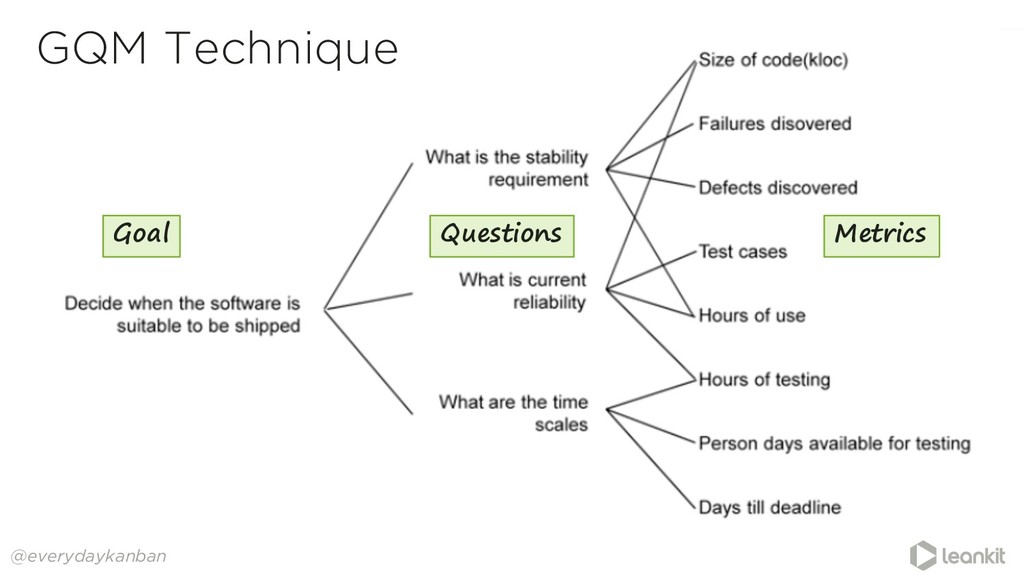
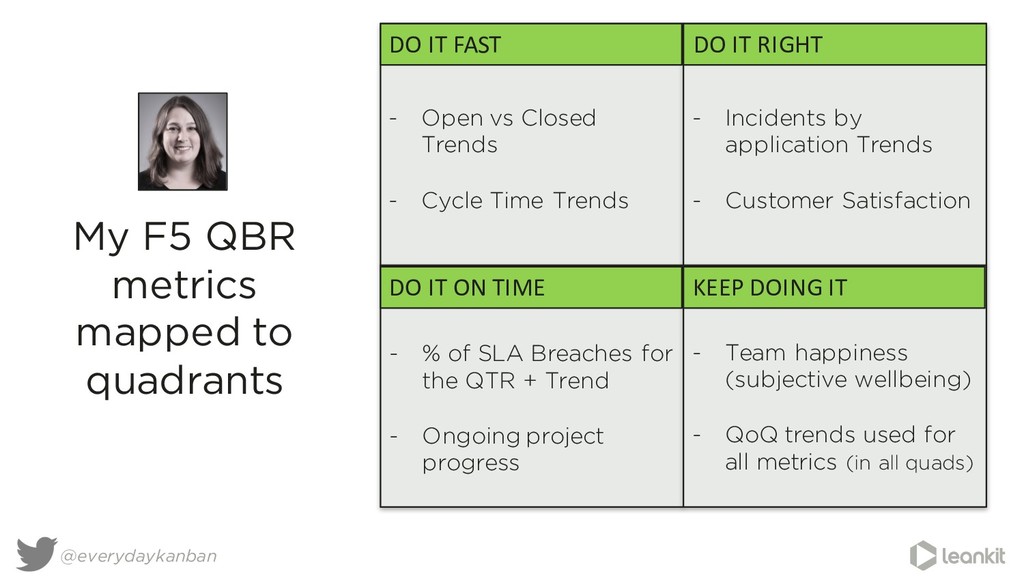
In this webinar, I’ll show you how to choose the right metrics to measure your team’s effectiveness and encourage the right behaviors. Then, I’ll explain how metric-driven coaching can help teams understand their process and highlight areas for improvement.

Julia Wester
PRO

March 23, 2016
Tweet

More Decks by Julia Wester

Other Decks in Business

Transcript

  1. Metric-Driven Coaching

    View Slide

  2. Julia Wester
    Improvement Coach
    LeanKit
    @everydaykanban

    View Slide

  3. @everydaykanban
    A bit about me…

    View Slide

  4. @everydaykanban
    Why
    Metric-Driven

    View Slide

  5. Learn to choose metrics that
    further organizational goals and
    how to use them to coach teams
    @everydaykanban
    The Goal

    View Slide

  6. @everydaykanban
    Anyone who…
    § Gathers metrics
    § Does things that are
    measured
    § Just wants to learn
    more about metrics
    Who should care
    about this topic?

    View Slide

  7. The Basics
    of Metrics
    @everydaykanban

    View Slide

  8. @everydaykanban
    Source: http://zeshanjaffari.com

    View Slide

  9. Analytics are
    expensive,
    invest wisely
    @everydaykanban

    View Slide

  10. @everydaykanban
    Measuring everything obscures
    what is truly important

    View Slide

  11. Start with
    a clear goal
    and make
    a metrics
    diagnosis
    @everydaykanban

    View Slide

  12. @everydaykanban

    View Slide

  13. @everydaykanban
    KNOW YOUR

    View Slide

  14. GQM Technique
    @everydaykanban
    Goal Questions Metrics

    View Slide

  15. @everydaykanban
    Symptoms of dangerously
    wielding metrics

    View Slide

  16. Symptom:
    We think it
    shows
    something it
    doesn’t
    @everydaykanban
    I sure do
    get a lot
    done!
    I add so
    much
    value!

    View Slide

  17. @everydaykanban

    View Slide

  18. @everydaykanban
    Symptom:
    We think
    that a metric
    never
    expires

    View Slide

  19. @everydaykanban
    Symptom: We think shame corrects behavior

    View Slide

  20. Symptom:
    We think
    focusing on
    individuals
    makes great
    team members
    @everydaykanban

    View Slide

  21. What you measure
    shows what you value
    @everydaykanban

    View Slide

  22. Avoiding metrics
    minefields
    @everydaykanban

    View Slide

  23. Does it:
    • matter to my customer?
    • help me make a decision
    or take action?
    Make sure it passes
    the “So What?” test
    @everydaykanban

    View Slide

  24. @everydaykanban
    Measure team
    performance
    over individuals

    View Slide

  25. Understand the
    danger-to-value
    ratio
    @everydaykanban

    View Slide

  26. @everydaykanban
    Keep a
    balanced set
    of metrics
    Source: Larry Maccherone

    View Slide

  27. @everydaykanban
    My F5 QBR
    metrics
    mapped to
    quadrants
    DO  IT  FAST DO  IT  RIGHT
    DO  IT  ON  TIME KEEP  DOING  IT
    - Open vs Closed
    Trends
    - Cycle Time Trends
    - Incidents by
    application Trends
    - Customer Satisfaction
    - % of SLA Breaches for
    the QTR + Trend
    - Ongoing project
    progress
    - Team happiness
    (subjective wellbeing)
    - QoQ trends used for
    all metrics (in all quads)

    View Slide

  28. Visualization matters
    • Show metrics together on a dashboard
    • Use soft colors, avoid red & green
    • Visually focus on trends, not data points
    • Compare using trends, not numbers
    • Tailor the visualization for different audiences
    @everydaykanban

    View Slide

  29. @everydaykanban
    Invite exploration using visual appeal

    View Slide

  30. Your set of metrics should fit your unique context and problems.
    No one has the perfect set of metrics that blindly apply to all teams.
    @everydaykanban

    View Slide

  31. What about LeanKit’s
    metrics?
    @everydaykanban

    View Slide

  32. @everydaykanban
    LeanKit
    Metrics

    View Slide

  33. @everydaykanban

    View Slide

  34. @everydaykanban

    View Slide

  35. @everydaykanban

    View Slide

  36. Take your LeanKit data and
    create reports in Tableau
    that give insight into
    your specific context
    and help solve
    your specific problems.
    Custom Reporting

    View Slide

  37. @everydaykanban
    Balanced
    dashboard
    with
    coaching
    advice…
    that
    changes as
    the data
    changes
    Source: Troy Magennis, Focused Objective

    View Slide

  38. Takeaways
    @everydaykanban
    § Know your problem & map the GQM (goals-questions-metrics)
    § Measure teams rather than individuals
    § Understand the risk/reward ratio of each metric
    § Choose & display a balanced set of metrics
    § Coach teams to make appropriate trade-offs
    § Regularly search for and replace expired metrics

    View Slide

  39. References
    @everydaykanban
    Troy Magennis
    @t_magennis
    FocusedObjective.com
    PuppetLabs &
    IT REVOLUTION
    @PuppetLabs
    #StateOfDevOps
    Victor Basili
    Goal-Question-
    Metrics
    Larry Maccherone
    @LMaccherone
    Patrick
    Lencioni
    The Advantage

    View Slide

  40. @everydaykanban

    View Slide

  41. www.leankit.com
    ©2015 LeanKit Inc.

    View Slide