Upgrade to Pro — share decks privately, control downloads, hide ads and more …

MI_intro

 MI_intro

University of Michigan tutorial- Introduction

Julia Wrobel

March 20, 2023
Tweet

More Decks by Julia Wrobel

Other Decks in Education

Transcript

  1. What is single cell multiplex tissue imaging? • High dimensional

    analysis of tissue samples at the resolution of individual cells 2
  2. What is single cell multiplex tissue imaging? • Single cell

    refers to individual cell resolution 3
  3. What is single cell multiplex tissue imaging? • Multiplex refers

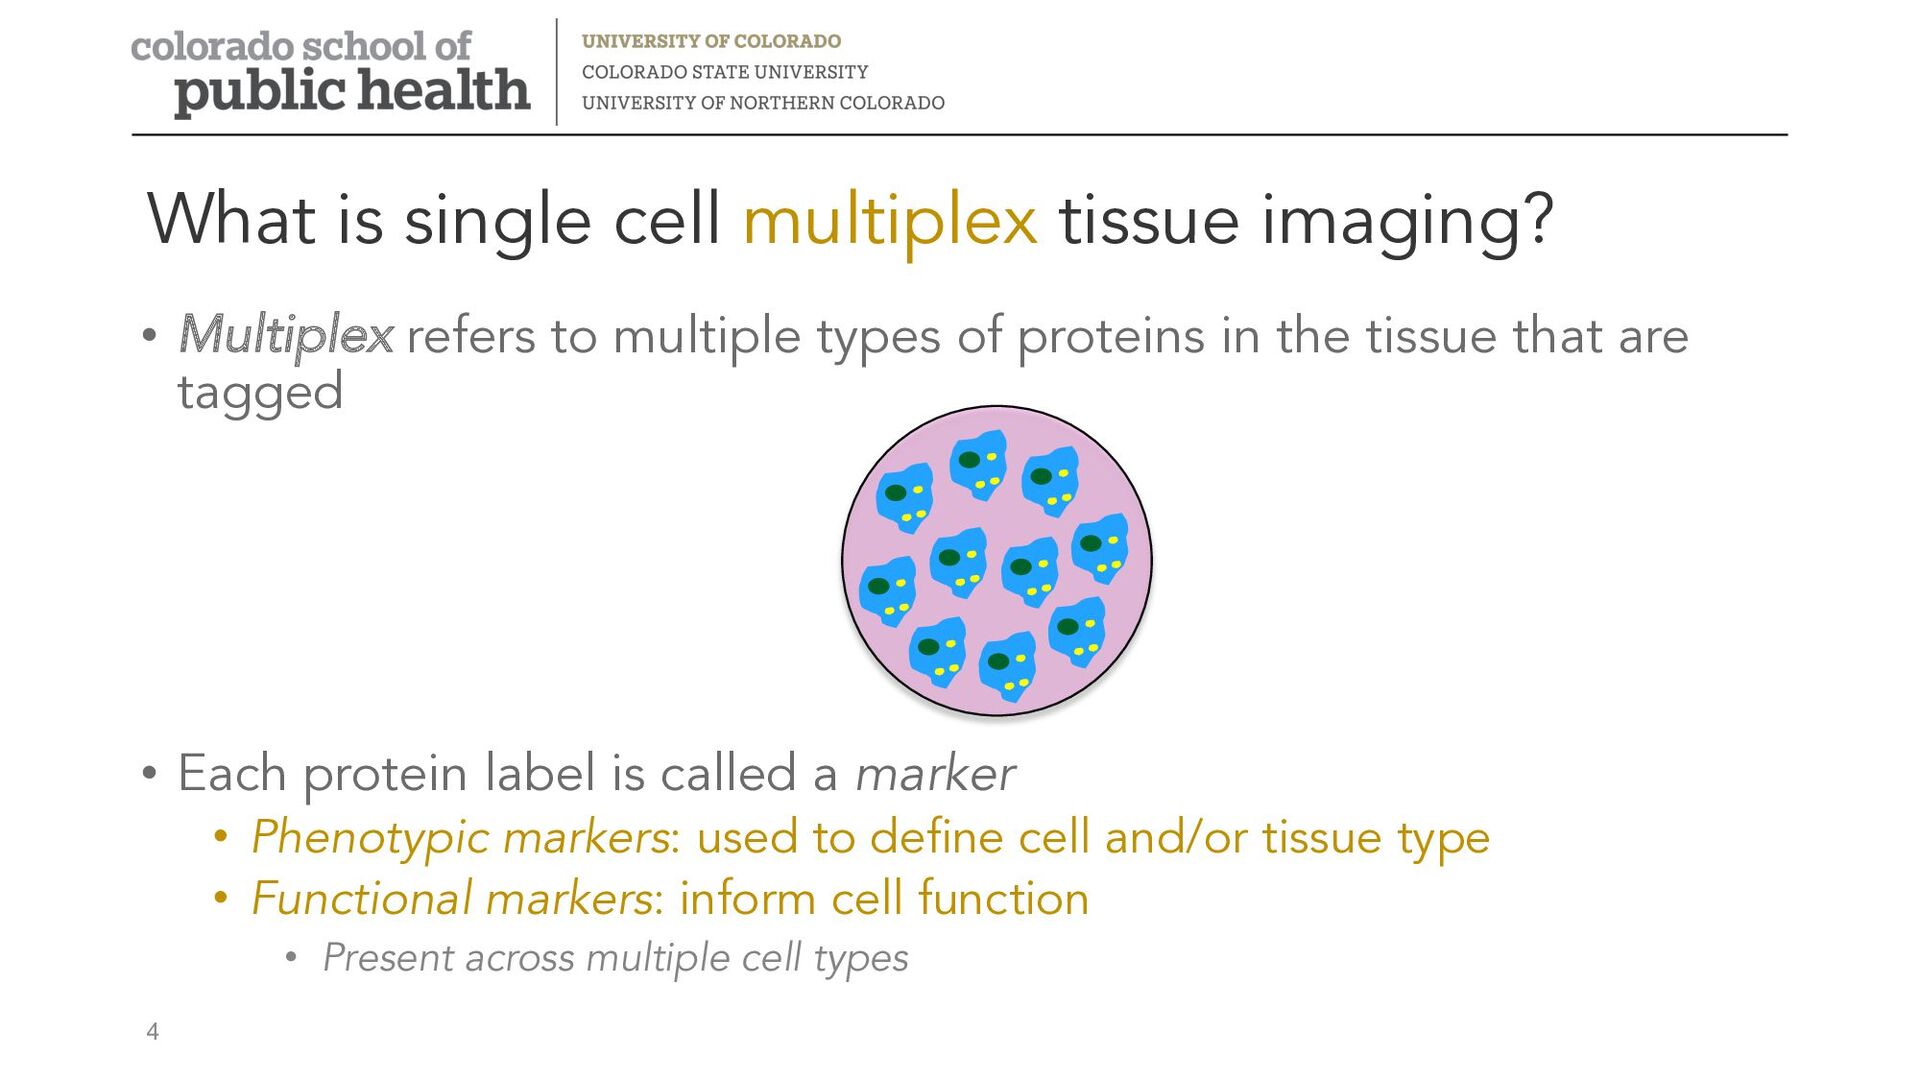
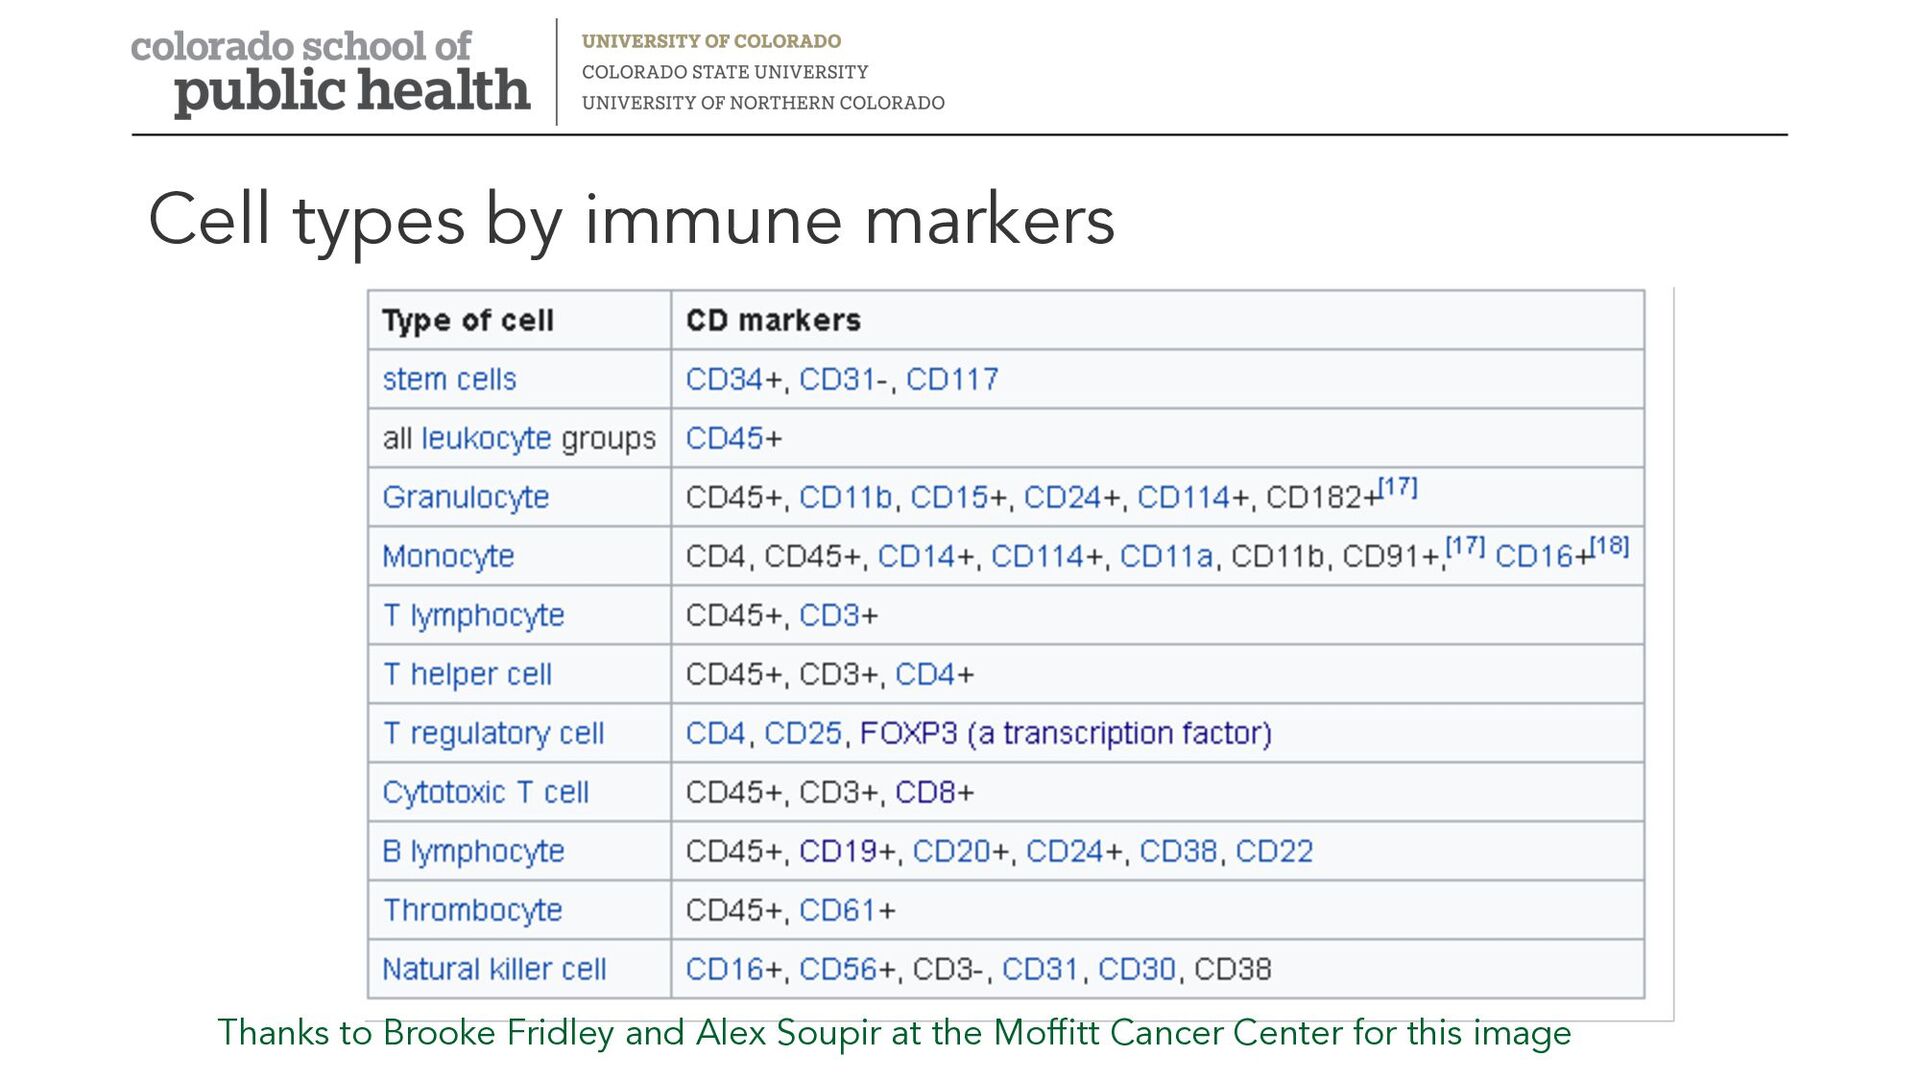
    to multiple types of proteins in the tissue that are tagged • Each protein label is called a marker • Phenotypic markers: used to define cell and/or tissue type • Functional markers: inform cell function • Present across multiple cell types 4
  4. What is single cell multiplex tissue imaging? • Multiplex refers

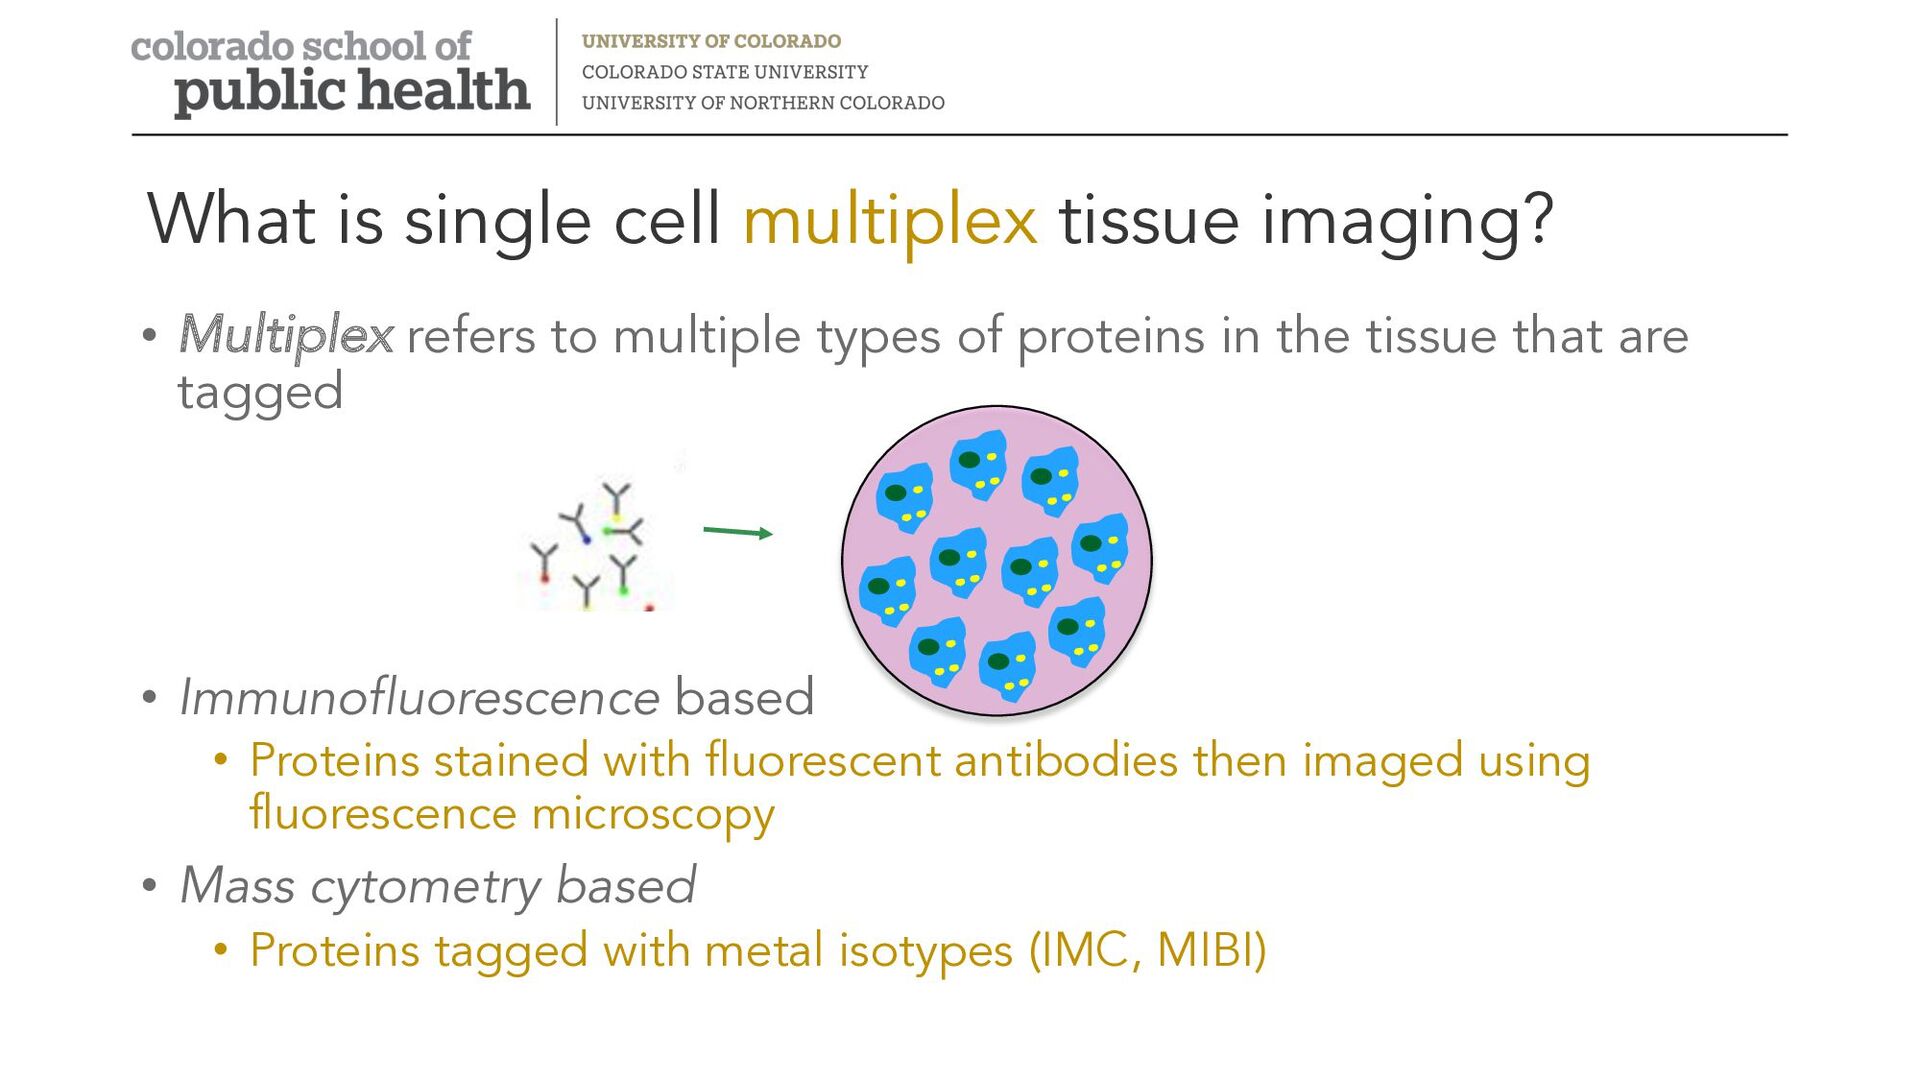
    to multiple types of proteins in the tissue that are tagged • Immunofluorescence based • Proteins stained with fluorescent antibodies then imaged using fluorescence microscopy • Mass cytometry based • Proteins tagged with metal isotypes (IMC, MIBI)
  5. What is single cell multiplex tissue imaging? • Imaging: biological

    spatial relationships in tissue are preserved • Precursor technologies required suspension of cells in solution, destroying spatial info 6
  6. What is single cell multiplex tissue imaging? • Images produced

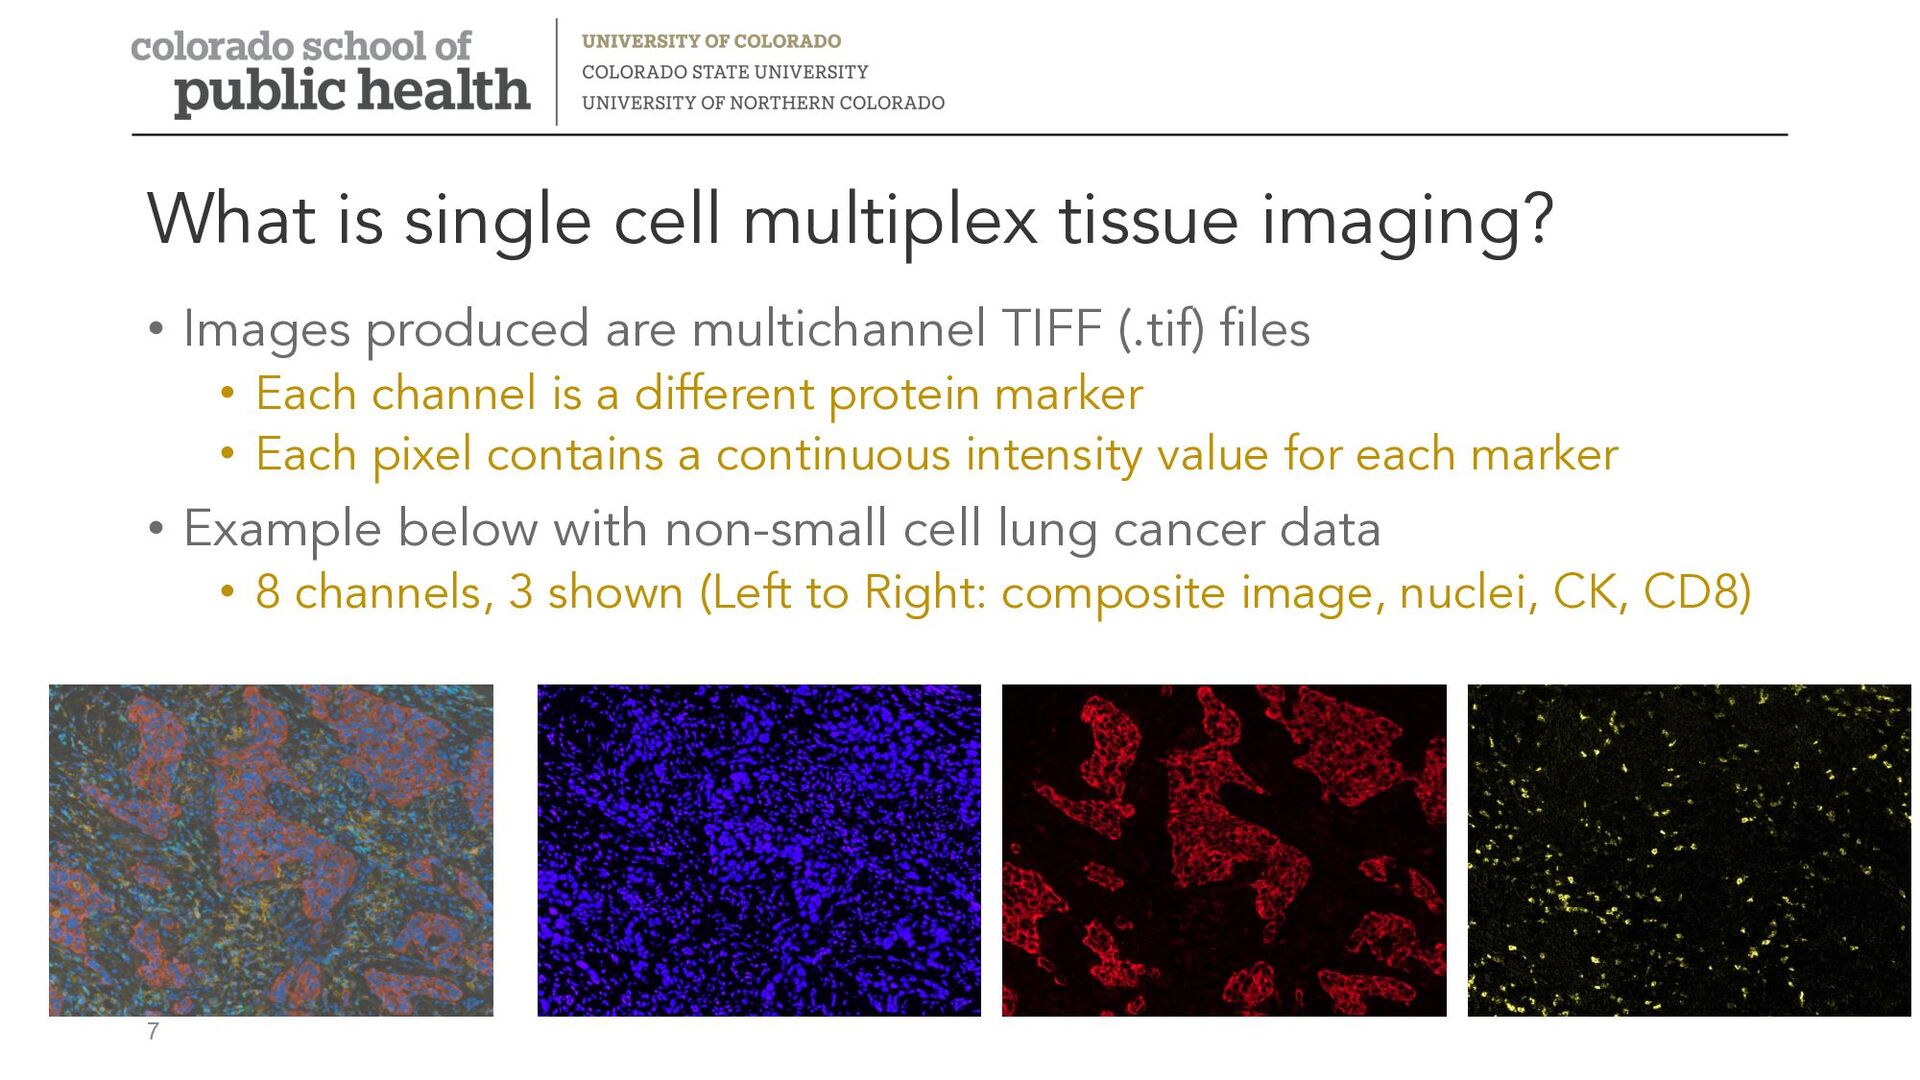
    are multichannel TIFF (.tif) files • Each channel is a different protein marker • Each pixel contains a continuous intensity value for each marker • Example below with non-small cell lung cancer data • 8 channels, 3 shown (Left to Right: composite image, nuclei, CK, CD8) 7
  7. A brief comparison of MI technologies Platform Class Throughput Multiplexicity

    Software Publications* Vectra-Polaris IF high ~8 markers Proprietary > 100 Discovery Ultra IF high 5+ markers Limited < 10 CyTOF Imaging IMC low 37+ MatLab > 35 MIBI IMC low 40+ Limited >5 CODEX Barcode -based low 40+ Limited/proprietary >1 * Since April 2020 8
  8. Cancer, multiplex imaging, and the tumor microenvironment The tumor microenvironment

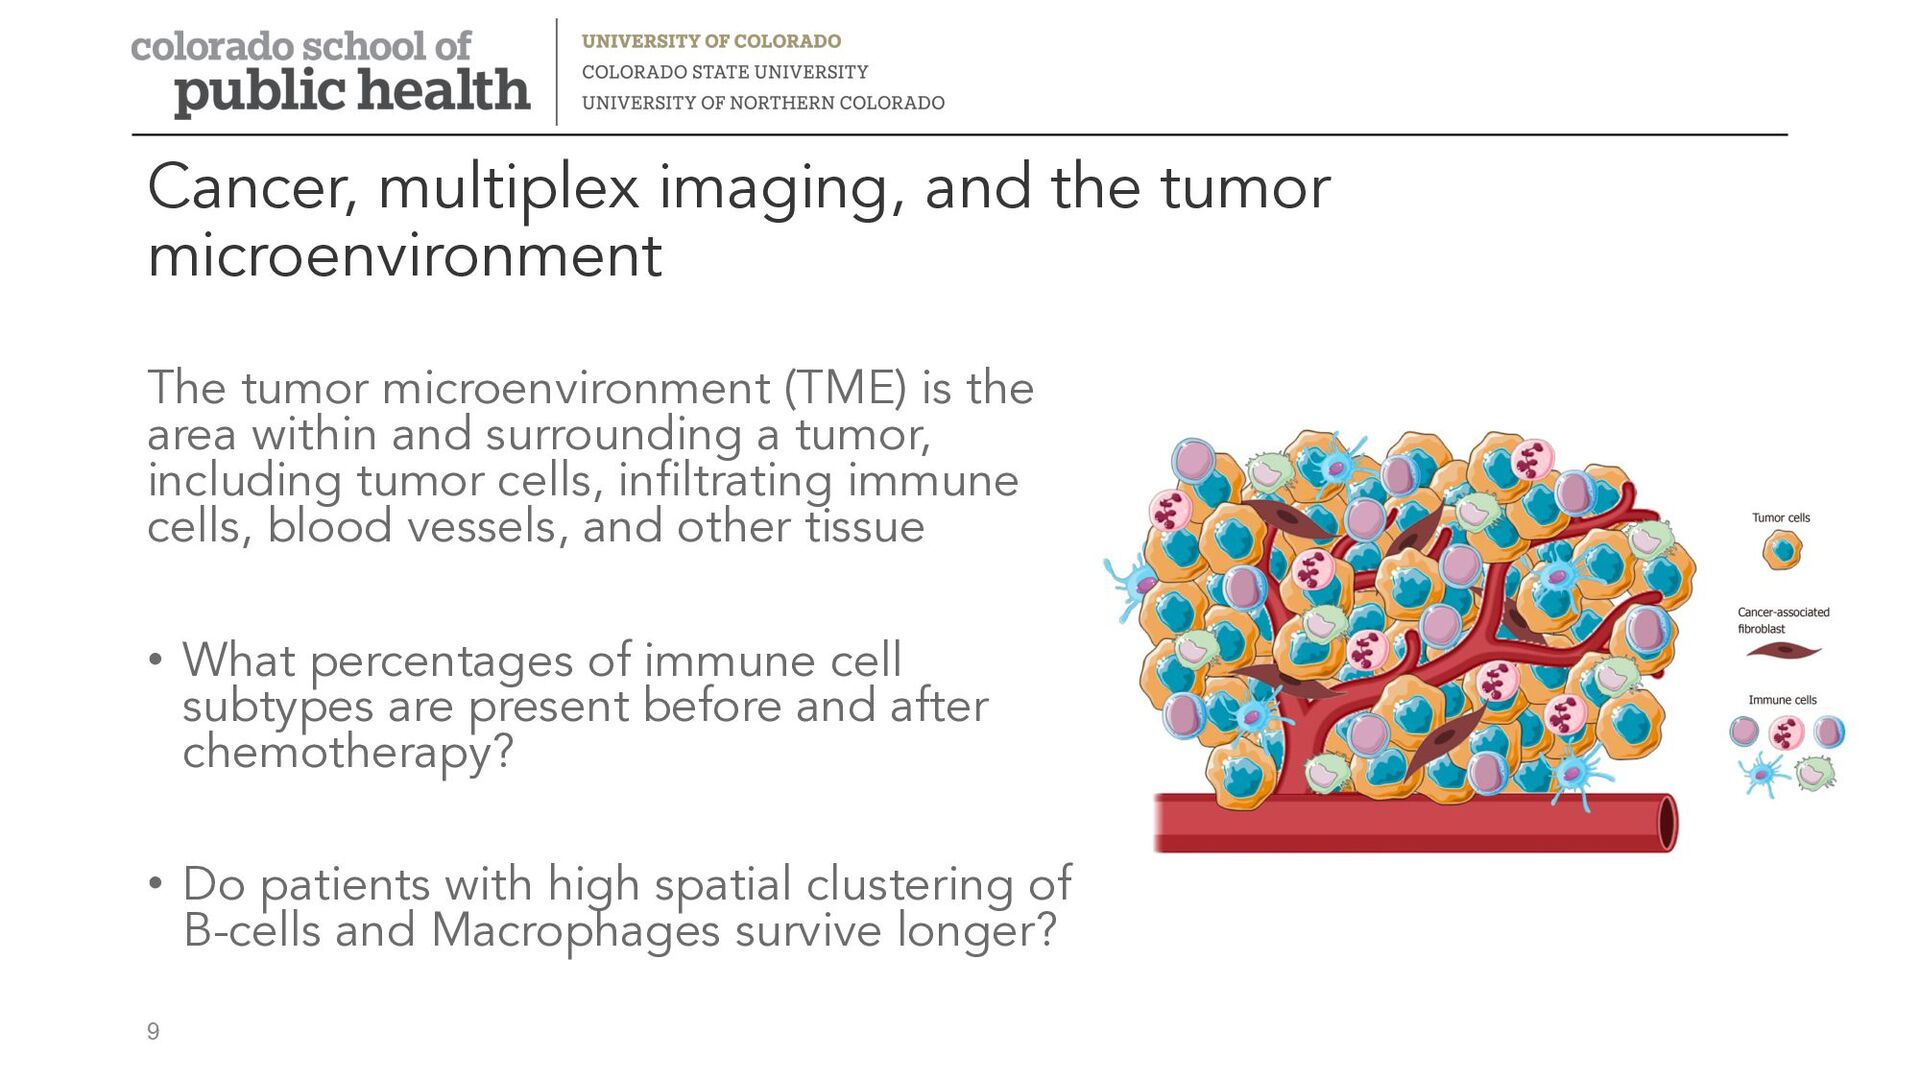
    (TME) is the area within and surrounding a tumor, including tumor cells, infiltrating immune cells, blood vessels, and other tissue • What percentages of immune cell subtypes are present before and after chemotherapy? • Do patients with high spatial clustering of B-cells and Macrophages survive longer? 9
  9. Multiplex image data processing and analysis pipeline Phenotyping Segmentation Normalization

    Image processing Compositional data analysis Spatial data analysis Statistical analysis Image acquisition Image filtering/ background correction Image pre-processing
  10. Image acquisition Image filtering/ background correction Multiplex image data processing

    and analysis pipeline Image acquisition Image filtering/ background correction Image pre-processing Phenotyping Segmentation Normalization Image processing
  11. Multiplex image data processing and analysis pipeline Cell 1 Pixel

    1 Marker a Marker b Pixel n Marker a Marker b Phenotyping Segmentation Normalization Image processing
  12. Cell types by immune markers Thanks to Brooke Fridley and

    Alex Soupir at the Moffitt Cancer Center for this image
  13. Multiplex image data processing and analysis pipeline Image ID Cell

    ID Tissue type Phenotype X Y Patient features 1 1 Stroma CD4 T-cell … … … 1 2 Stroma B-cell … … … 1 3 Tumor Macrophage … … … 1 4 Stroma CD8 T-cell … … … 2 1 Tumor Tumor cell … … … Phenotyping Segmentation Normalization Image processing
  14. Multiplex image data processing and analysis pipeline Image ID Cell

    ID Tissue type Phenotype X Y Patient features 1 1 Stroma CD4 T-cell … … … 1 2 Stroma B-cell … … … 1 3 Tumor Macrophage … … … 1 4 Stroma CD8 T-cell … … … 2 1 Tumor Tumor cell … … … Compositional data analysis Spatial data analysis Statistical analysis
  15. Multiplex image data processing and analysis pipeline Cell type, counts,

    proportions, or percentages Compositional data analysis Spatial data analysis Statistical analysis
  16. Multiplex image data processing and analysis pipeline Cell type, counts,

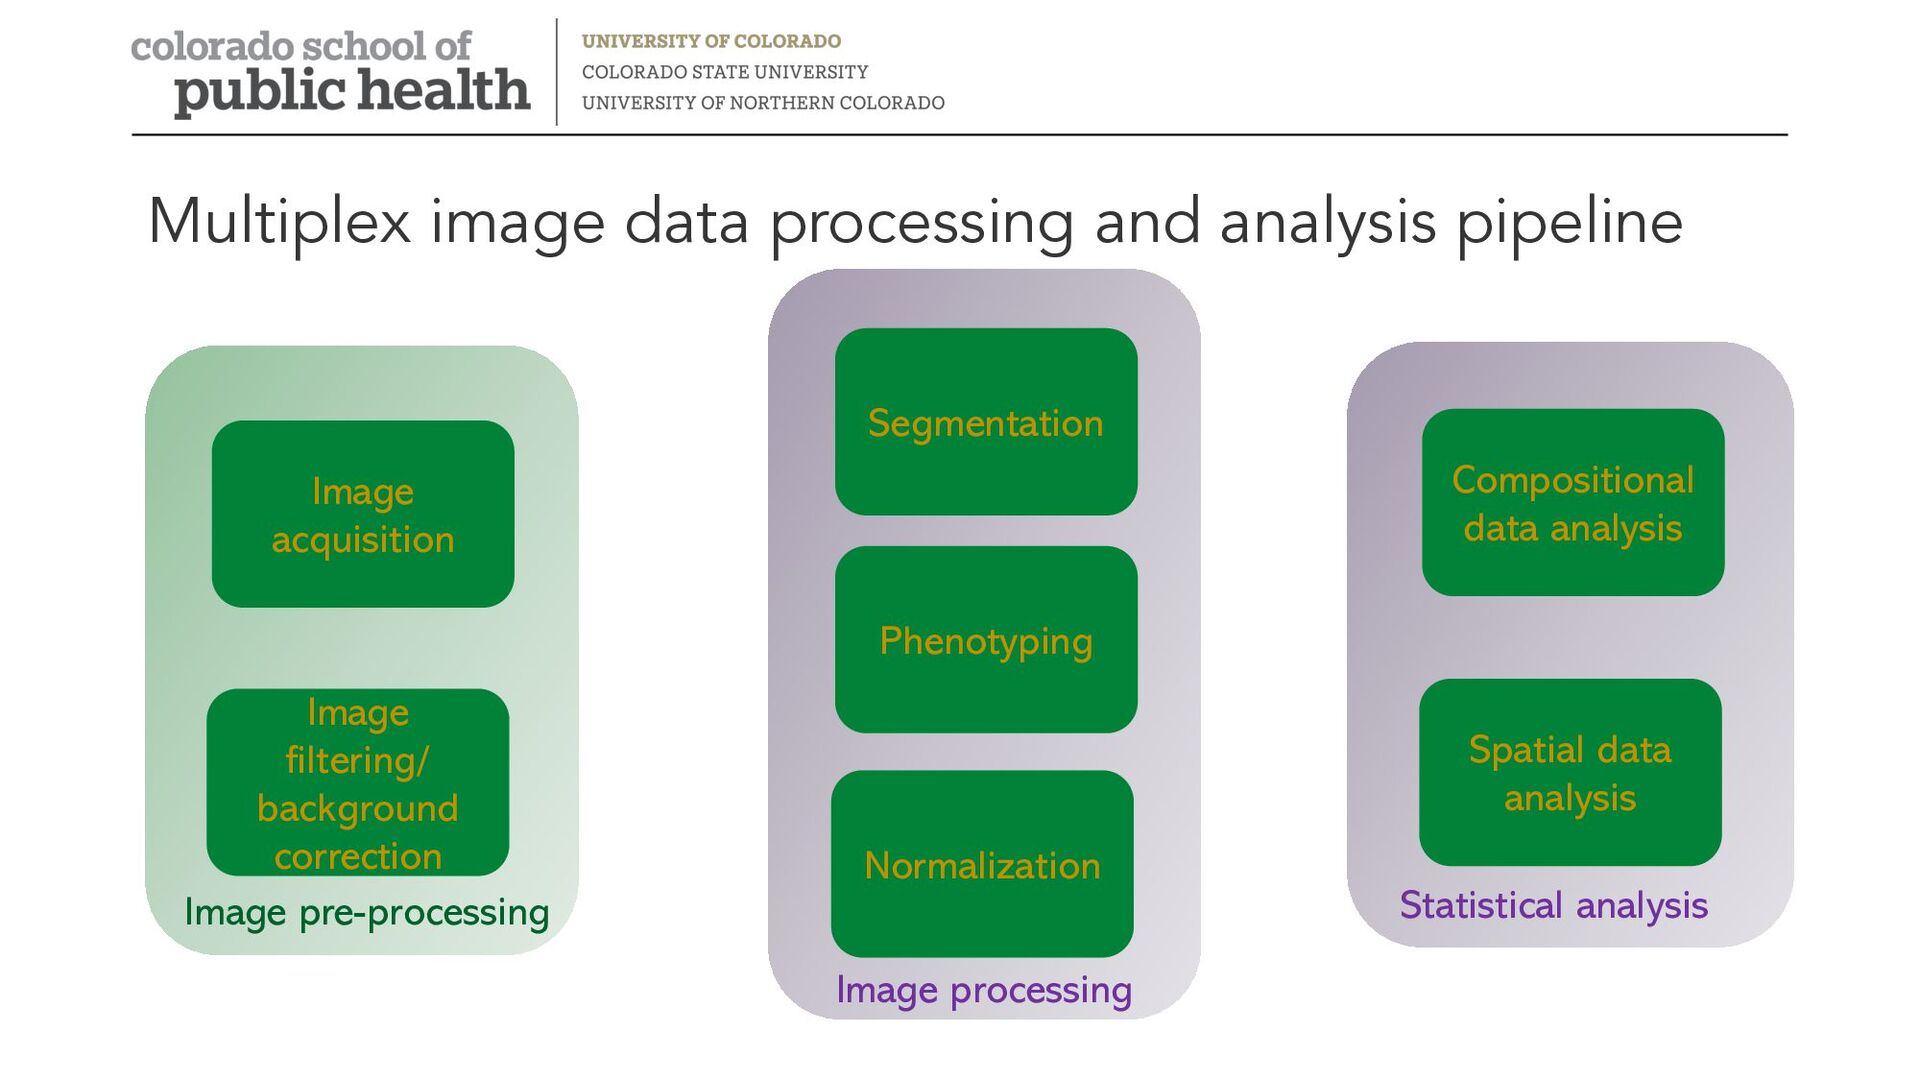
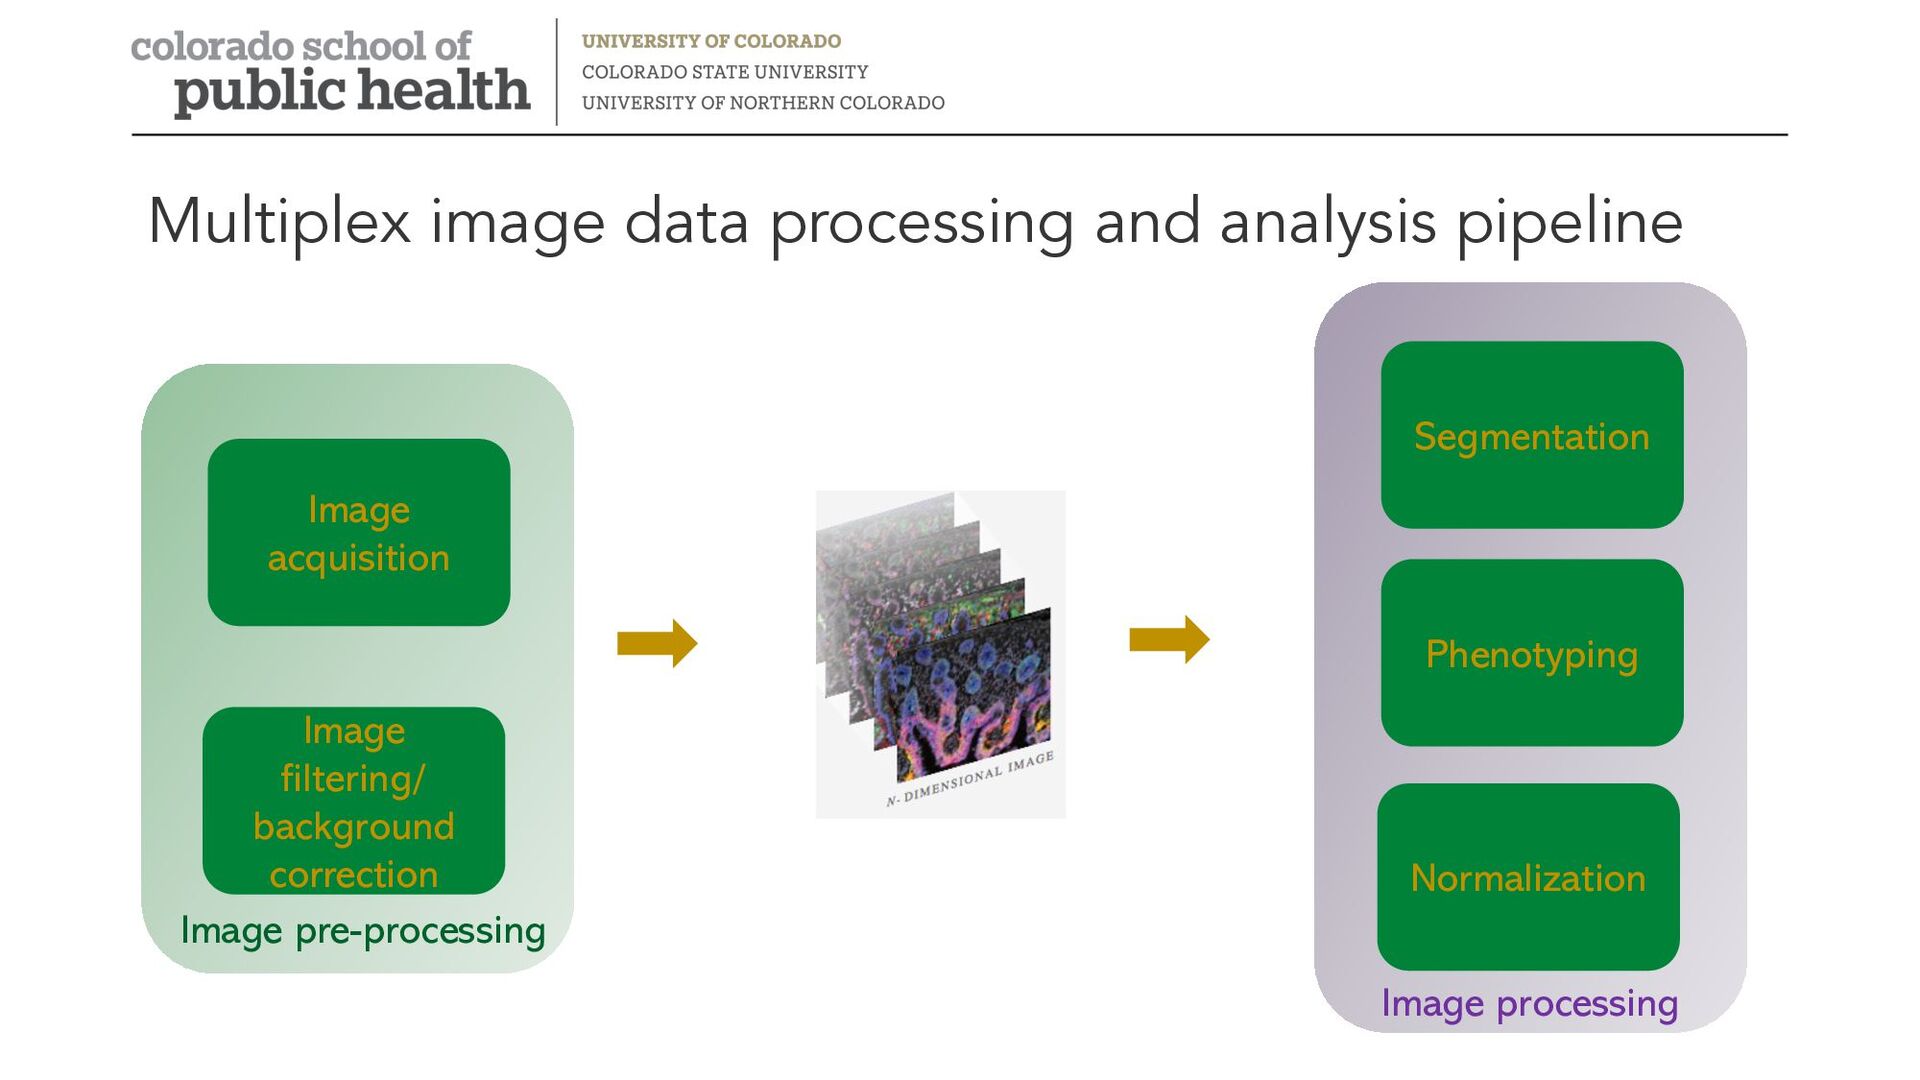
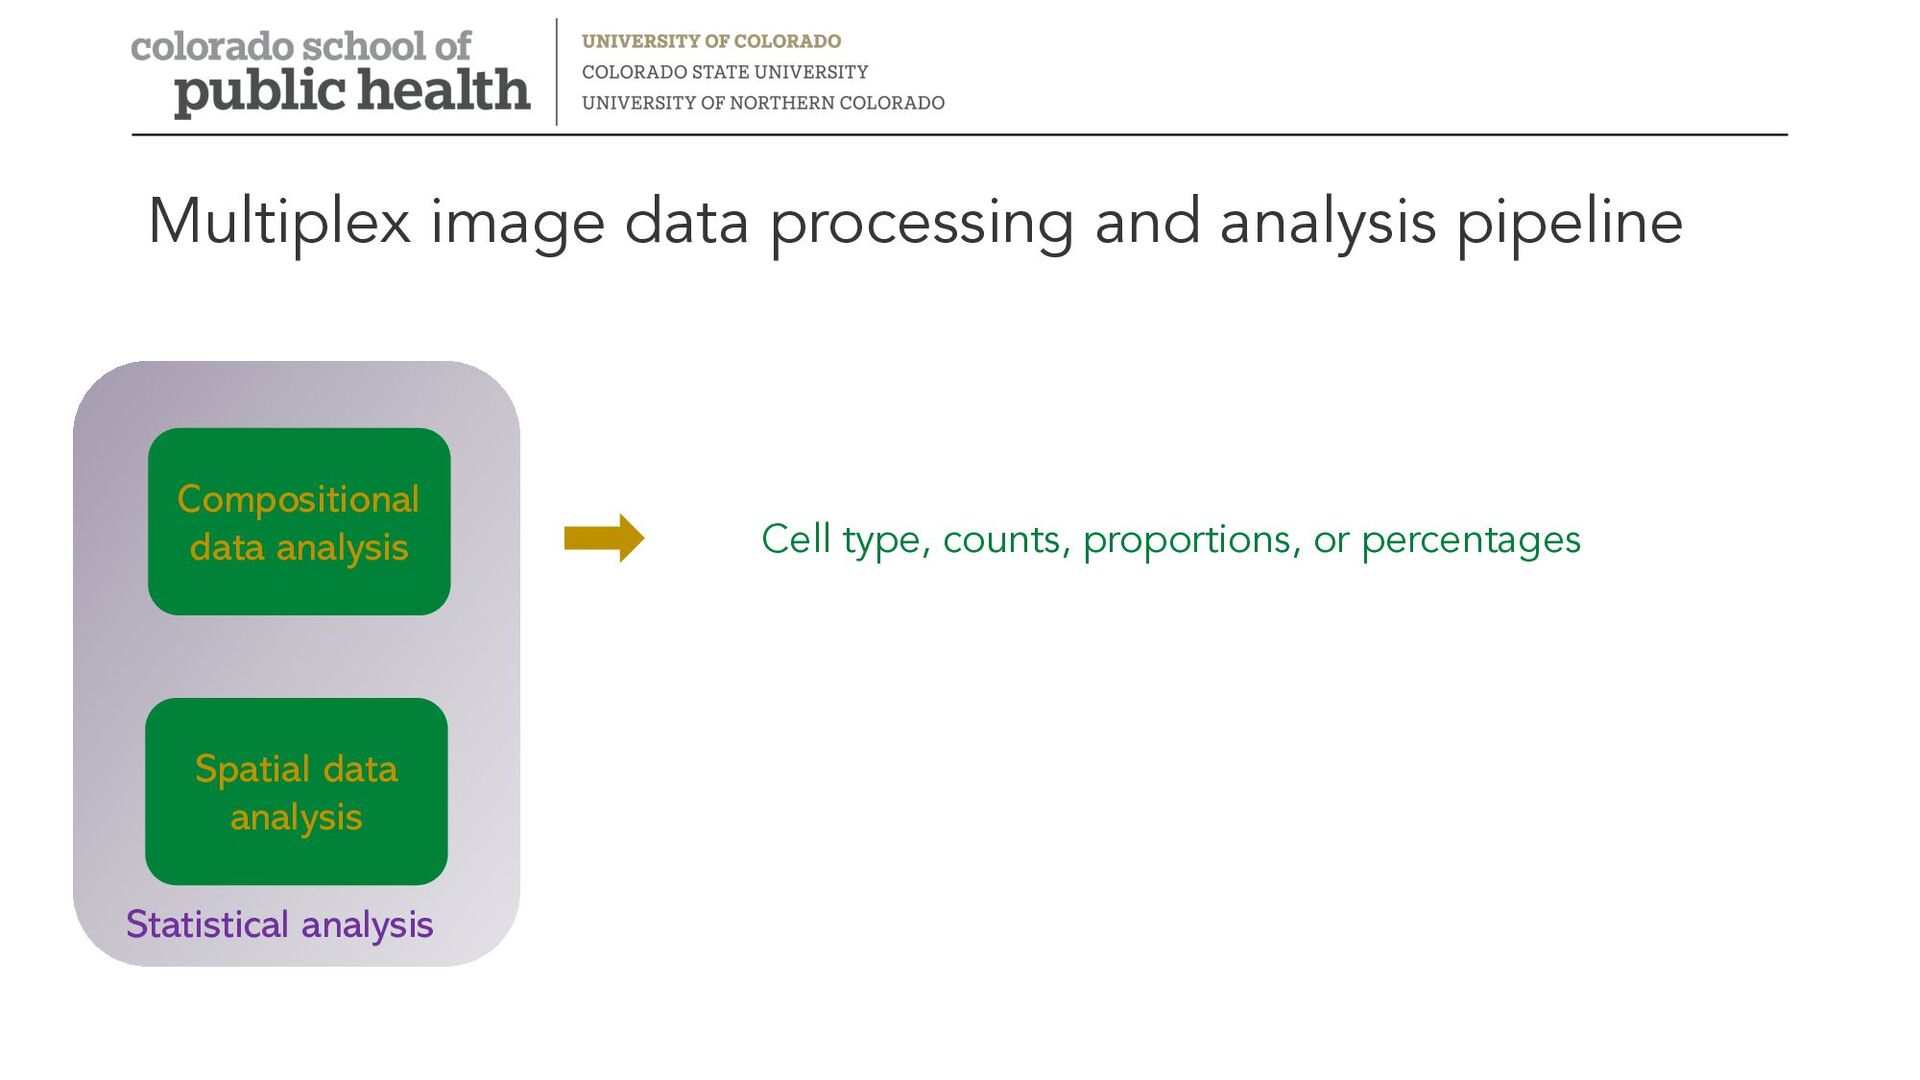
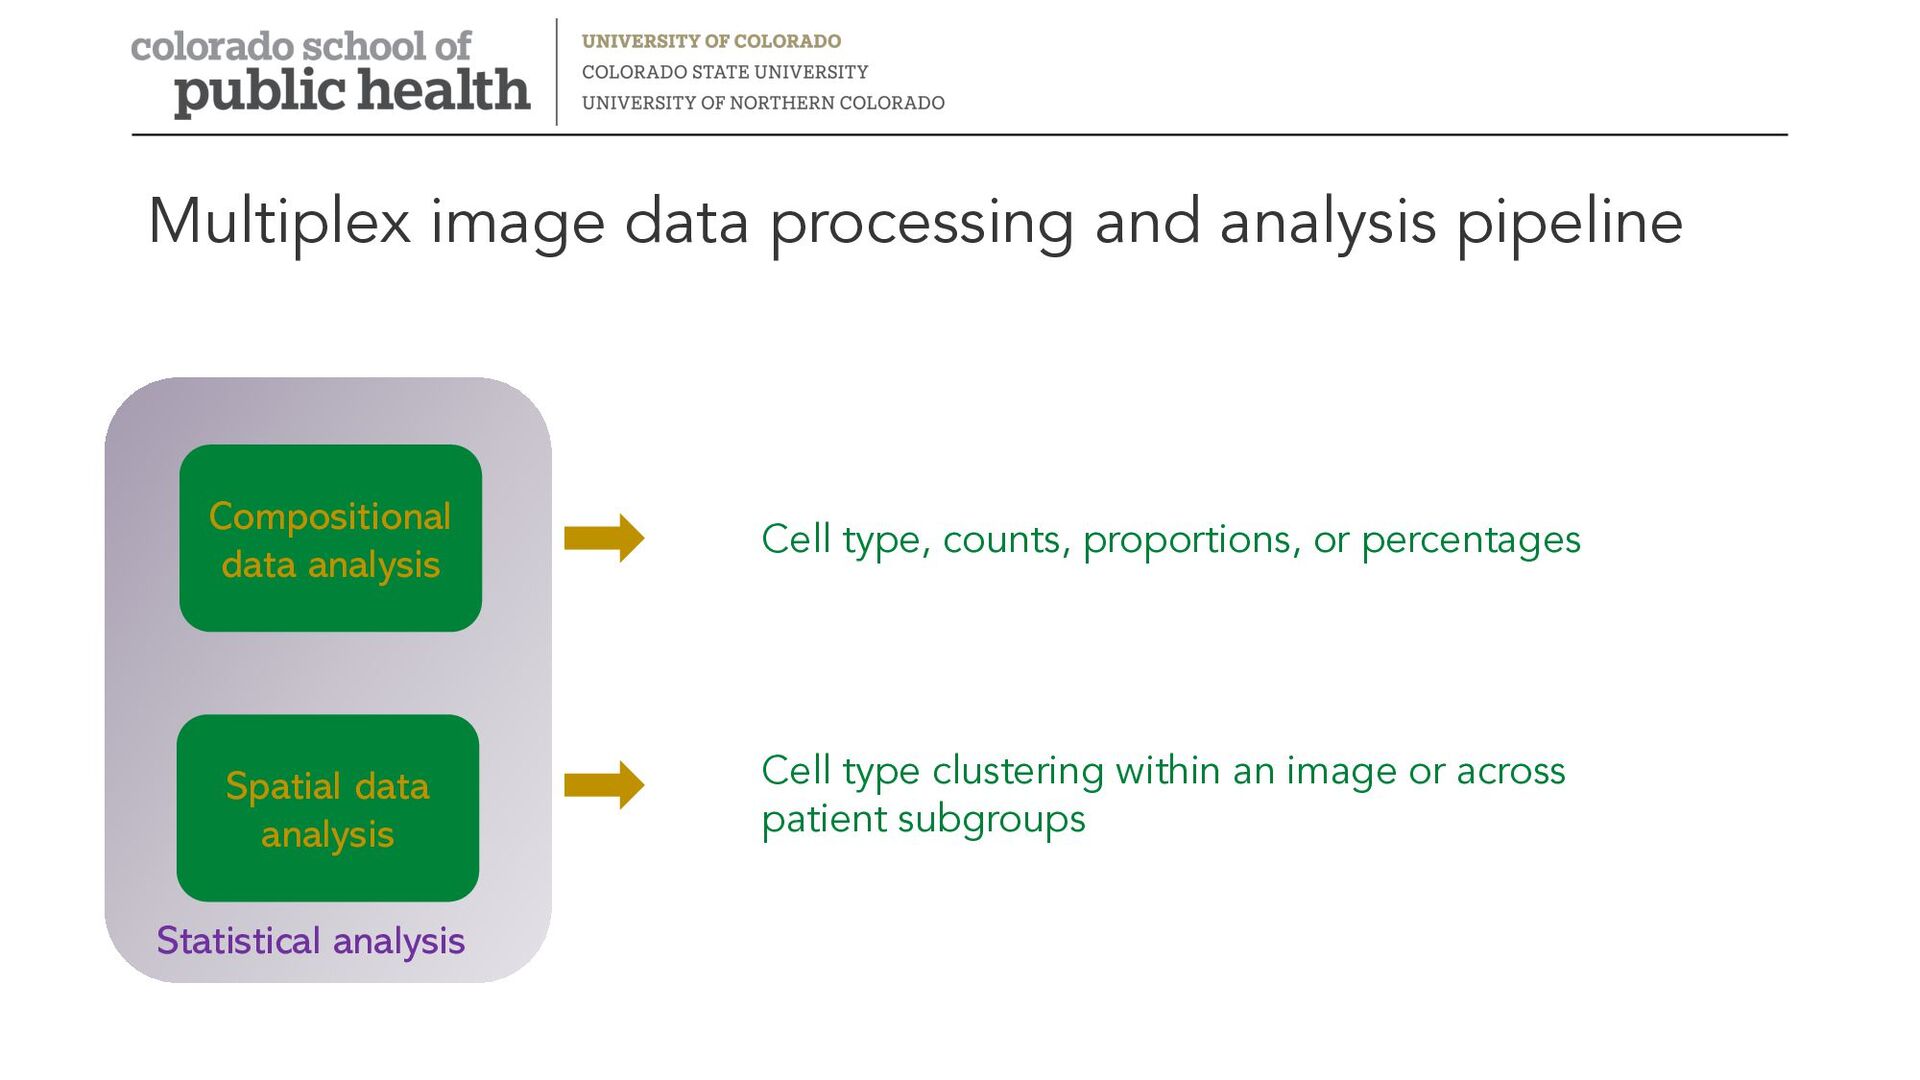
    proportions, or percentages Cell type clustering within an image or across patient subgroups Compositional data analysis Spatial data analysis Statistical analysis
  17. 1. Quantify characteristics / features of an image • Features:

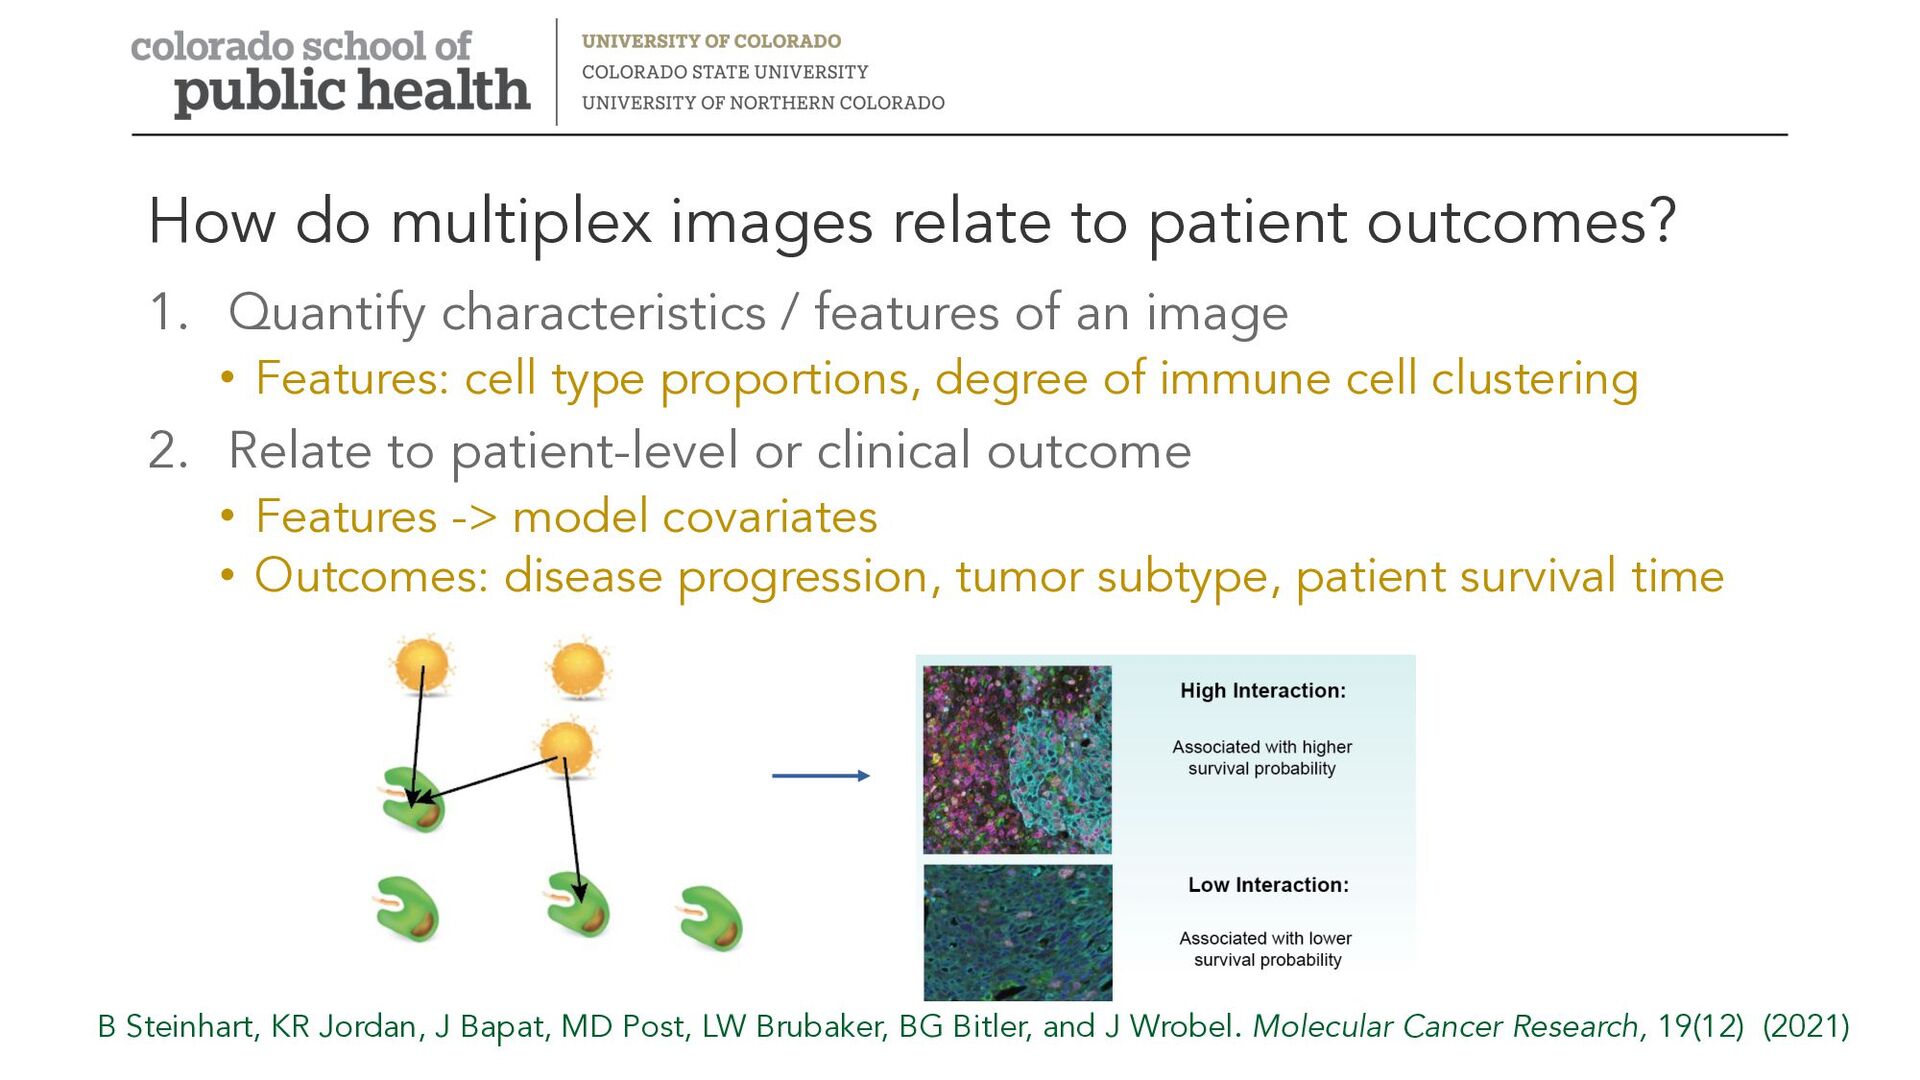
    cell type proportions, degree of immune cell clustering 2. Relate to patient-level or clinical outcome • Features -> model covariates • Outcomes: disease progression, tumor subtype, patient survival time How do multiplex images relate to patient outcomes? B Steinhart, KR Jordan, J Bapat, MD Post, LW Brubaker, BG Bitler, and J Wrobel. Molecular Cancer Research, 19(12) (2021)
  18. Shiny Boot Camp: Building Interactive Graphics and Dashboards in R

    • July 6-7, 2023; In-person training (NYC) • Two-day intensive course including seminars and hands-on coding sessions that teaches attendees to build interactive web applications in R • Instructor: Julia Wrobel (Colorado School of Public Health) • Scholarships available More info: publichealth.columbia.edu/Shiny