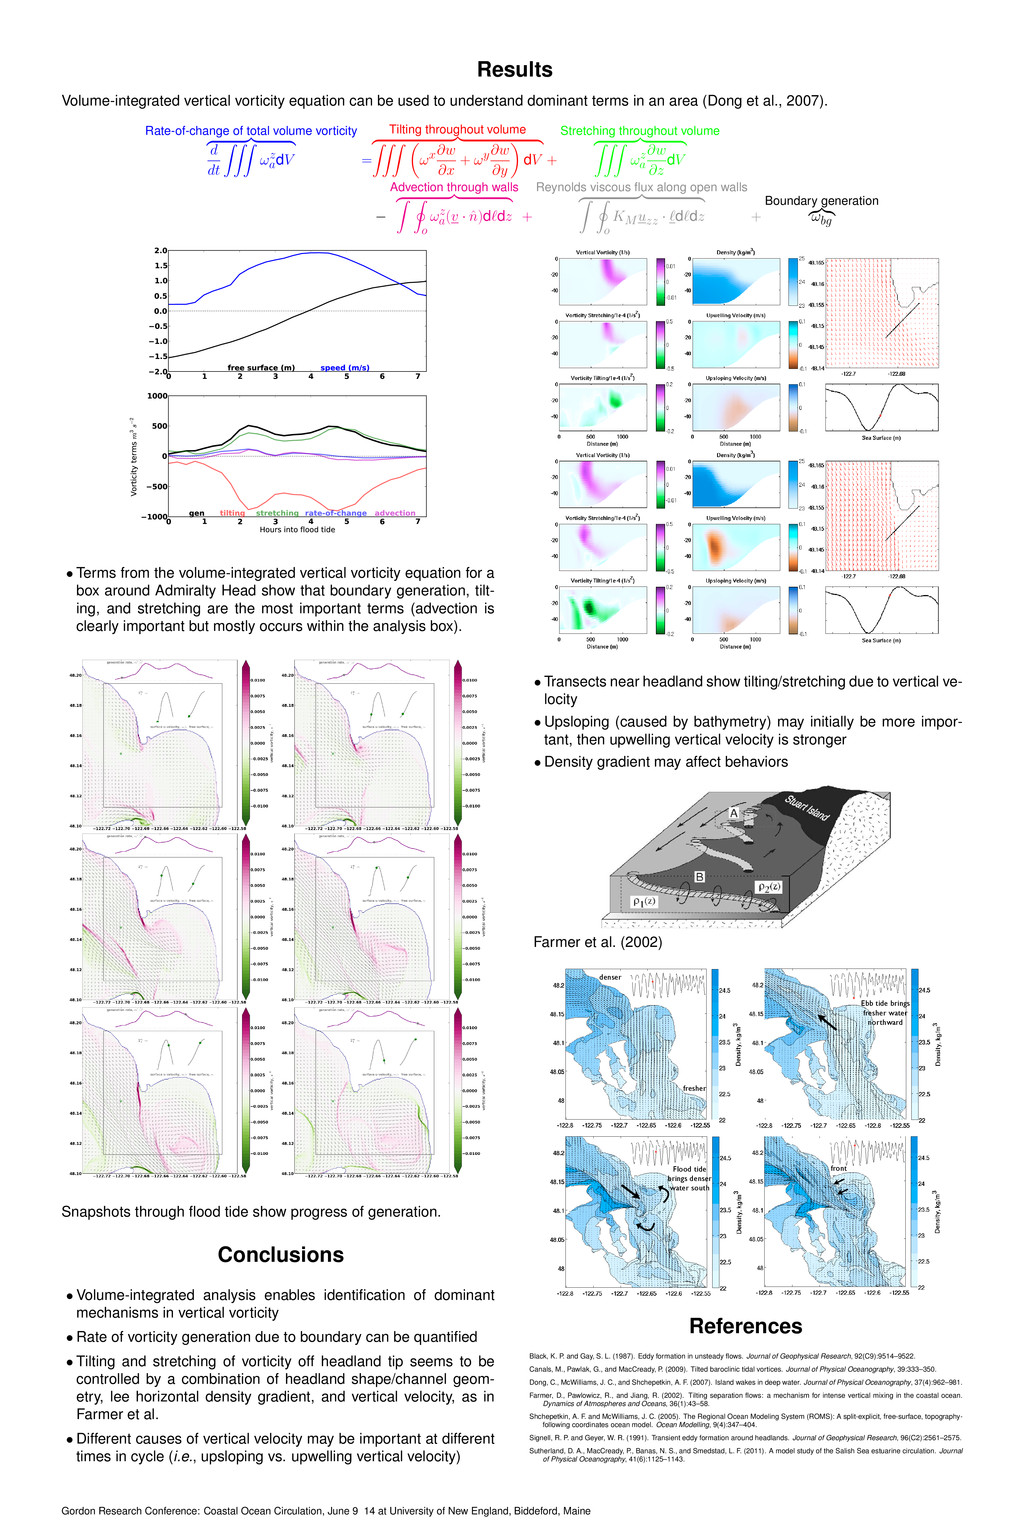
dominant terms in an area (Dong et al., 2007). Rate-of-change of total volume vorticity d dt ωz adV = Tilting throughout volume ωx∂w ∂x + ωy∂w ∂y dV + Stretching throughout volume ωz a ∂w ∂z dV − Advection through walls o ωz a(v · ˆ n)d dz + Reynolds viscous flux along open walls o KMuzz · d dz + Boundary generation ωbg 0 1 2 3 4 5 6 7 2.0 1.5 1.0 0.5 0.0 0.5 1.0 1.5 2.0 free surface (m) speed (m/s) 0 1 2 3 4 5 6 7 Hours into flood tide 1000 500 0 500 1000 Vorticity terms m3 s−2 gen tilting stretching rate-of-change advection • Terms from the volume-integrated vertical vorticity equation for a box around Admiralty Head show that boundary generation, tilt- ing, and stretching are the most important terms (advection is clearly important but mostly occurs within the analysis box). Snapshots through flood tide show progress of generation. Conclusions • Volume-integrated analysis enables identification of dominant mechanisms in vertical vorticity • Rate of vorticity generation due to boundary can be quantified • Tilting and stretching of vorticity off headland tip seems to be controlled by a combination of headland shape/channel geom- etry, lee horizontal density gradient, and vertical velocity, as in Farmer et al. • Different causes of vertical velocity may be important at different times in cycle (i.e., upsloping vs. upwelling vertical velocity) • Transects near headland show tilting/stretching due to vertical ve- locity • Upsloping (caused by bathymetry) may initially be more impor- tant, then upwelling vertical velocity is stronger • Density gradient may affect behaviors 56 D. Farmer et al. / Dynamics of Atmospheres and Oceans 36 (2002) 43–58 Fig. 9. Sketch showing tidal flow of density ρ1 past a headland with separation. A vertical shear layer or vortex sheet is formed (A) separating this flow from water of density ρ2 behind the headland. Instabilities evolve into vertically oriented rotating columns of fluid. The vortices move downstream, but begin to tilt and stretch due to horizontal density gradients across the front. The tilting converts horizontal to vertical motions; advective instabilities occur as heavy water is transported above light water and vice versa leading to intense mixing (B). large flood tides in this region, this single feature might account for as much as 14% of the total mixing. These estimates are necessarily approximate, but give an indication of the contribution to mixing. It should be mentioned here that this front is by no means unique in the Haro Strait/Juan de Fuca region, so that a significant fraction of the total mixing is likely to occur in this way. An idealized representation of the proposed evolution of the flow is sketched in Fig. 9, illustrating initial separation of the boundary layer at A, followed by tilting and stretching of the shear layer at B. Bubbles are entrained at the surface in whirlpools and from breaking waves in convergence zones, subsequently descending to great depths in the active zone. Further downstream (C in Fig. 3) the shear layer becomes broader, vortical motions decay, the surface expression weakens and in the absence of other factors relevant here, such as irregular topography and the changing tidal forcing, further development would be expected to assume the form of a steady coastal front (Bowden, 1983) in which friction balances the horizontal pressure gradient. For the reasons outlined earlier, the detailed response of the separated flow is sensitive to the density structure on either side of the shear zone. Additional measurements near Turn Point front were acquired in September 2000. In this case, denser water occurred on the eastern side of the front, but only at intermediate depths. Moreover, a sharply defined fresh layer remained on the surface to the east of the front. As before, the front was initially vertical in the neighborhood of the sharply curved portion, but further downstream there was evidence of interleaving of the different water masses. In this configuration, the hori- zontal interface bounding the fresh layer was only 20 m deep and the large vertical motions prevalent in the 1996 observations shown in Fig. 6 were not observed. 4. Conclusions Boundary layer separation is a common phenomenon wherever strong tidal currents occur in the presence of irregular coastlines. If differential mixing or different origins of the two Farmer et al. (2002) fresher denser Ebb tide brings fresher water northward Flood tide brings denser water south front References Black, K. P. and Gay, S. L. (1987). Eddy formation in unsteady flows. Journal of Geophysical Research, 92(C9):9514–9522. Canals, M., Pawlak, G., and MacCready, P. (2009). Tilted baroclinic tidal vortices. Journal of Physical Oceanography, 39:333–350. Dong, C., McWilliams, J. C., and Shchepetkin, A. F. (2007). Island wakes in deep water. Journal of Physical Oceanography, 37(4):962–981. Farmer, D., Pawlowicz, R., and Jiang, R. (2002). Tilting separation flows: a mechanism for intense vertical mixing in the coastal ocean. Dynamics of Atmospheres and Oceans, 36(1):43–58. Shchepetkin, A. F. and McWilliams, J. C. (2005). The Regional Ocean Modeling System (ROMS): A split-explicit, free-surface, topography- following coordinates ocean model. Ocean Modelling, 9(4):347–404. Signell, R. P. and Geyer, W. R. (1991). Transient eddy formation around headlands. Journal of Geophysical Research, 96(C2):2561–2575. Sutherland, D. A., MacCready, P., Banas, N. S., and Smedstad, L. F. (2011). A model study of the Salish Sea estuarine circulation. Journal of Physical Oceanography, 41(6):1125–1143. Gordon Research Conference: Coastal Ocean Circulation, June 9 14 at University of New England, Biddeford, Maine