Upgrade to Pro — share decks privately, control downloads, hide ads and more …

Our approach to New Year's traffic of LINE STICKER @ TECHPULSE 2023

Our approach to New Year's traffic of LINE STICKER @ TECHPULSE 2023

- Speaker: Koji Lin
- Event: http://techpulse.line.me/

在過年的期間,大家是否有透過貼圖與親朋好友拜年呢?本次議程將透過各種視角,帶大家了解我們是如何設計與規劃系統架構,因應不同時區的新年流量,並了解在新年期間是如何透過監控與營運機制,讓服務被有效運用。

LINE Developers Taiwan
PRO

February 21, 2023
Tweet

More Decks by LINE Developers Taiwan

Other Decks in Technology

Transcript

  1. 1

    View Slide

  2. Agenda › New Year’s Campaign
    › Preparations for handling spikes of about 9x

    View Slide

  3. New Year’s campaign in
    Japan

    View Slide

  4. Challenges
    › We need to utilize different teams API to 
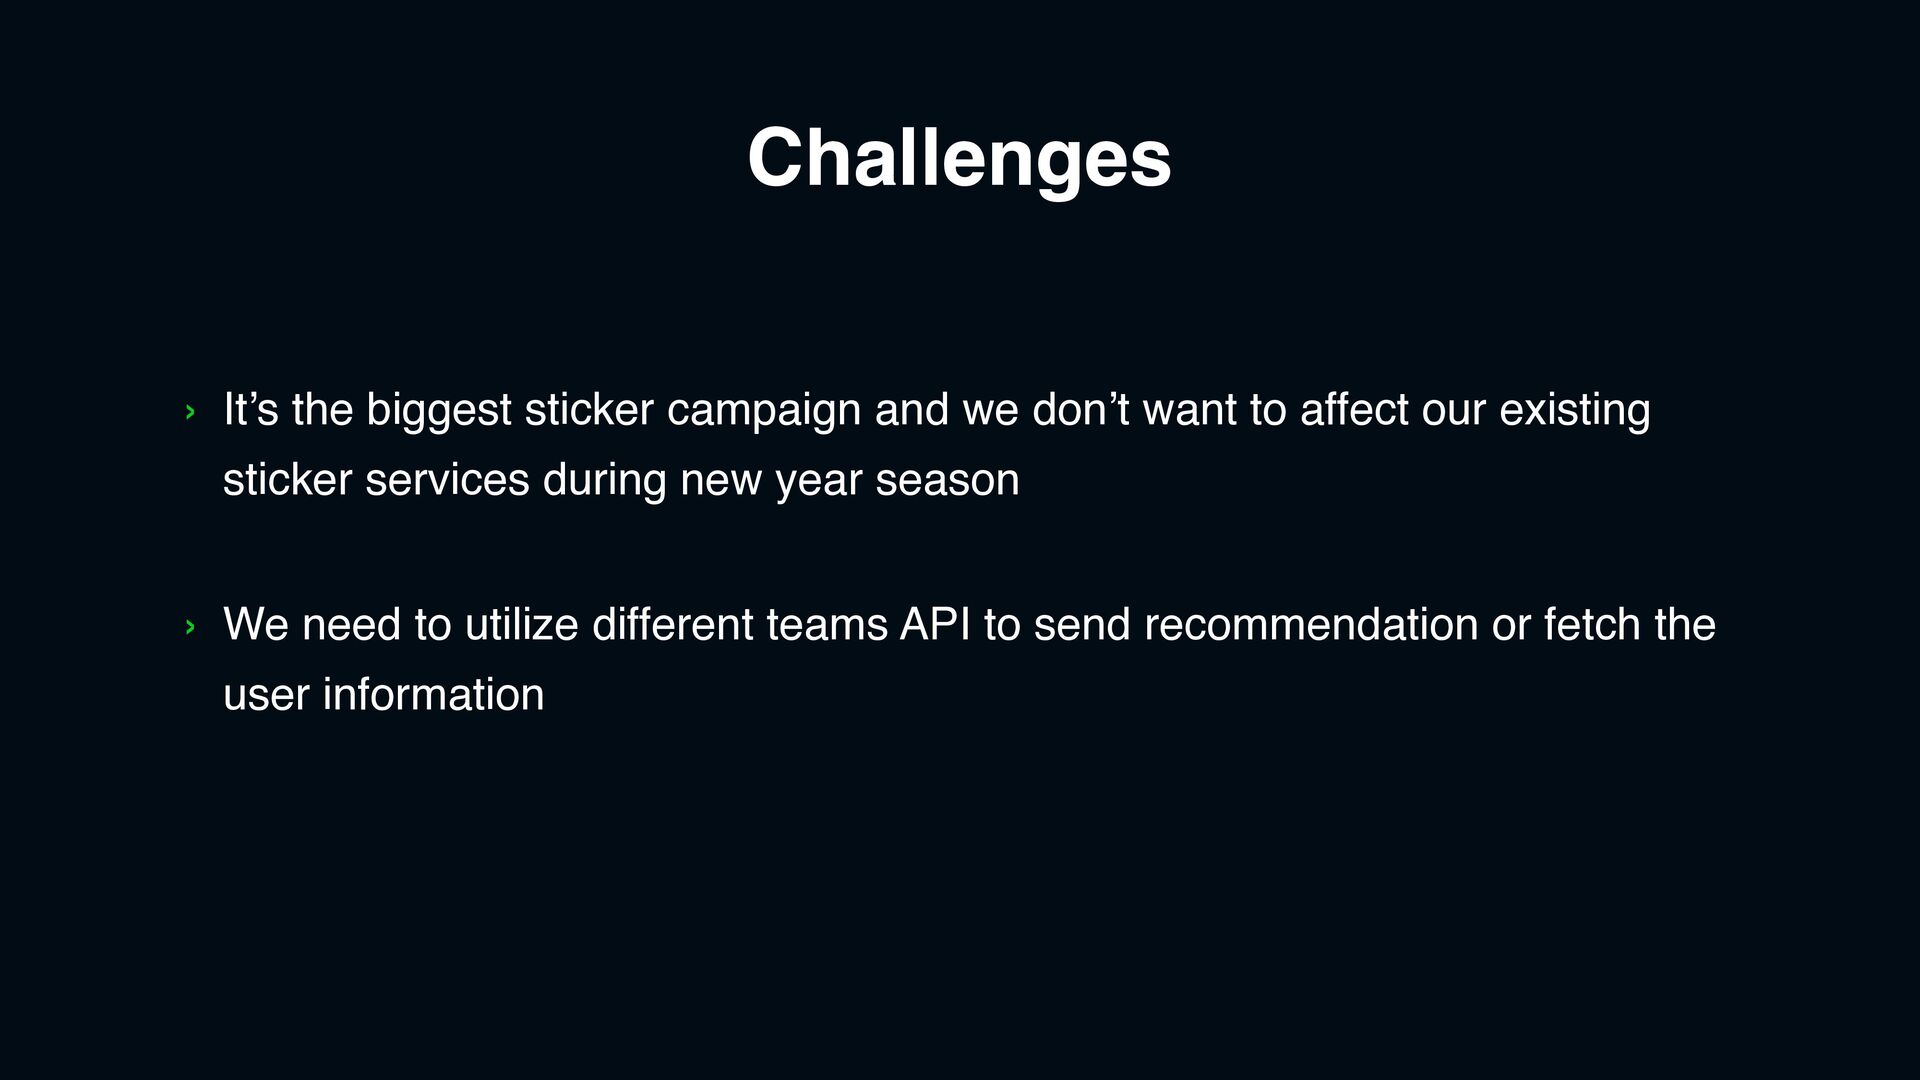
send recommendation or fetch the
    user information
    › It’s the biggest sticker campaign and we don’t want to affect our existing
    sticker services during new year season

    View Slide

  5. New Year’s campaign in Japan
    › Buy a campaign sticker to get the fortune slip
    › From 12/26, we can send fortune slip to your friends or draw by self
    › One of the biggest sticker campaign in Japan

    View Slide

  6. Design
    › Utilize Kafka provided by IMF team
    Fully asynchronous
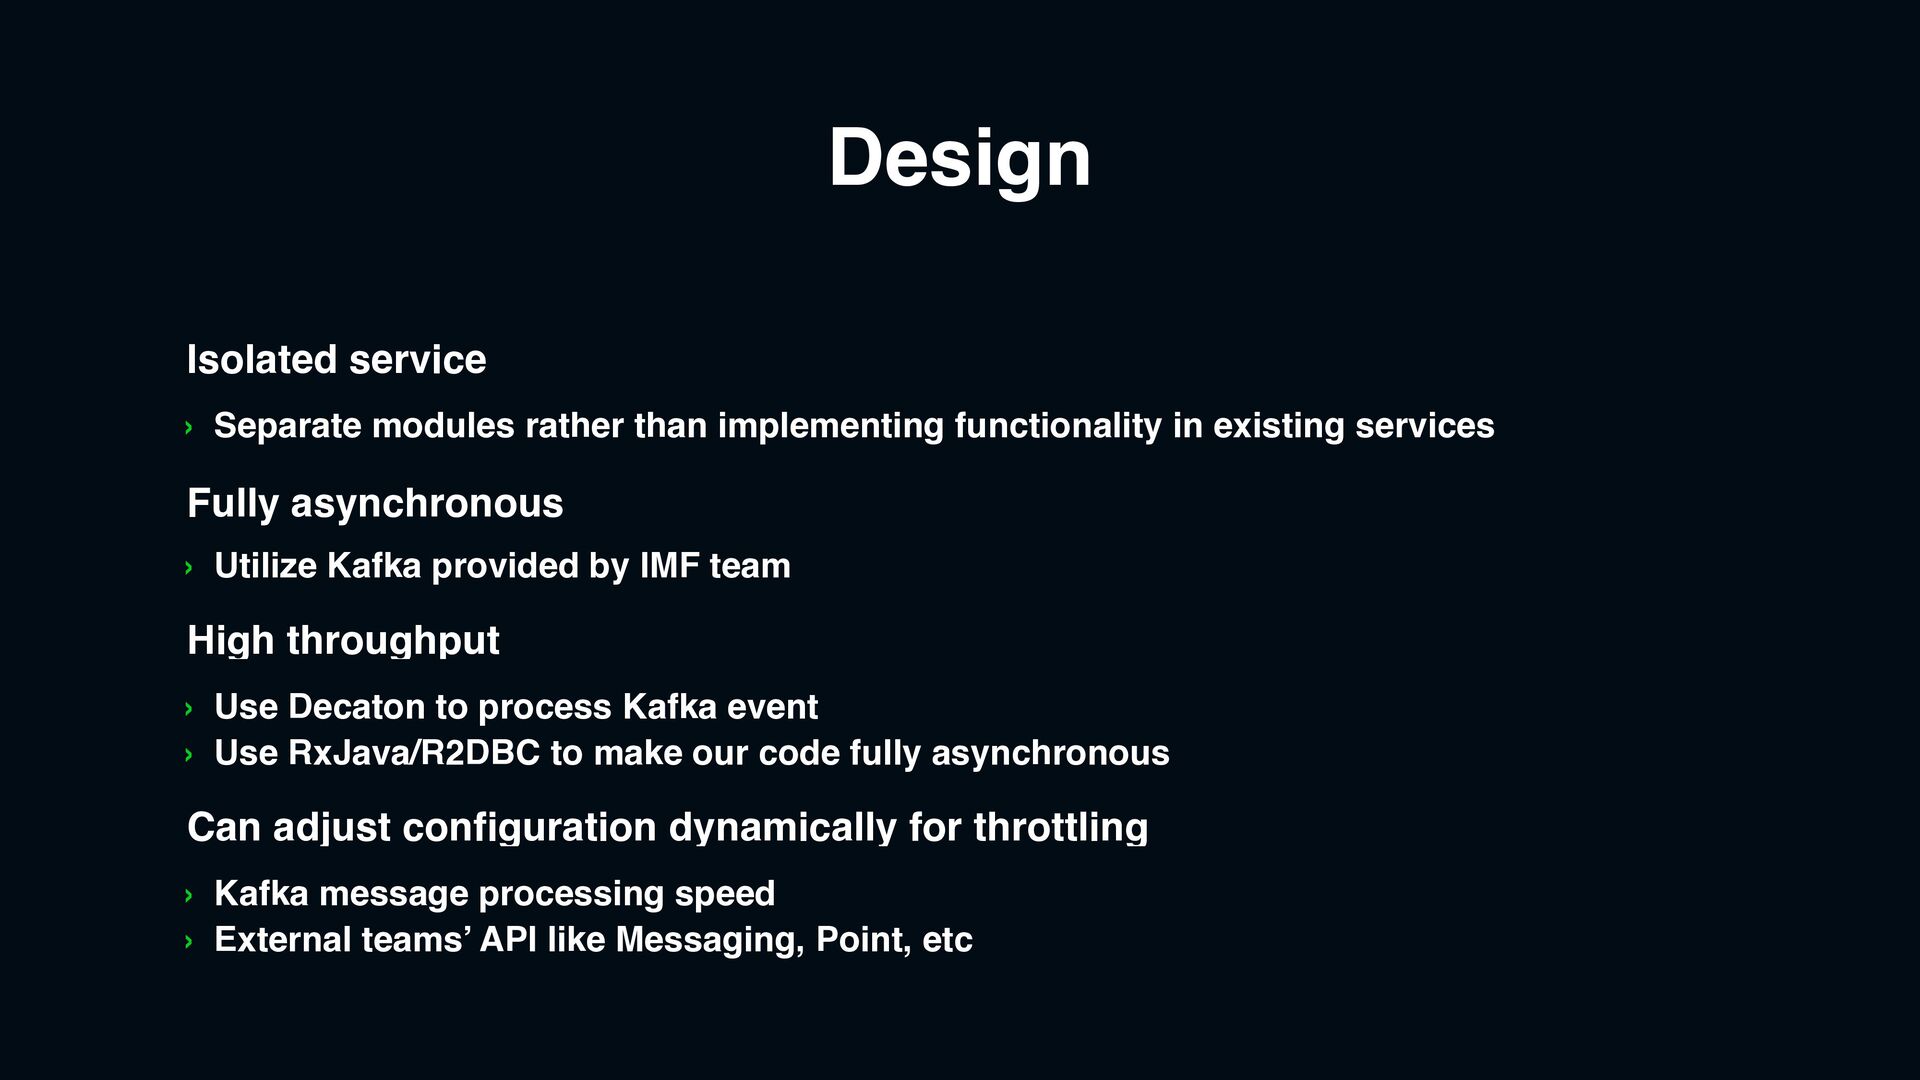
    Can adjust configuration dynamically for throttling
    › Kafka message processing speed
    › External teams’ API like Messaging, Point, etc
    Isolated service
    › Separate modules rather than implementing functionality in existing services
    › Use Decaton to process Kafka event
    › Use RxJava/R2DBC to make our code fully asynchronous
    High throughput

    View Slide

  7. › The api server does the minimum 

    necessary processing and sending 

    event that can be processed 

    later to Kafka
    System overview
    API/Batch
    Decaton Processor

    View Slide

  8. Rate limited services
    › Make our Kafka processing and API client calling speed can be configured
    dynamically
    › Most APIs can be retried, and if not possible, logged and handled manually
    › Communicate with other teams to obey the maximum traffic can be handled
    by other teams
    › Perform load testing with other teams

    View Slide

  9. Failover testing
    › For our storages
    › Redis
    › MySQL
    › MongoDB

    › This year we discovered a race condition issue with the database client
    library during failover

    View Slide

  10. Appropriate estimation from planning
    › Event it self is not just single day but whole month
    › From 2022/12/1 to 2023/1/13

    › Well estimated OA messages
    › Send campaign relation information during the campaign
    › The system is stable during the campaign period

    View Slide

  11. Preparations for handling
    spikes of about 9x

    View Slide

  12. Features provided by LINE STICKER
    › Create and update the 
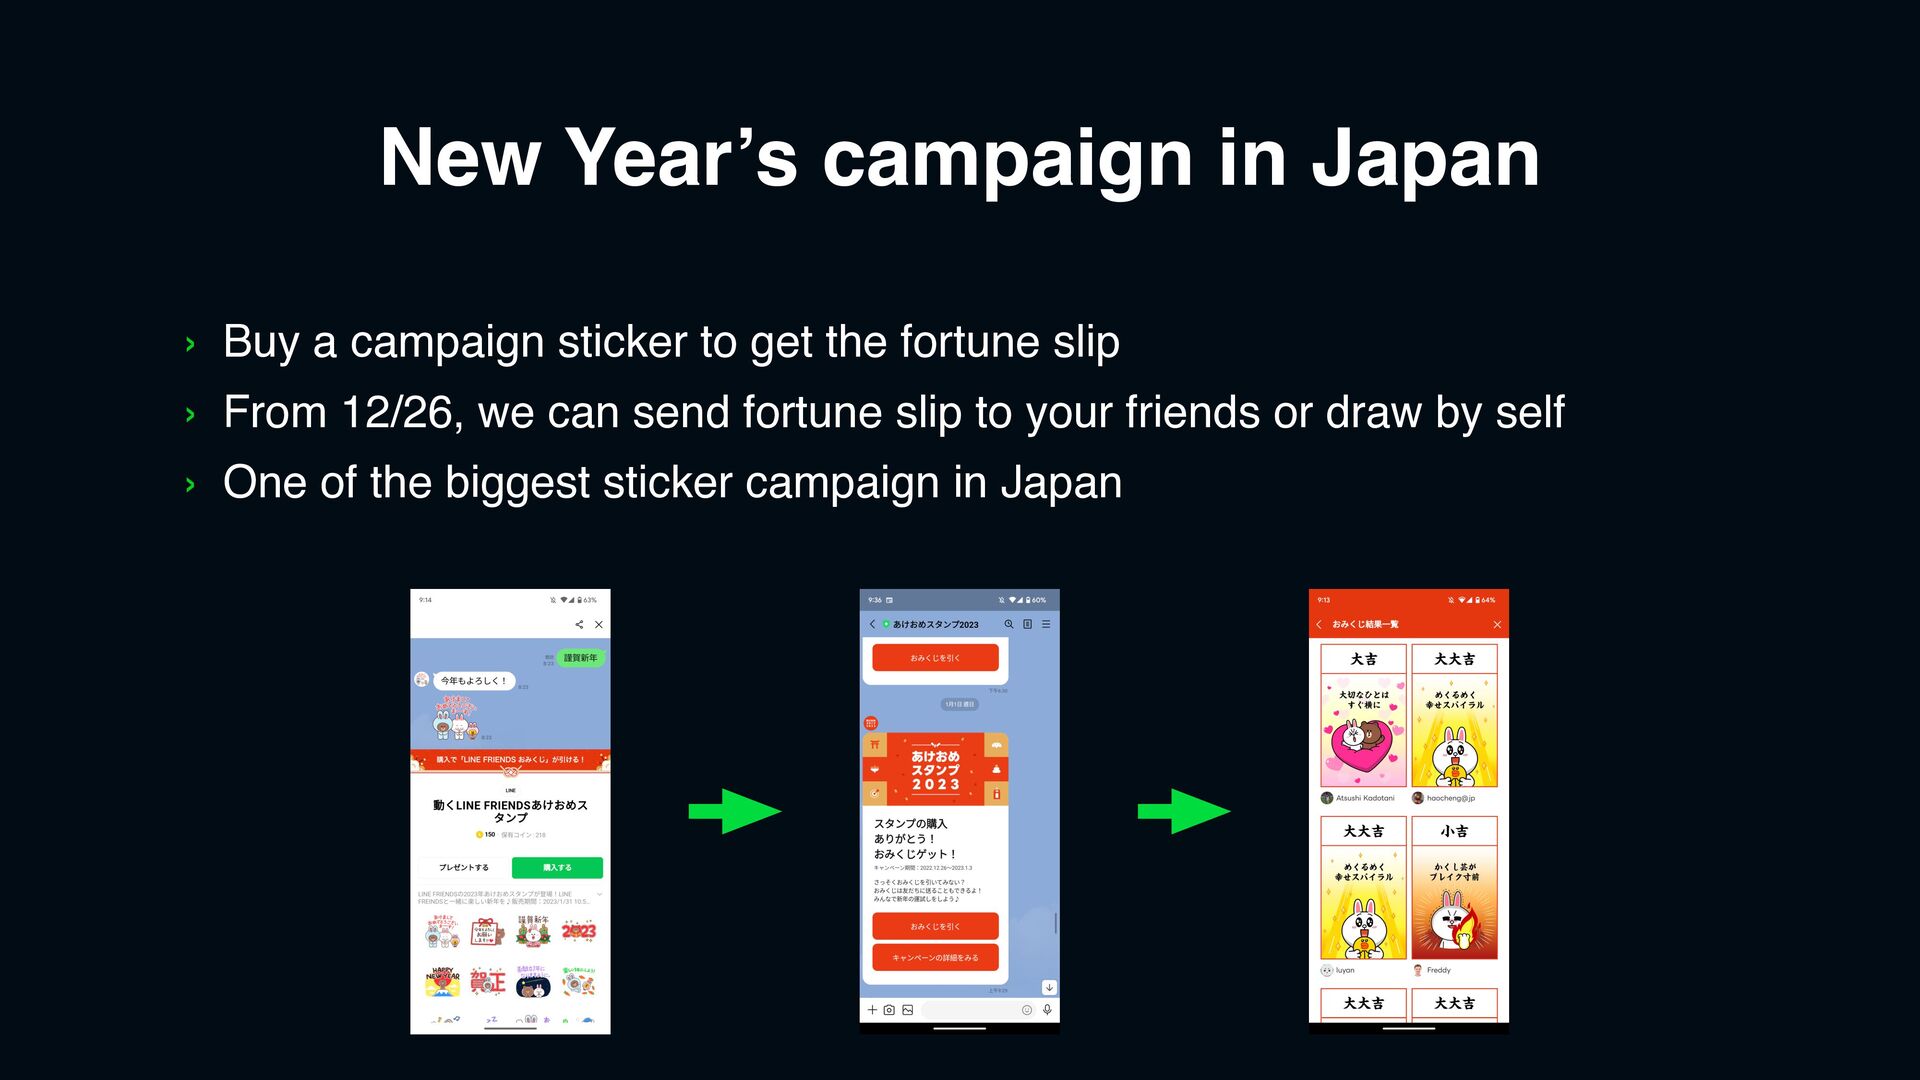
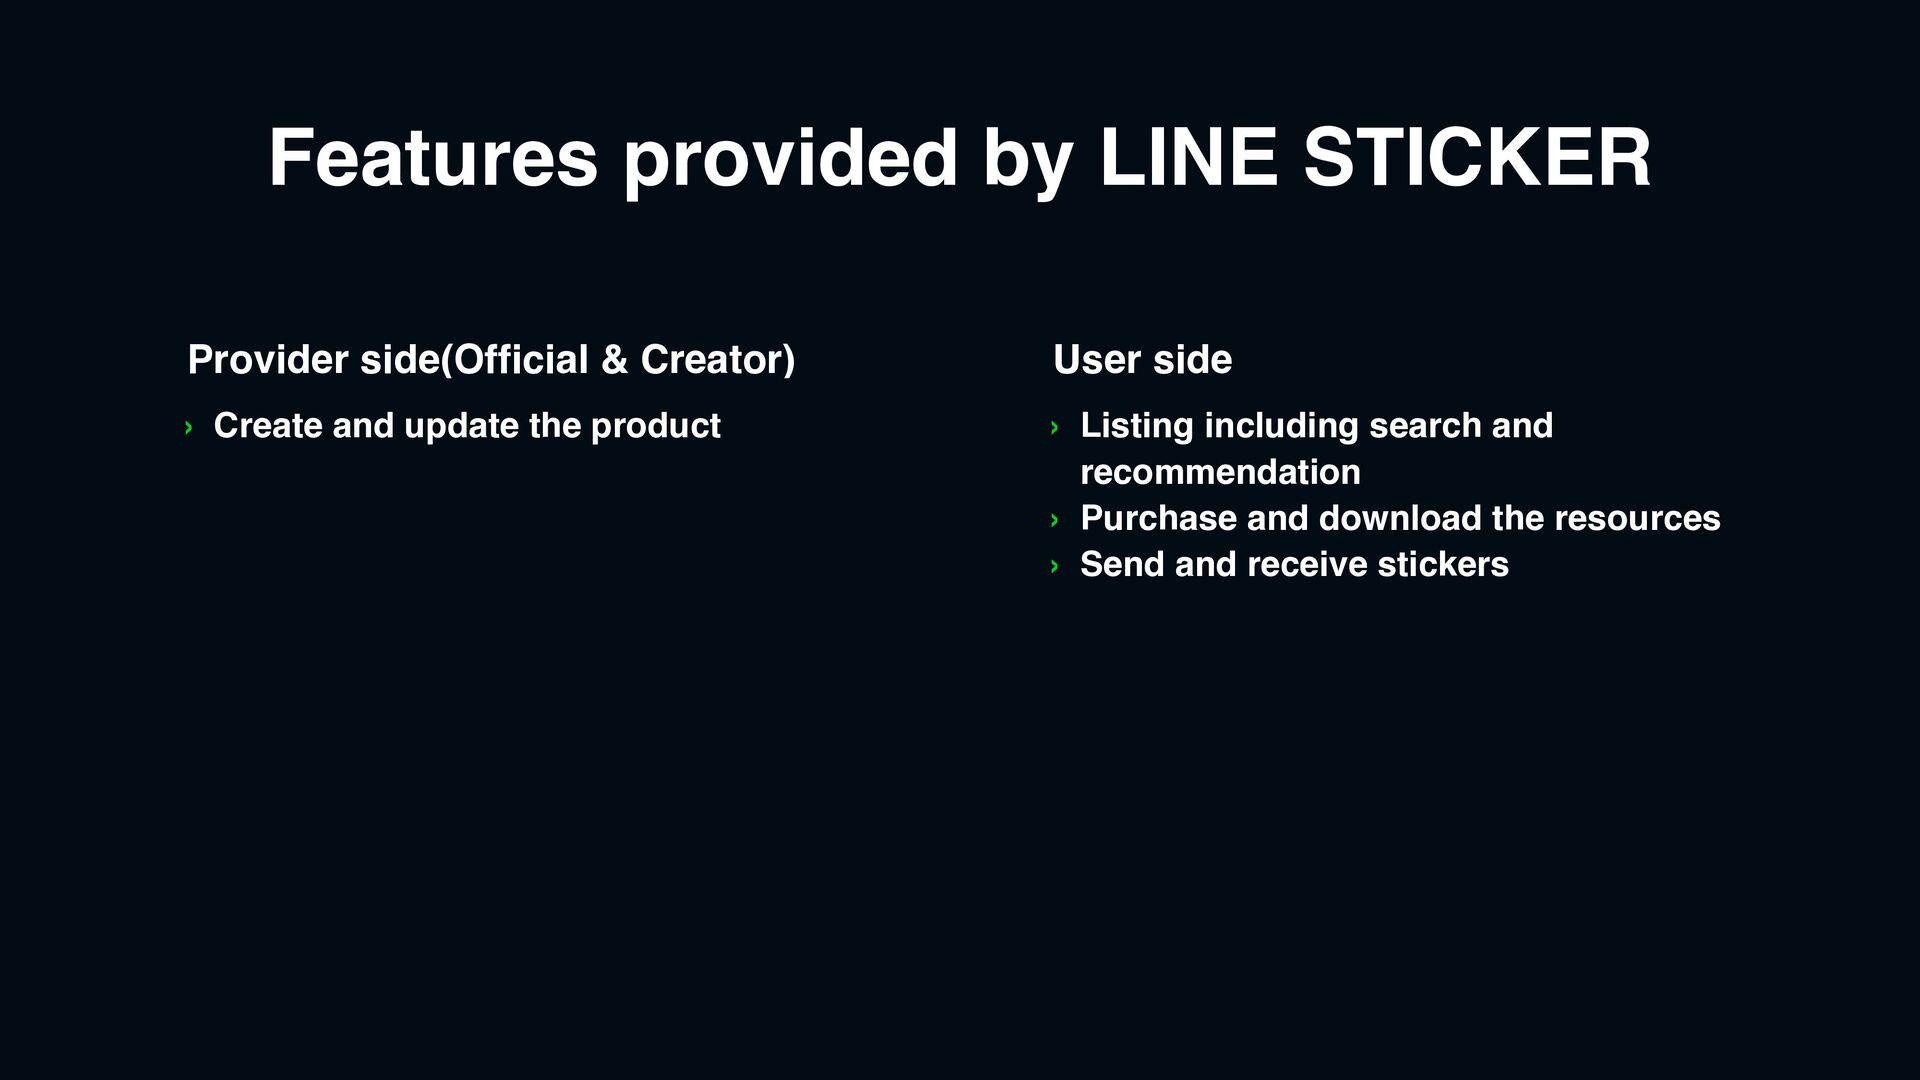
product
    Provider side(Official & Creator)
    › Listing including search and
    recommendation
    › Purchase and download the resources
    › Send and receive stickers
    User side

    View Slide

  13. System overview
    Talk server
    Open Chat
    Home content
    CDN
    API gateway
    Web site
    API/Search
    server
    ES
    MySQL
    MongoDB
    Capability
    server
    Image server Object
    storage

    View Slide

  14. System overview
    Talk server
    Open Chat
    Home content
    CDN
    API gateway
    Web site
    API/Search
    server
    ES
    MySQL
    MongoDB
    Capability
    server
    Image server Object
    storage
    Send sticker
    Listing/Recommend
    Downloading images

    View Slide

  15. What happens at new year’s eve

    View Slide

  16. Difficulty of new year’s eve
    › Annual event
    › Hard 
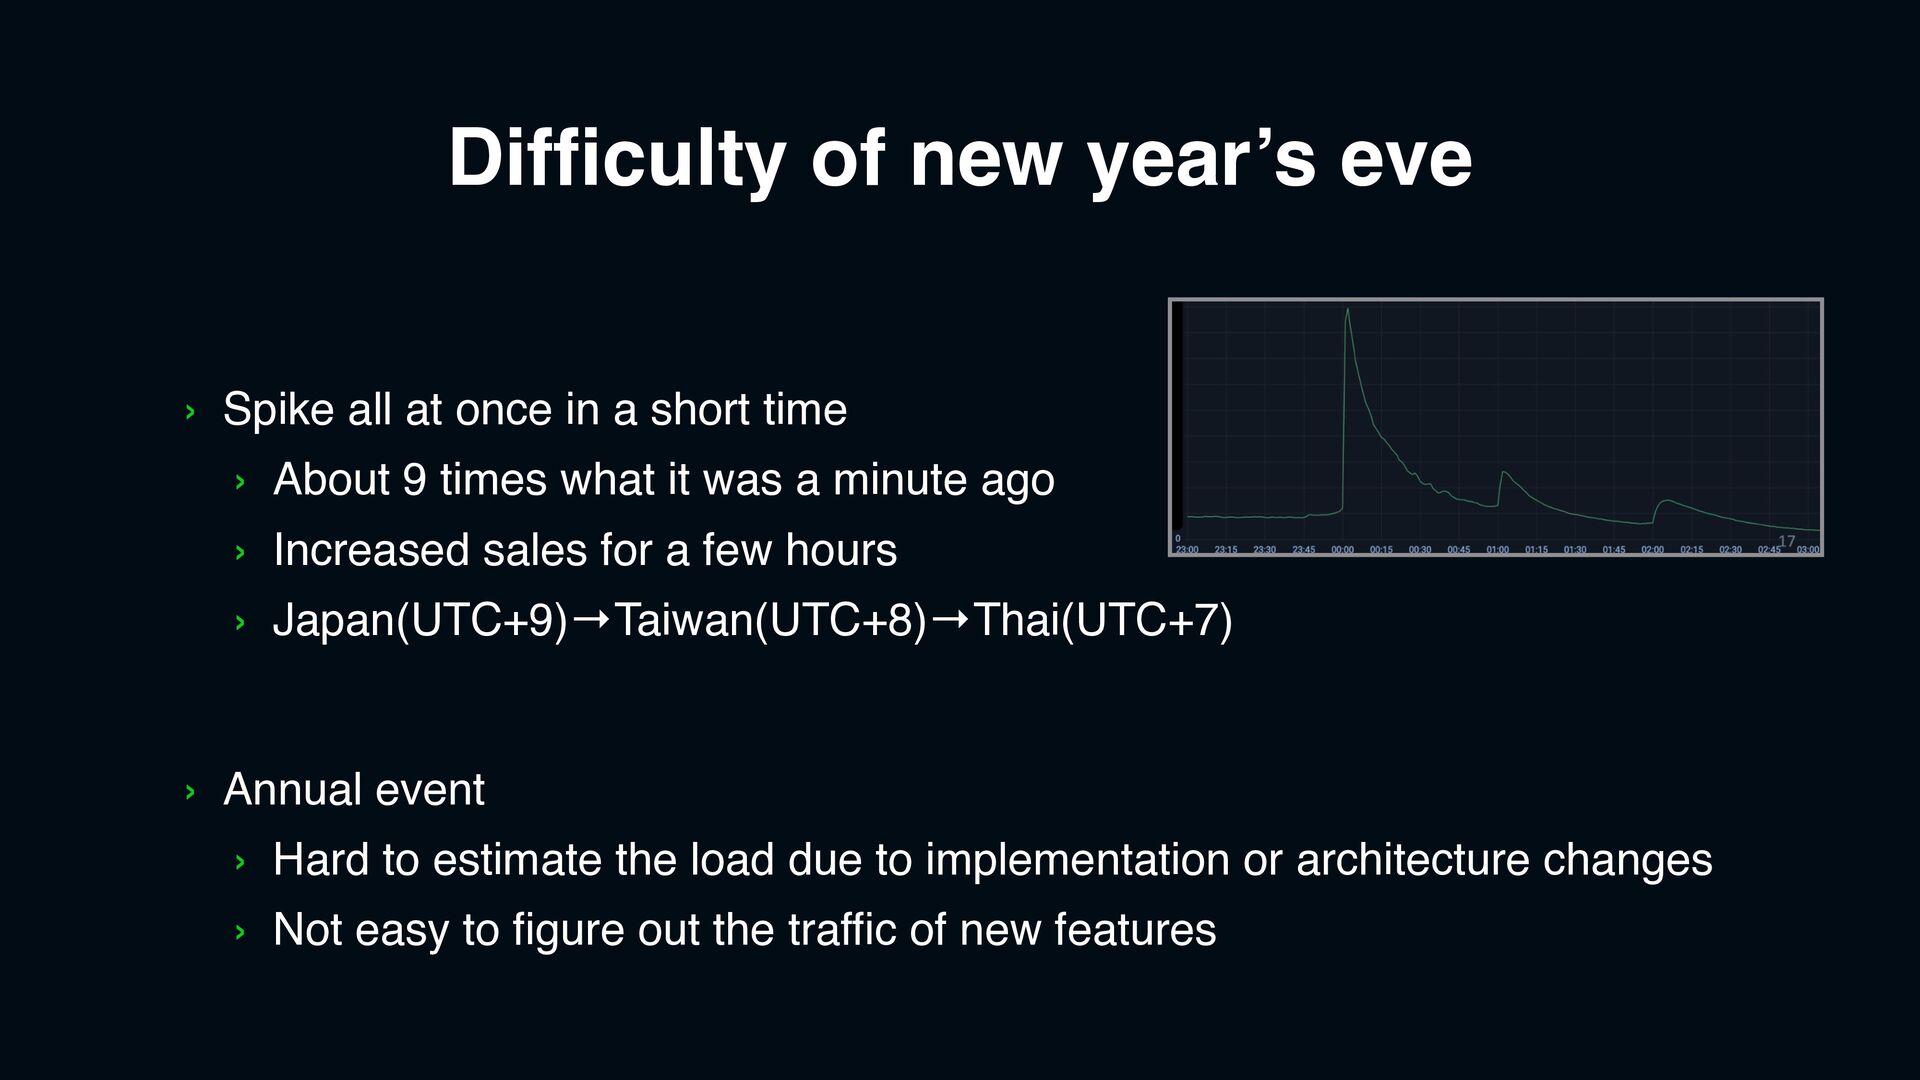
to estimate the load due to implementation or architecture changes
    › Not easy to figure out the traffic of new features
    › Spike all at once in a short time
    › About 9 times what it was a minute ago
    › Increased sales for a few hours
    › Japan(UTC+9)→Taiwan(UTC+8)→Thai(UTC+7)

    View Slide

  17. Average growth rate
    The geometric mean per year from the growth rate over multiple years.
    It absorbs some of the ups and downs in the annual growth rate.
    Average growth rate +44%

    View Slide

  18. The year-on-year ratio of the number of
    accesses under normal 
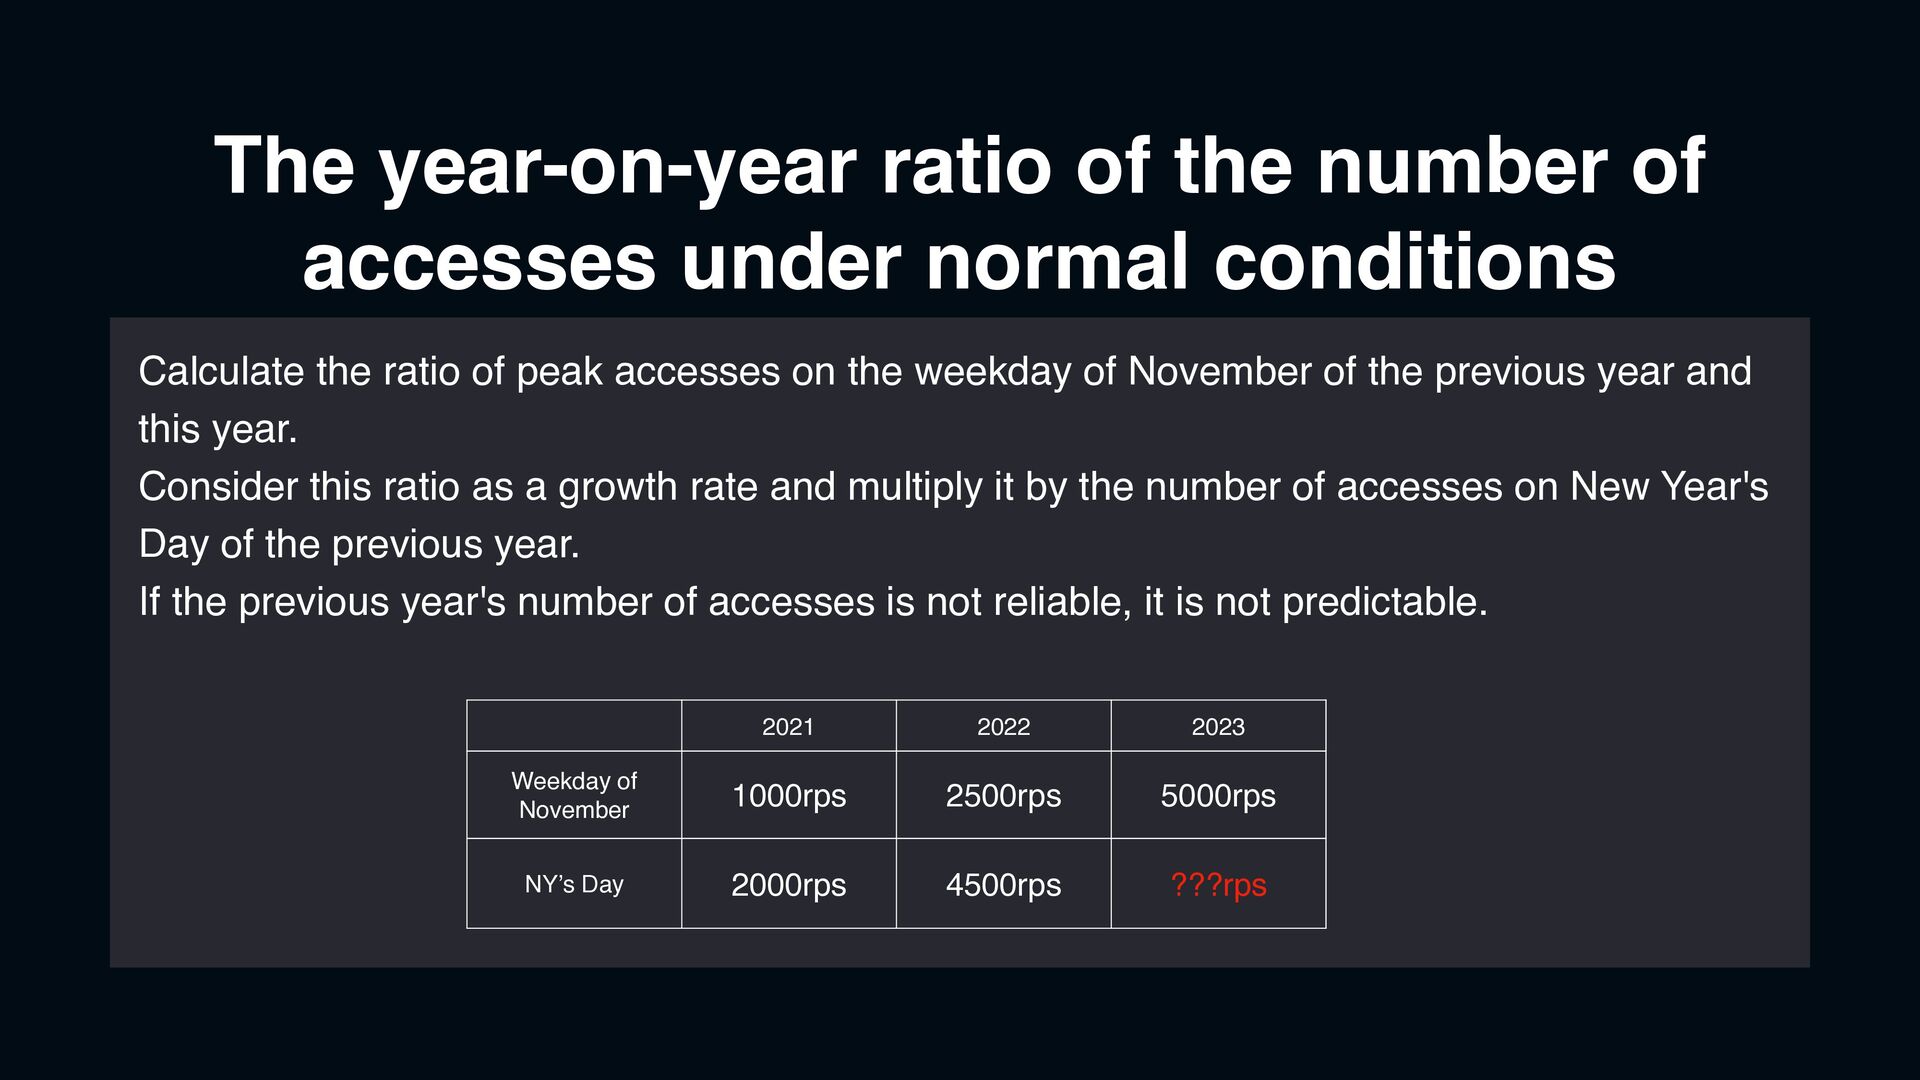
conditions
    Calculate the ratio of peak accesses on the weekday of November of the previous year and
    this year.
    Consider this ratio as a growth rate and multiply it by the number of accesses on New Year's
    Day of the previous year.
    If the previous year's number of accesses is not reliable, it is not predictable.
    2021 2022 2023
    Weekday of
    November
    1000rps 2500rps 5000rps
    NY’s Day 2000rps 4500rps ???rps

    View Slide

  19. Estimate the number
    › We choose max value of average 
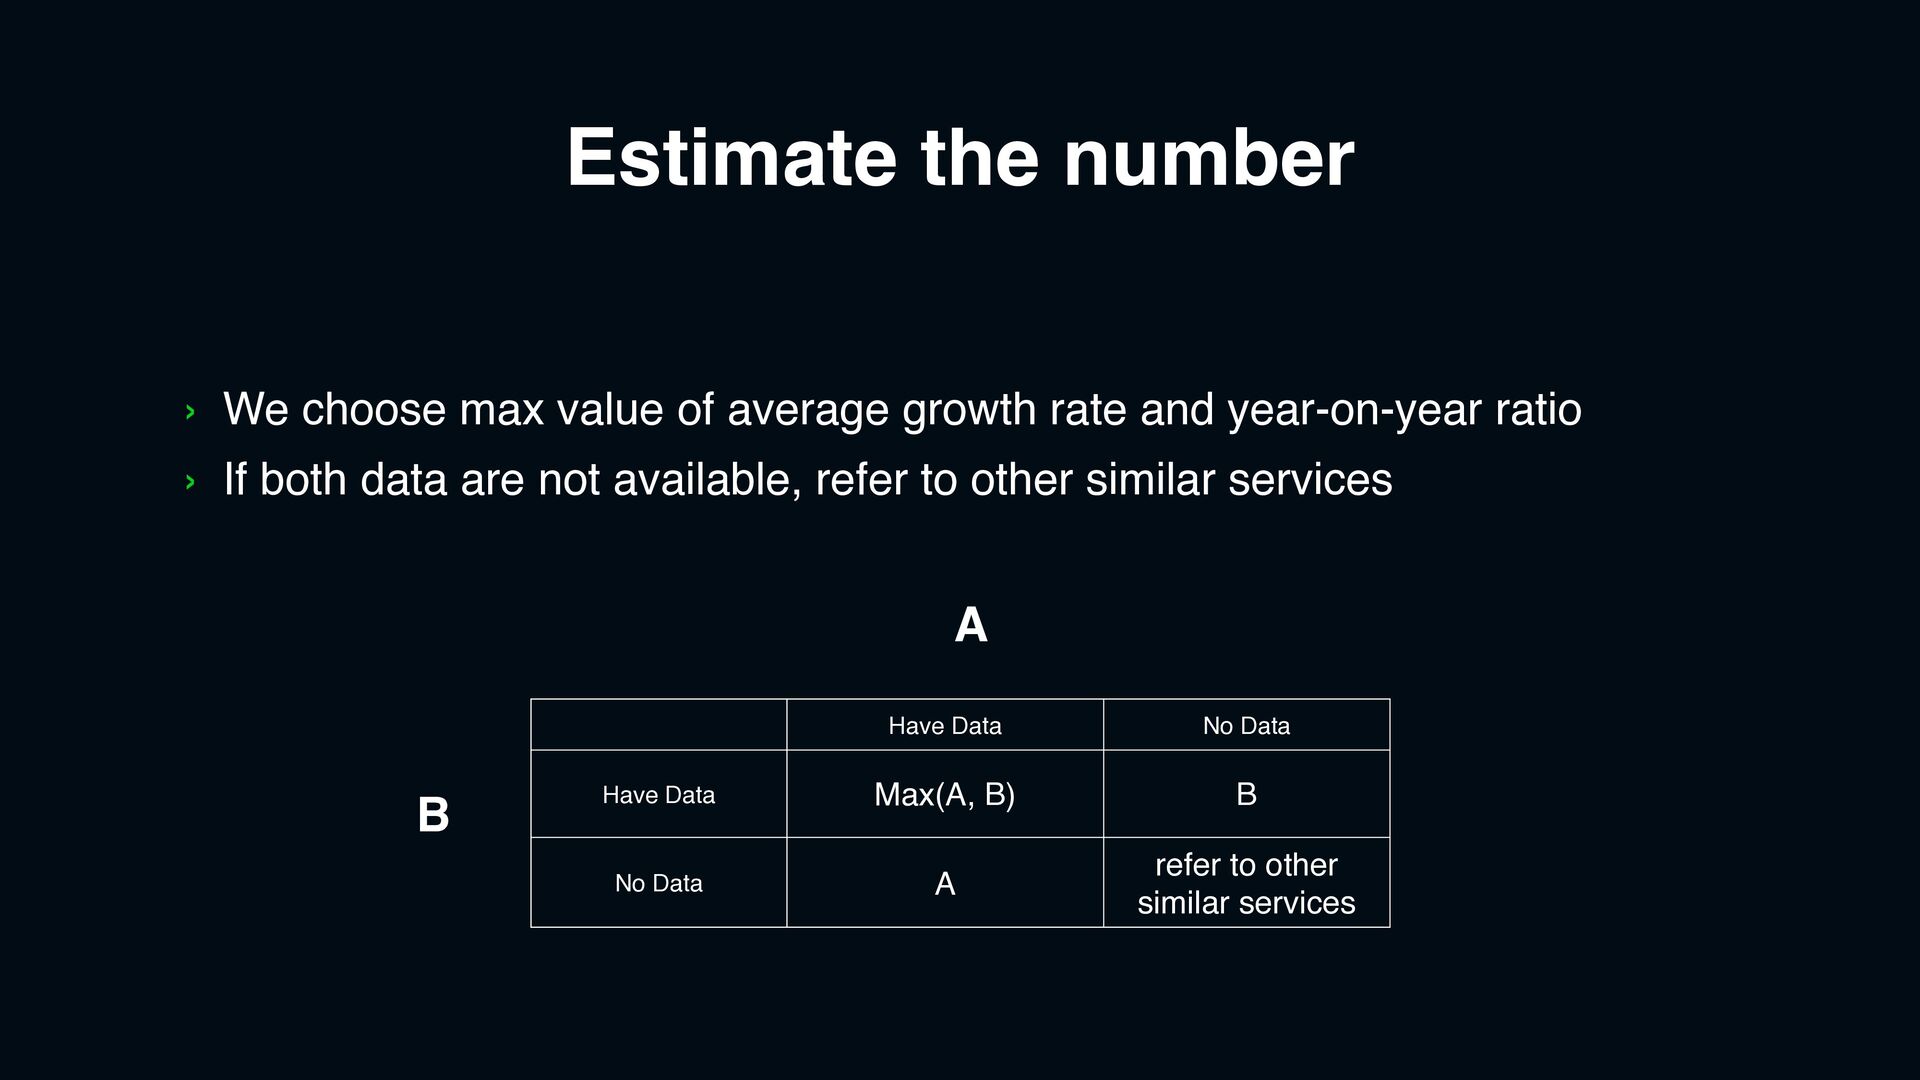
growth rate and year-on-year ratio
    › If both data are not available, refer to other similar services
    Have Data No Data
    Have Data Max(A, B) B
    No Data A
    refer to other
    similar services
    A
    B

    View Slide

  20. Preparing the instances
    › Services with confidence in estimation
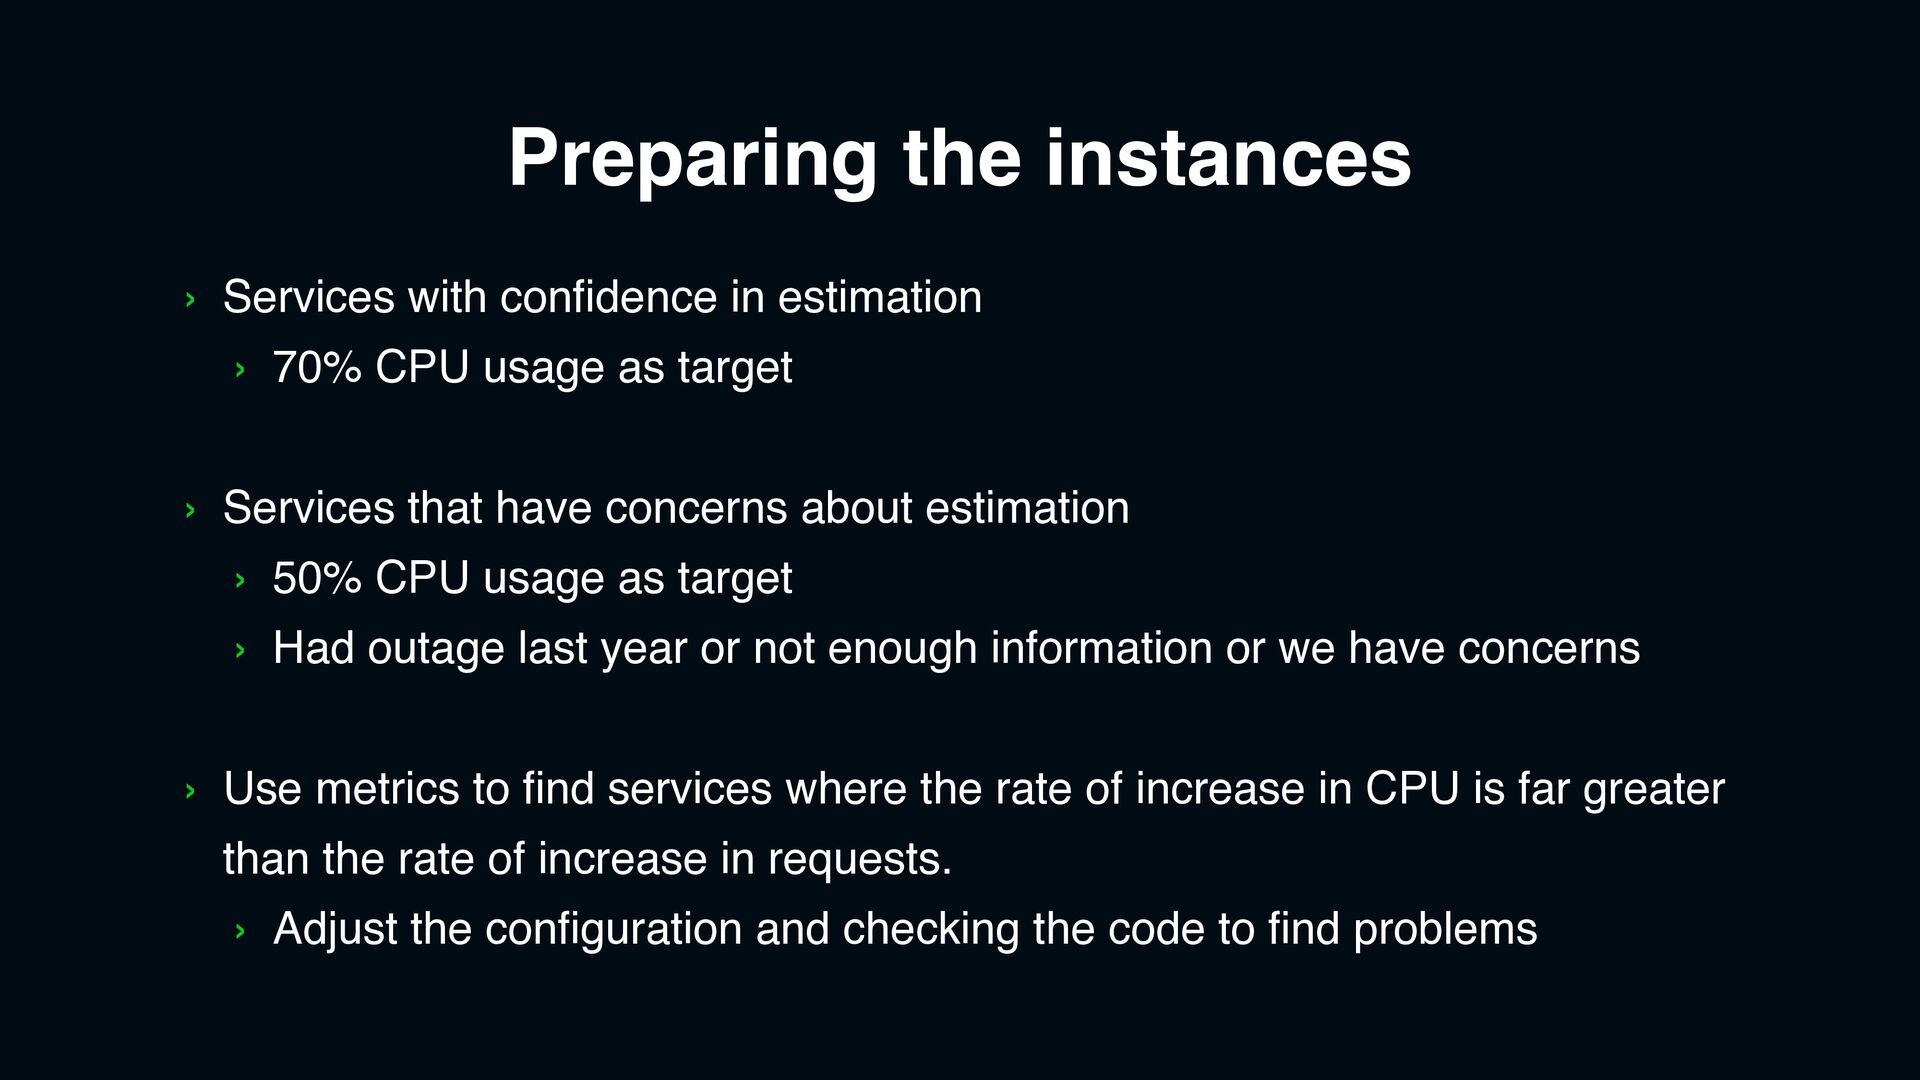
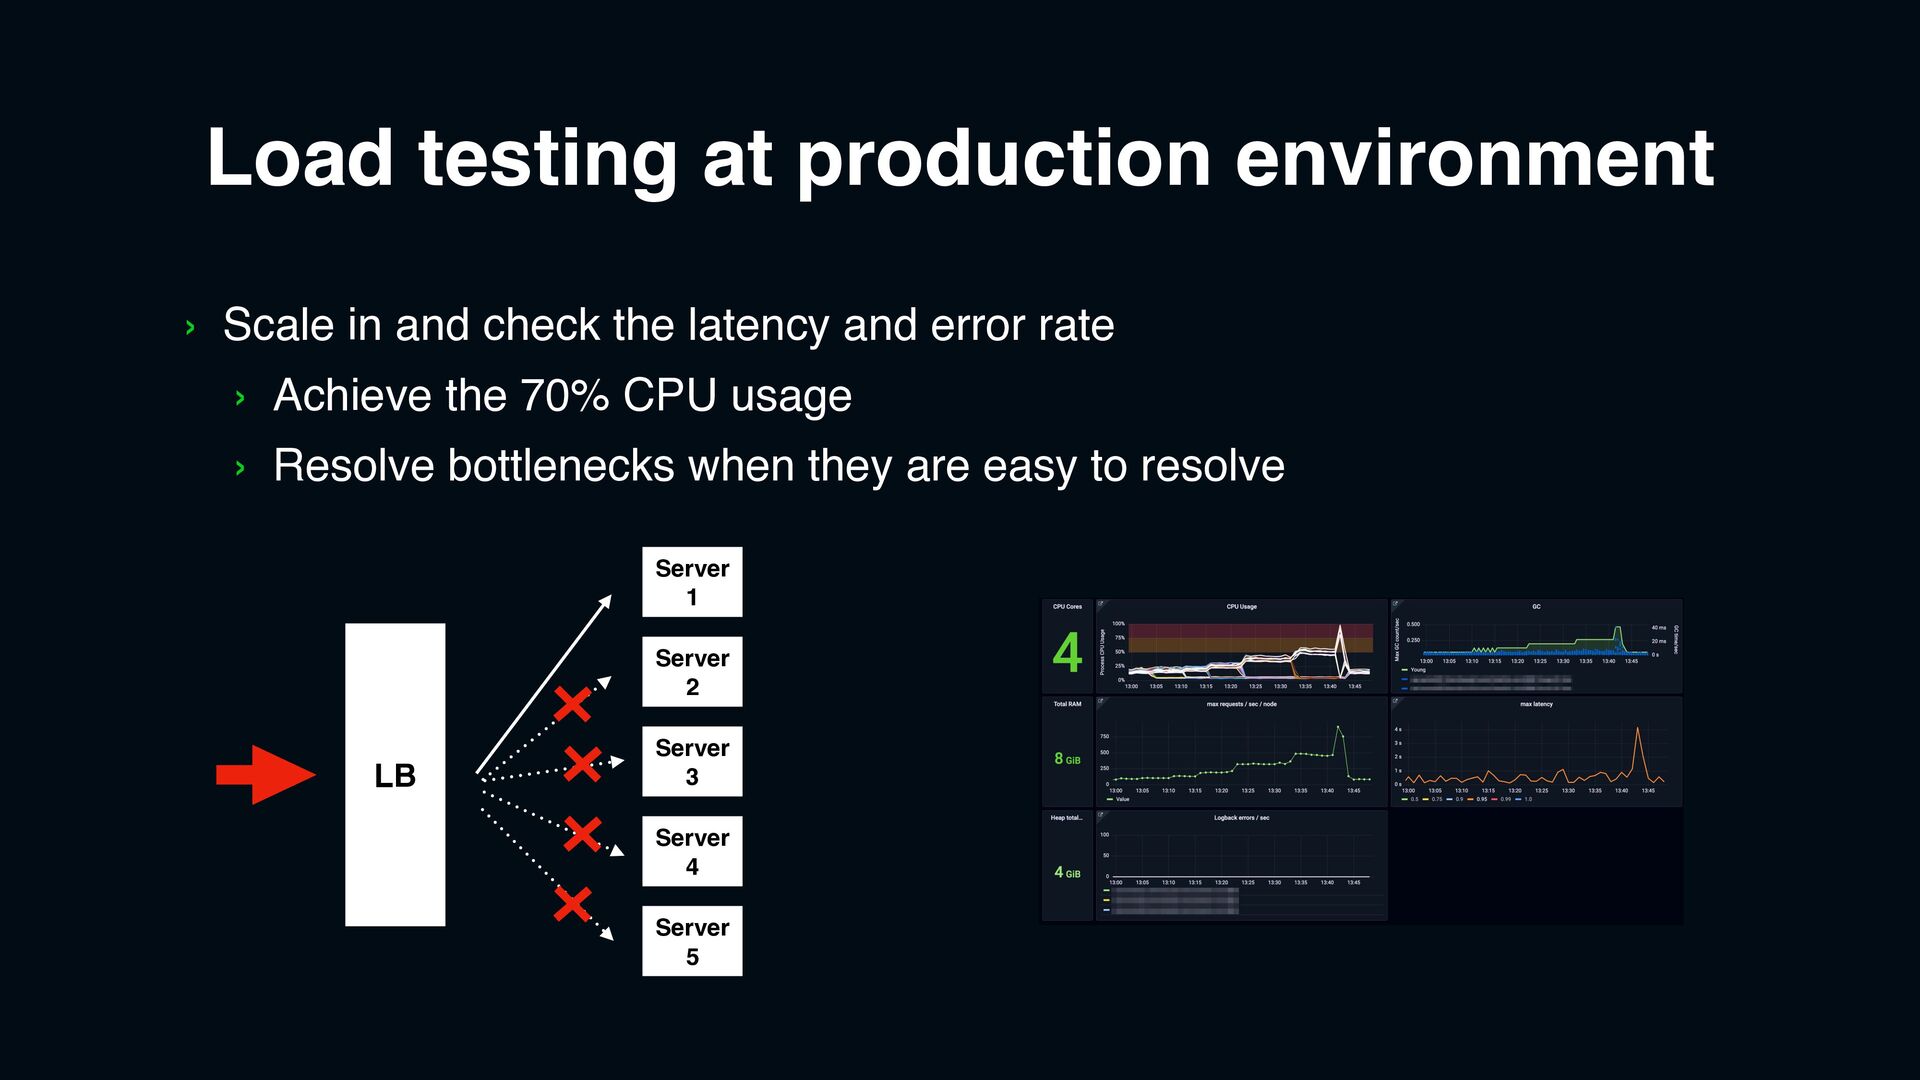
    › 70% CPU usage as target
    › Services that have concerns about estimation
    › 50% CPU usage as target
    › Had outage last year or not enough information or we have concerns

    › Use metrics to find services where the rate of increase in CPU is far greater
    than the rate of increase in requests.
    › Adjust the configuration and checking the code to find problems

    View Slide

  21. Load testing at production environment
    › Scale in and check the latency and error rate
    › Achieve the 70% CPU usage
    › Resolve bottlenecks when they are easy to resolve
    LB
    Server
    1
    Server
    2
    Server
    3
    Server
    4
    Server
    5

    View Slide

  22. Monitoring and Operations

    View Slide

  23. Assign monitoring members by context
    › Overloading may affect related services in the context
    › Sticker
    › Store
    › Image
    › etc.

    › To avoid using whole monitoring members resources for single outage

    View Slide

  24. Monitoring
    › Dedicated dashboard for new year
    › Focus on 
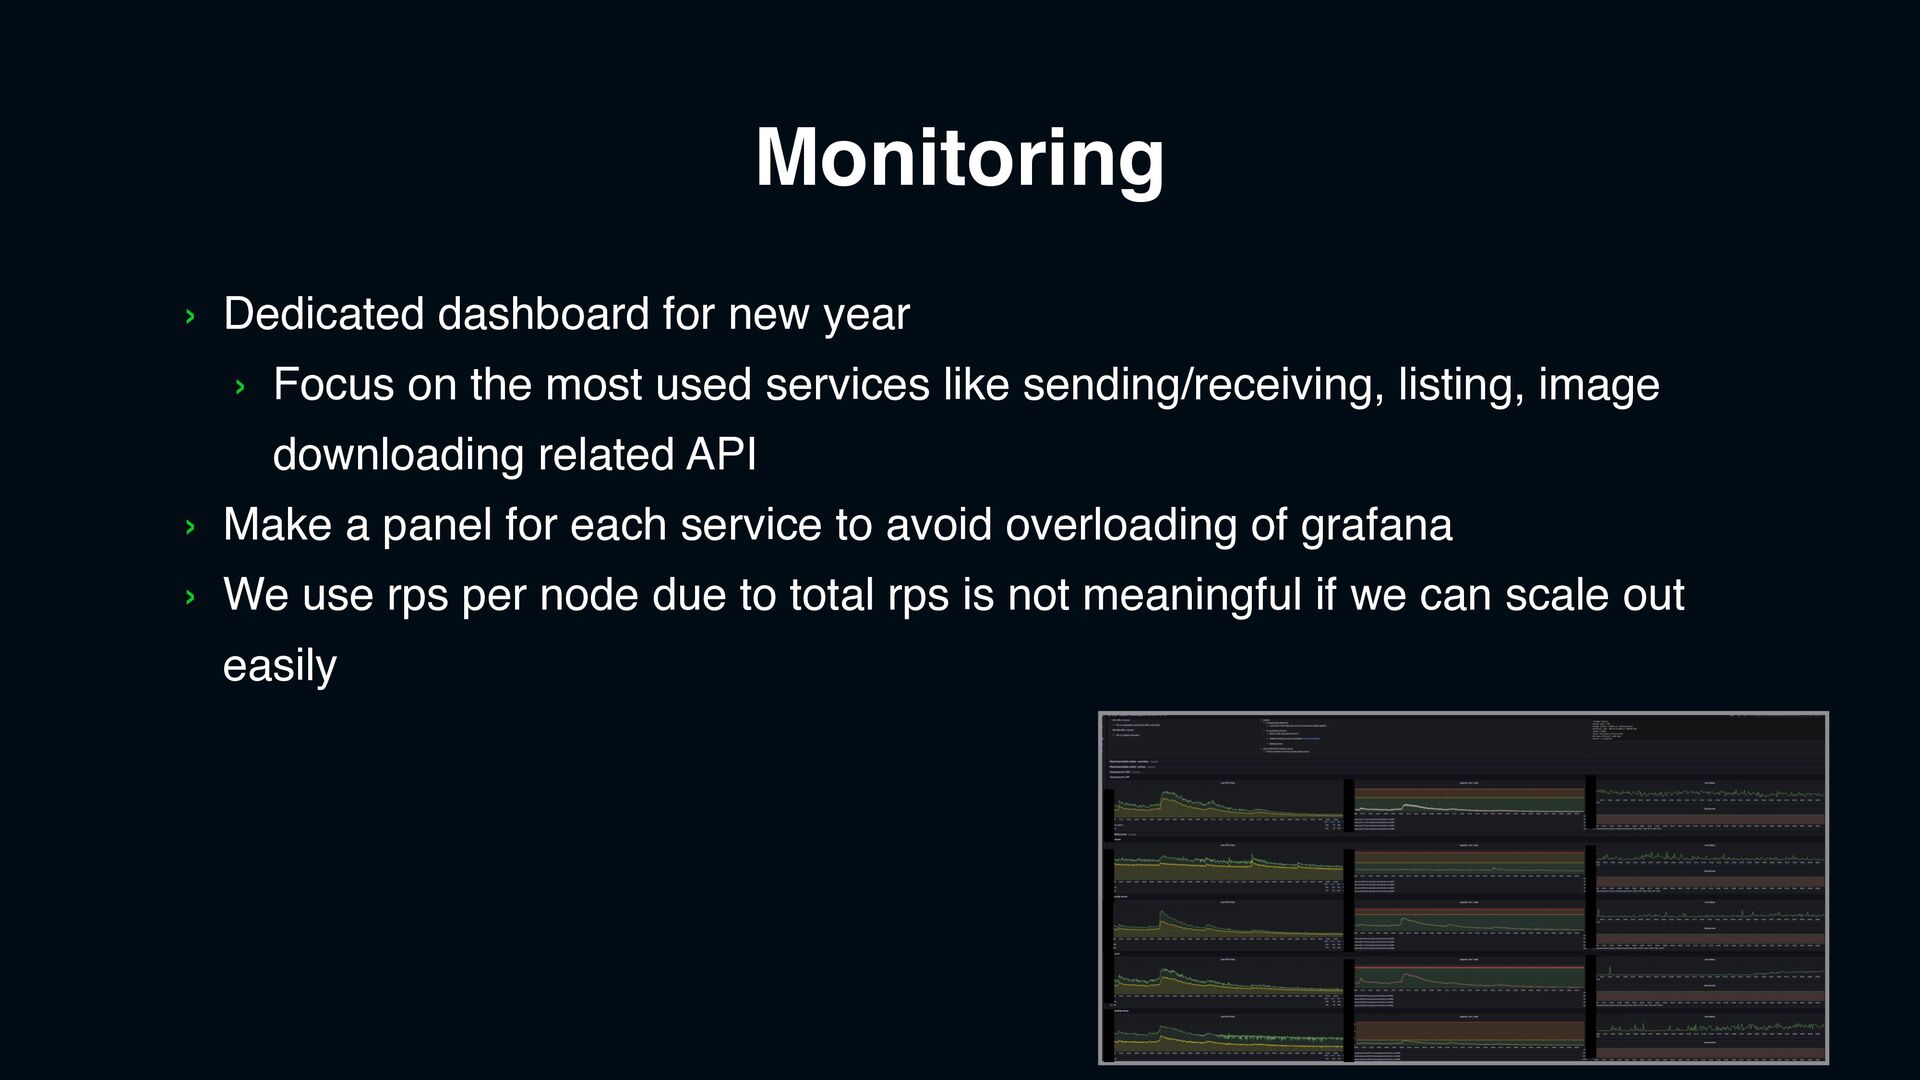
the most used services like sending/receiving, listing, image
    downloading related API
    › Make a panel for each service to avoid overloading of grafana
    › We use rps per node due to total rps is not meaningful if we can scale out
    easily

    View Slide

  25. Playbook for unexpected requests
    › More than what we estimated
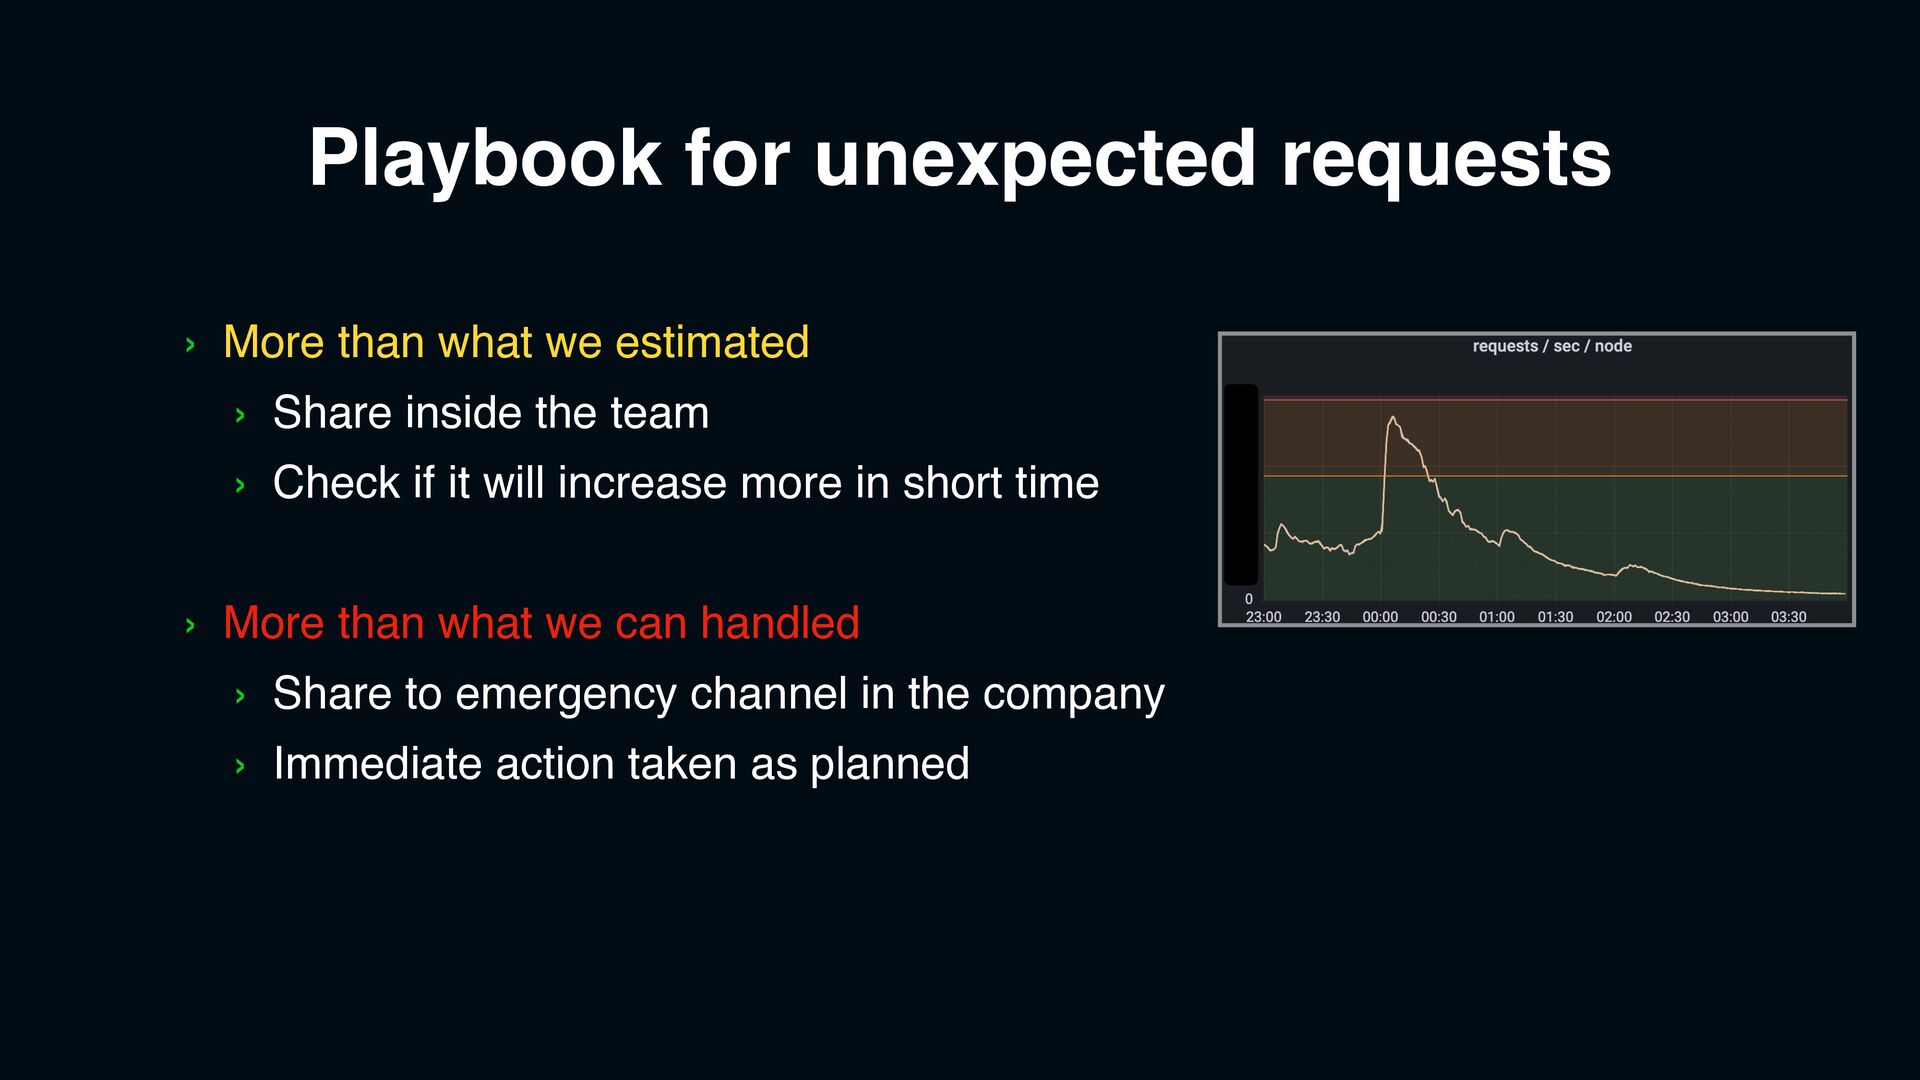
    › Share inside the team
    › Check if it will increase more in short time
    › More than what we can handled
    › Share to emergency channel in the company
    › Immediate action taken as planned

    View Slide

  26. Preparing for priority load shedding
    › We have throttling feature 
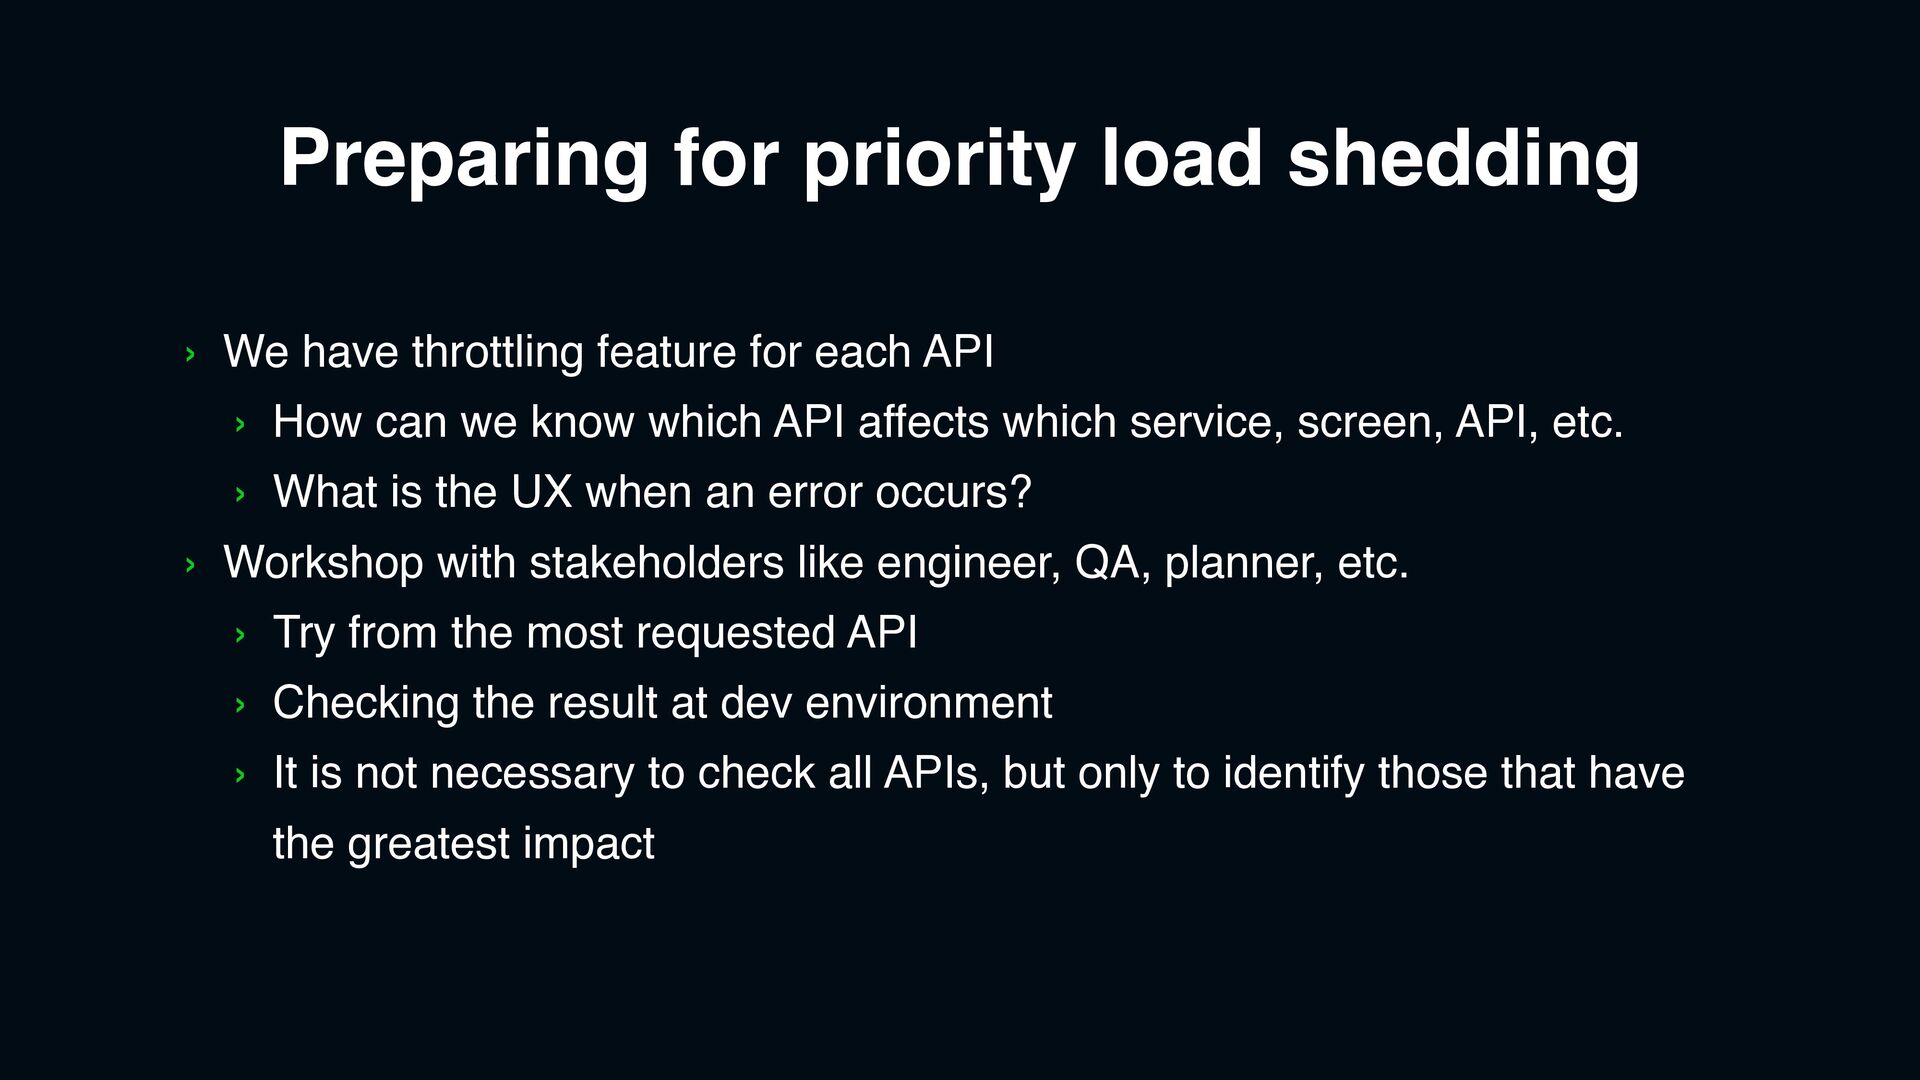
for each API
    › How can we know which API affects which service, screen, API, etc.
    › What is the UX when an error occurs?
    › Workshop with stakeholders like engineer, QA, planner, etc.
    › Try from the most requested API
    › Checking the result at dev environment
    › It is not necessary to check all APIs, but only to identify those that have
    the greatest impact

    View Slide

  27. Result
    › Improved our services during preparation
    › Able to predict the number more accurately each year
    › Overall service was stable on New Year's Eve 2022 and 2023

    View Slide

  28. Thank you

    View Slide