just “support groups” for products, they are the actual product. The difference between Web2 and Web3 is ownership: in Web2, communities are audiences; in Web3, communities are co-creators. This makes data-driven decision-making essential. Unlike Web2, growth is not just about vanity metrics, it's about trust, decentralization, and engagement
decentralized, traditional growth models don’t always apply. In a DAO (Decentralized Autonomous Organization) or NFT project, people join because they see value, belonging, and ownership. Infact, people join a community cause of the hype, after that what next? This is where Data come in, it helps us understand if our community is actually thriving, or if we’re just collecting numbers.
by follower count or Discord size. The problem? These are vanity metrics. You can have 100,000 Discord members and still have no meaningful activity, no contributors, and no participation or whatsoever. In community management, metrics are measurable indicators that show how healthy, active, and valuable your community is. They help you understand: 1. Who is in the community (growth and demographics) 2. How they interact (engagement and participation) 3. What value they create (contributions and impact) 4. Whether they stay long-term (retention and loyalty)
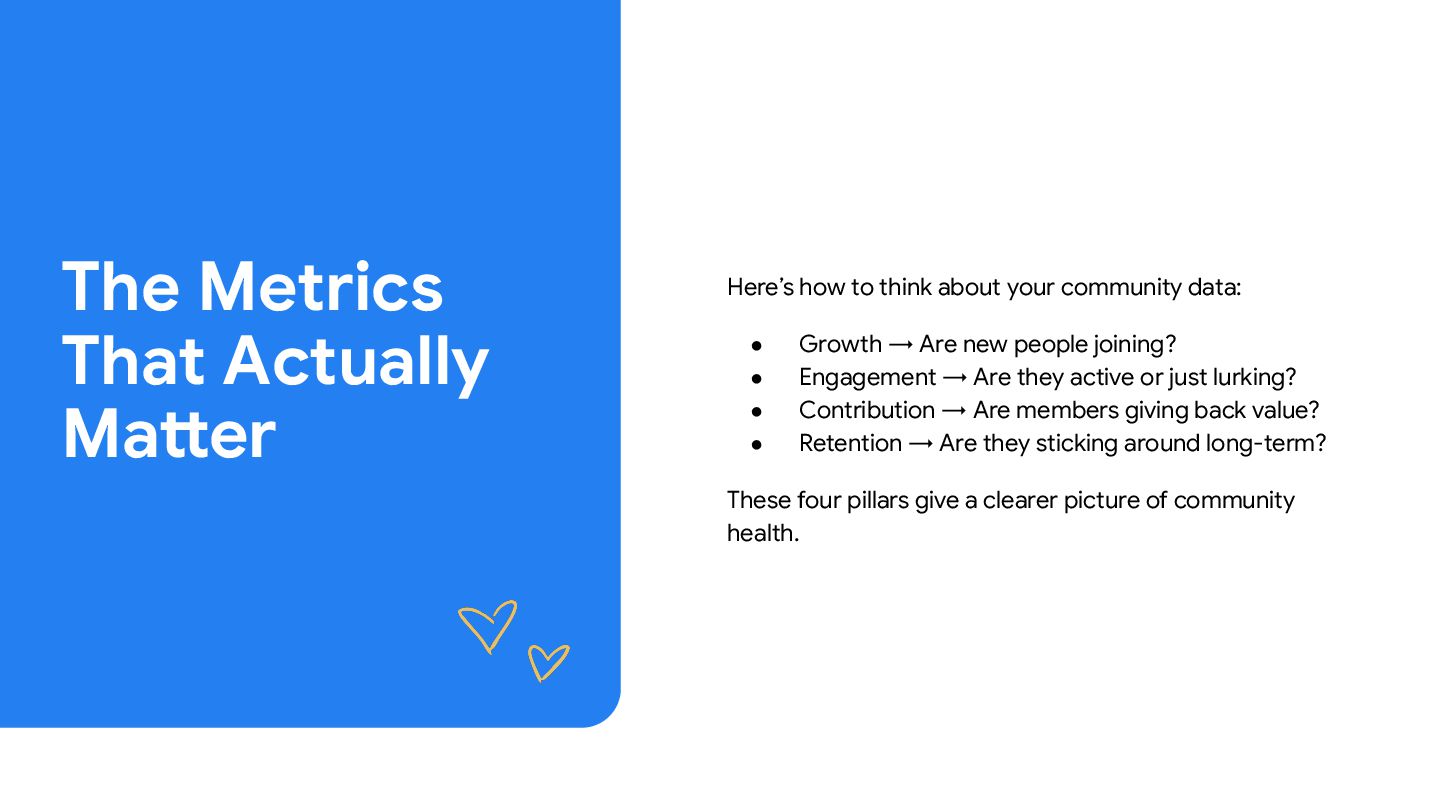
your community data: • Growth → Are new people joining? • Engagement → Are they active or just lurking? • Contribution → Are members giving back value? • Retention → Are they sticking around long-term? These four pillars give a clearer picture of community health.
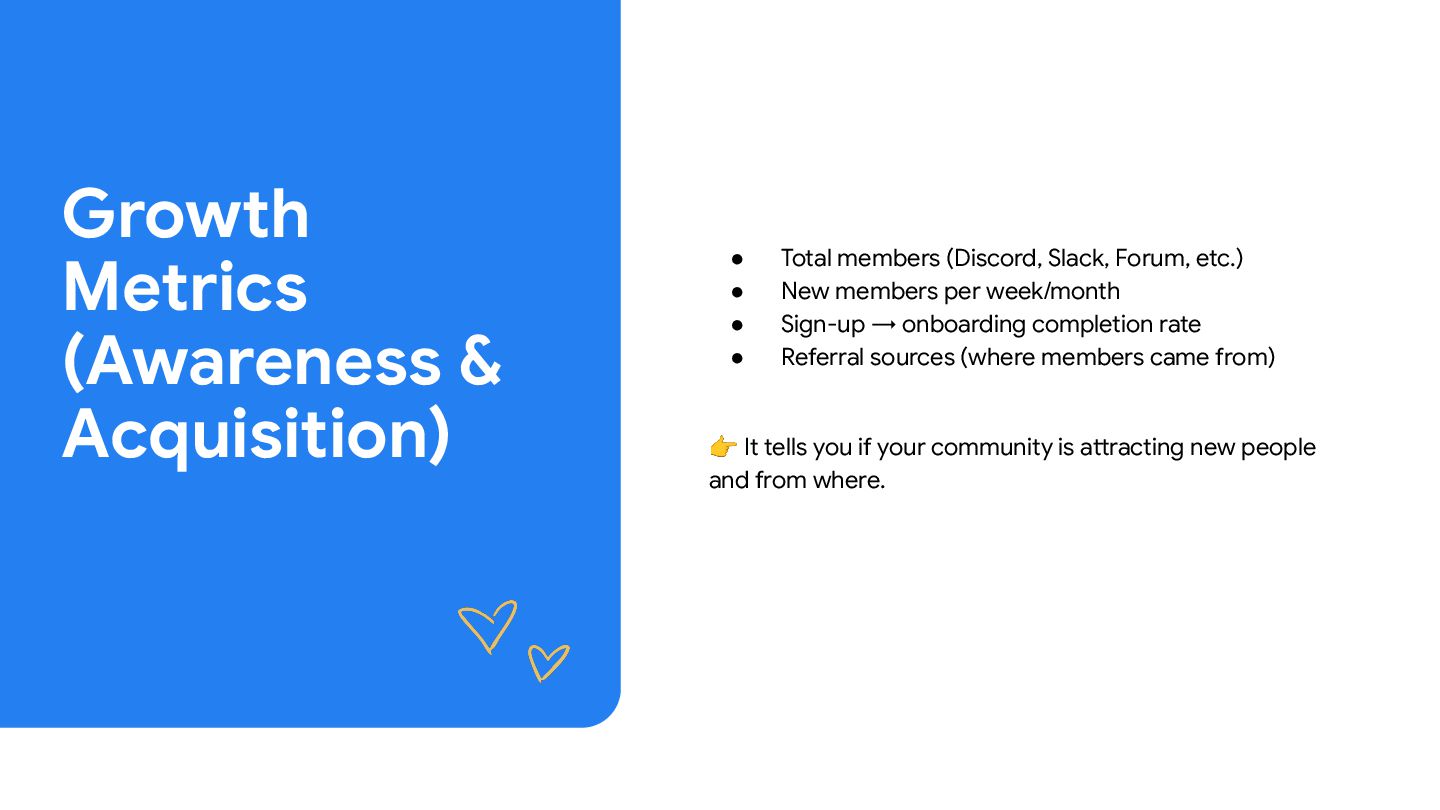
Forum, etc.) • New members per week/month • Sign-up → onboarding completion rate • Referral sources (where members came from) 👉 It tells you if your community is attracting new people and from where.
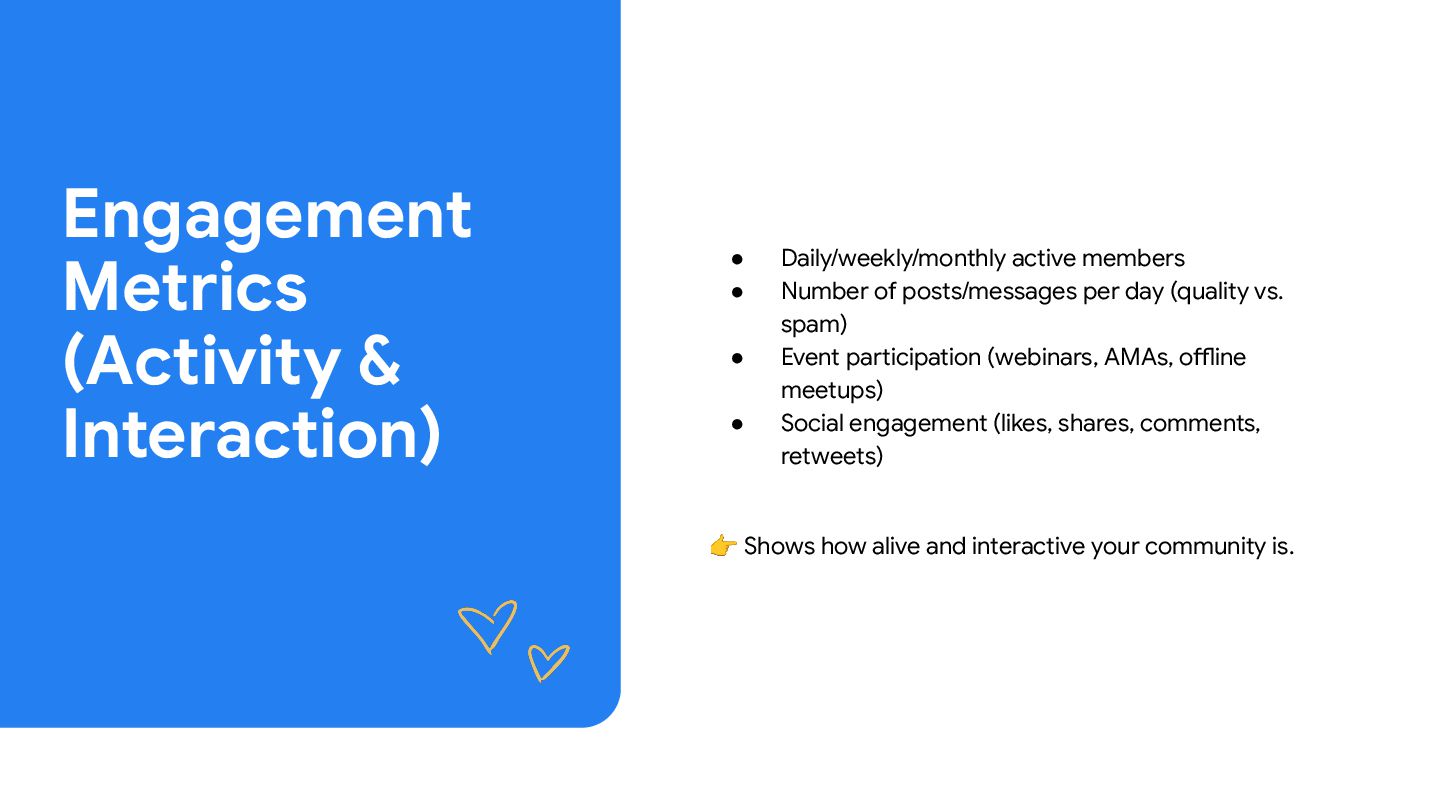
Number of posts/messages per day (quality vs. spam) • Event participation (webinars, AMAs, offline meetups) • Social engagement (likes, shares, comments, retweets) 👉 Shows how alive and interactive your community is.
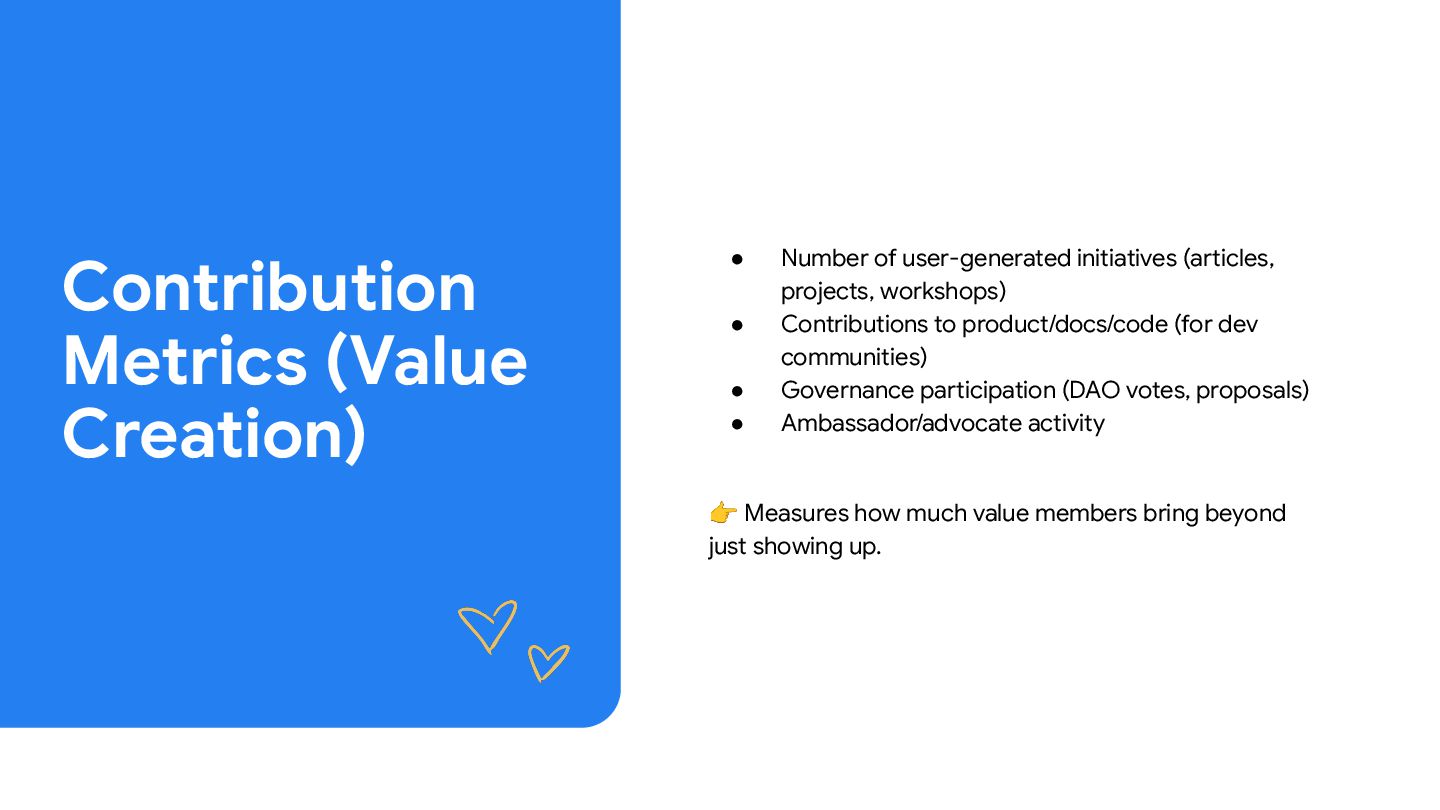
projects, workshops) • Contributions to product/docs/code (for dev communities) • Governance participation (DAO votes, proposals) • Ambassador/advocate activity 👉 Measures how much value members bring beyond just showing up.
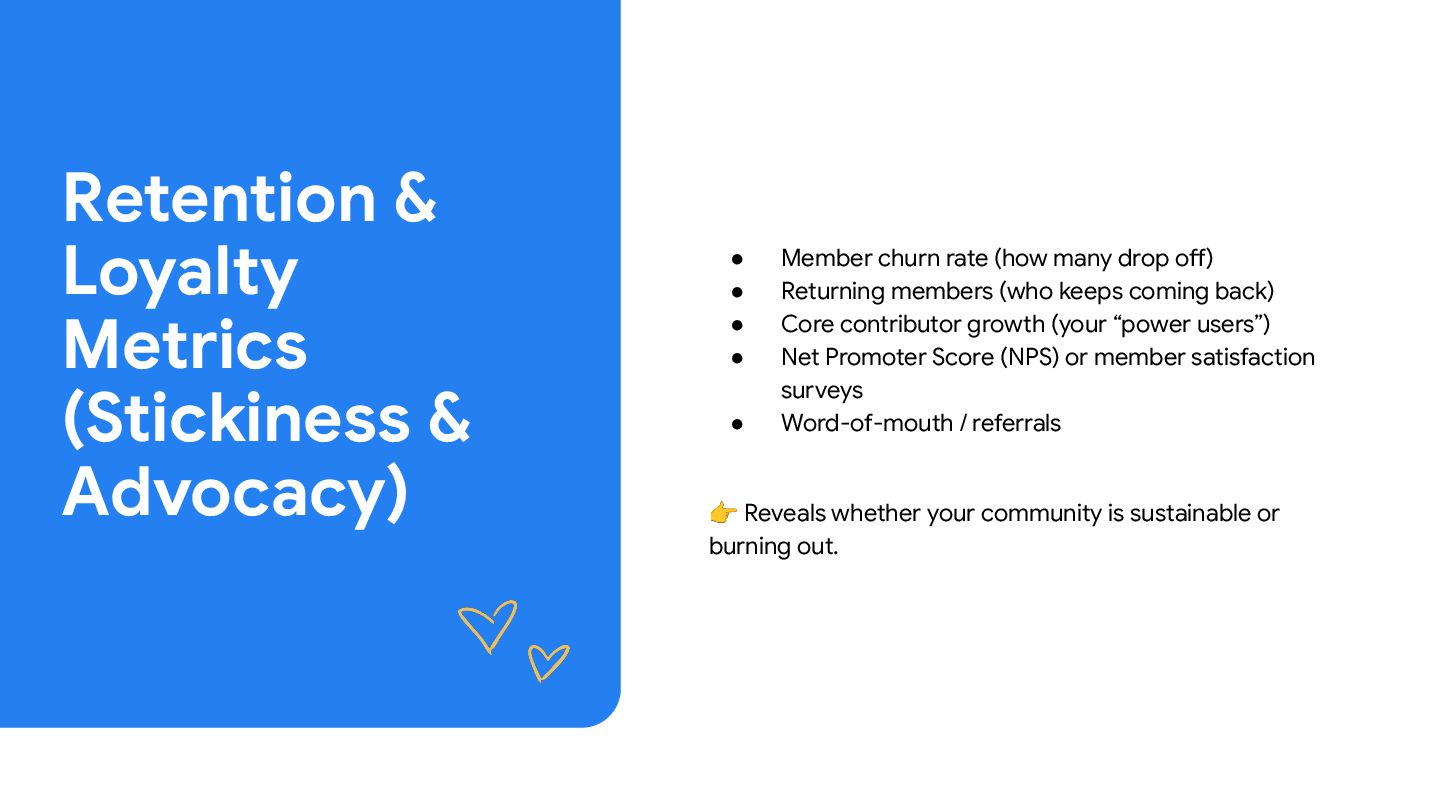
rate (how many drop off) • Returning members (who keeps coming back) • Core contributor growth (your “power users”) • Net Promoter Score (NPS) or member satisfaction surveys • Word-of-mouth / referrals 👉 Reveals whether your community is sustainable or burning out.
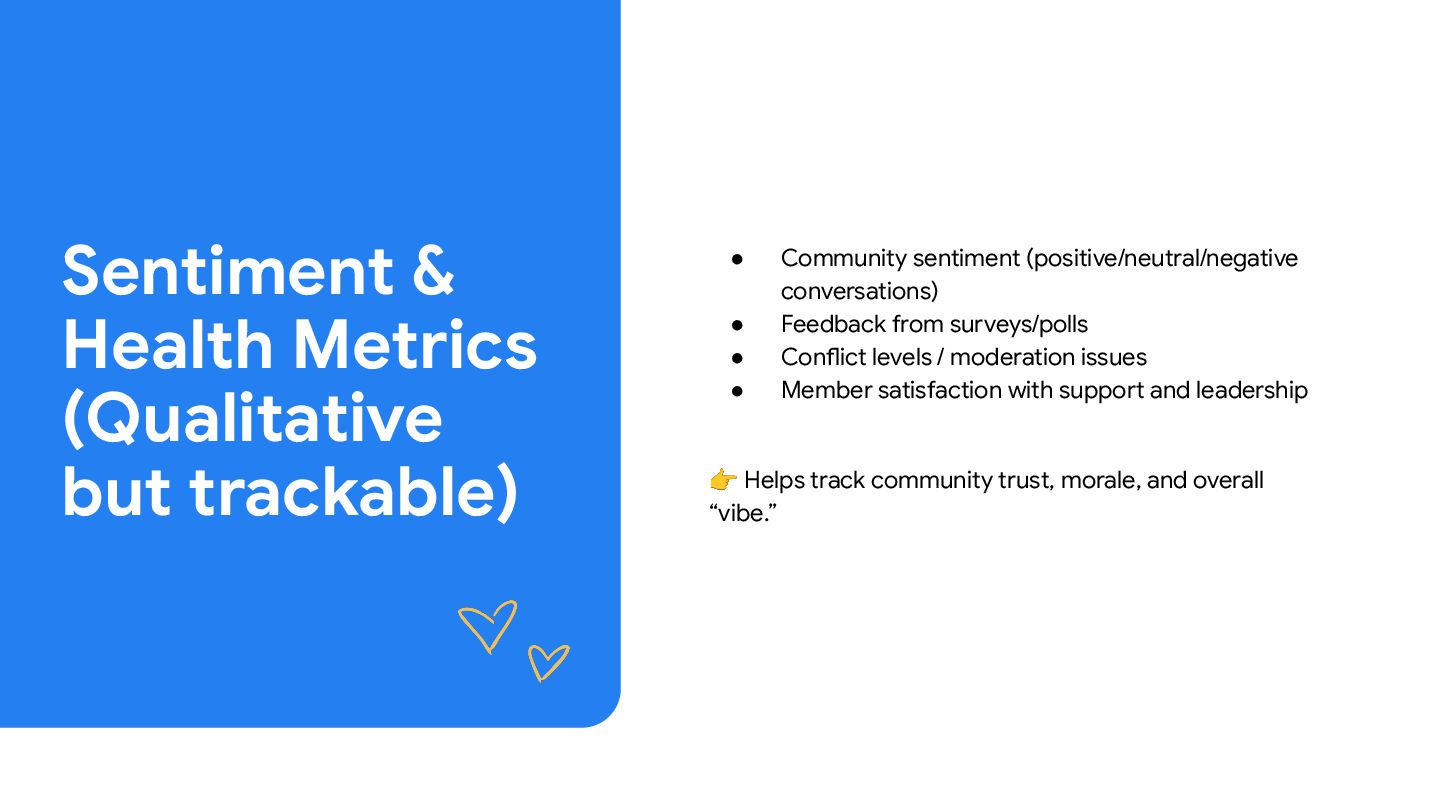
(positive/neutral/negative conversations) • Feedback from surveys/polls • Conflict levels / moderation issues • Member satisfaction with support and leadership 👉 Helps track community trust, morale, and overall “vibe.”
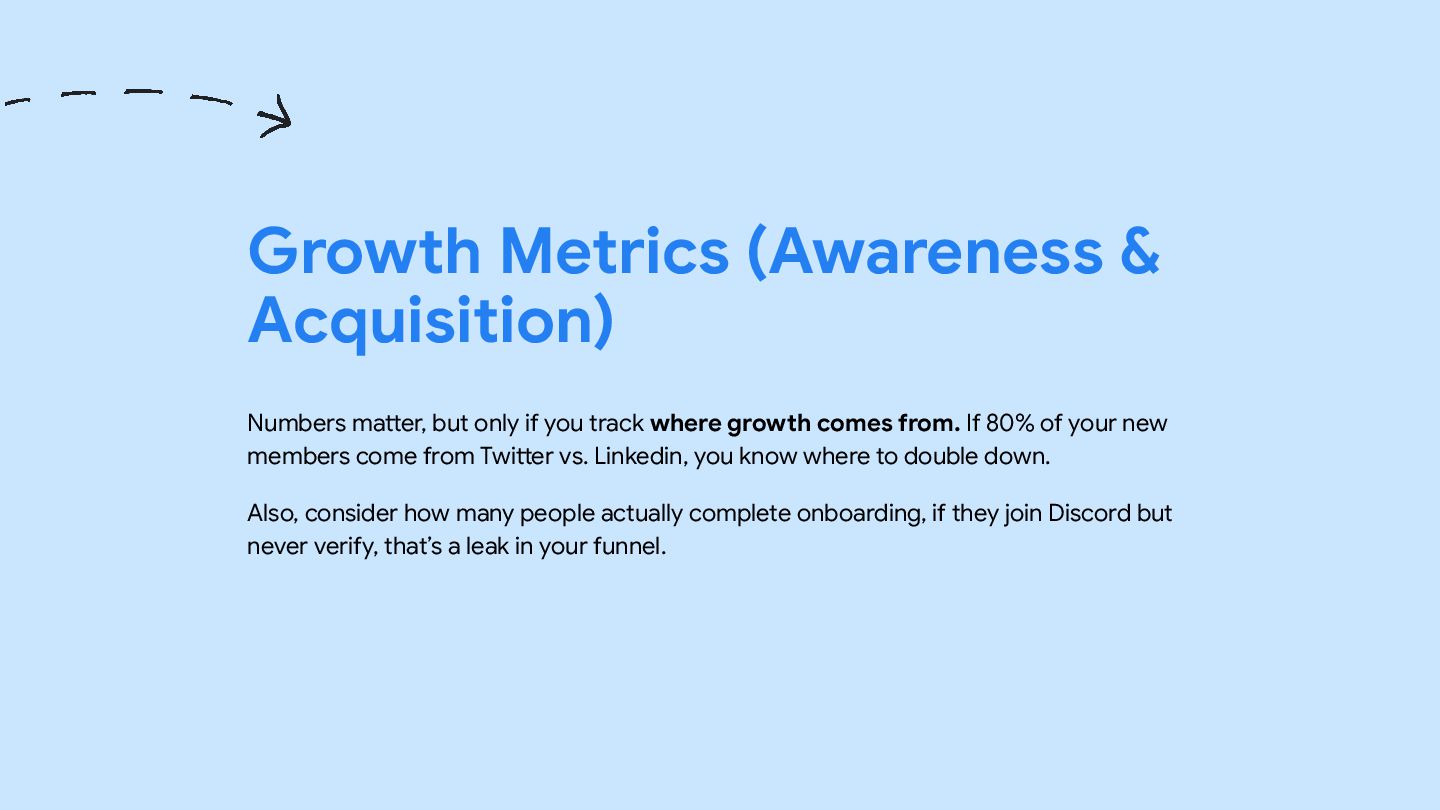
you track where growth comes from. If 80% of your new members come from Twitter vs. Linkedin, you know where to double down. Also, consider how many people actually complete onboarding, if they join Discord but never verify, that’s a leak in your funnel.
where people just say “gm” every morning. True engagement shows up in meaningful participation: discussions, event attendance, knowledge sharing. For example, if you see high AMA attendance but low follow-up discussions, it means you need better retention strategies post-event.
Web3 communities thrive when members don’t just consume, they contribute. That could mean committing code, moderating channels, creating memes, writing documentation, or submitting DAO proposals. Track both quantity and quality of contributions.
still be active if your core team disappeared for a week? Retention tells you if people feel true belonging. Look for how many keep showing up at events, how many come back to chat daily/weekly, and how many become advocates who onboard others.
your goals. • Balance quantitative (numbers) and qualitative (sentiment, feedback) data. • Remember: Your data should inform action. If engagement is low, don’t just report it, experiment with formats, reward systems, or better onboarding. Key Insights for Builders & Managers
ownership, trust, and shared purpose. If you measure what matters, you can build stronger, more sustainable communities that outlast hype cycles. So before you leave here today, ask yourself: • “What metrics am I currently tracking? • “Are they vanity-driven, or do they reflect true community value?”