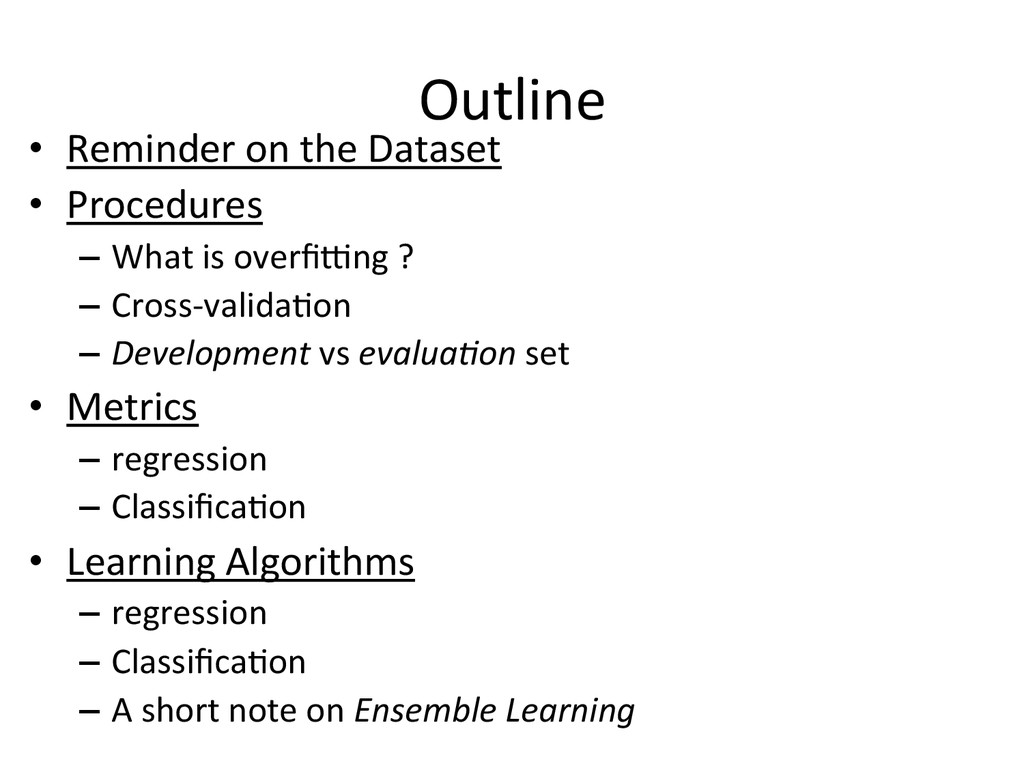
Procedures – What is overfiJng ? – Cross-‐valida6on – Development vs evalua,on set • Metrics – regression – Classifica6on • Learning Algorithms – regression – Classifica6on – A short note on Ensemble Learning
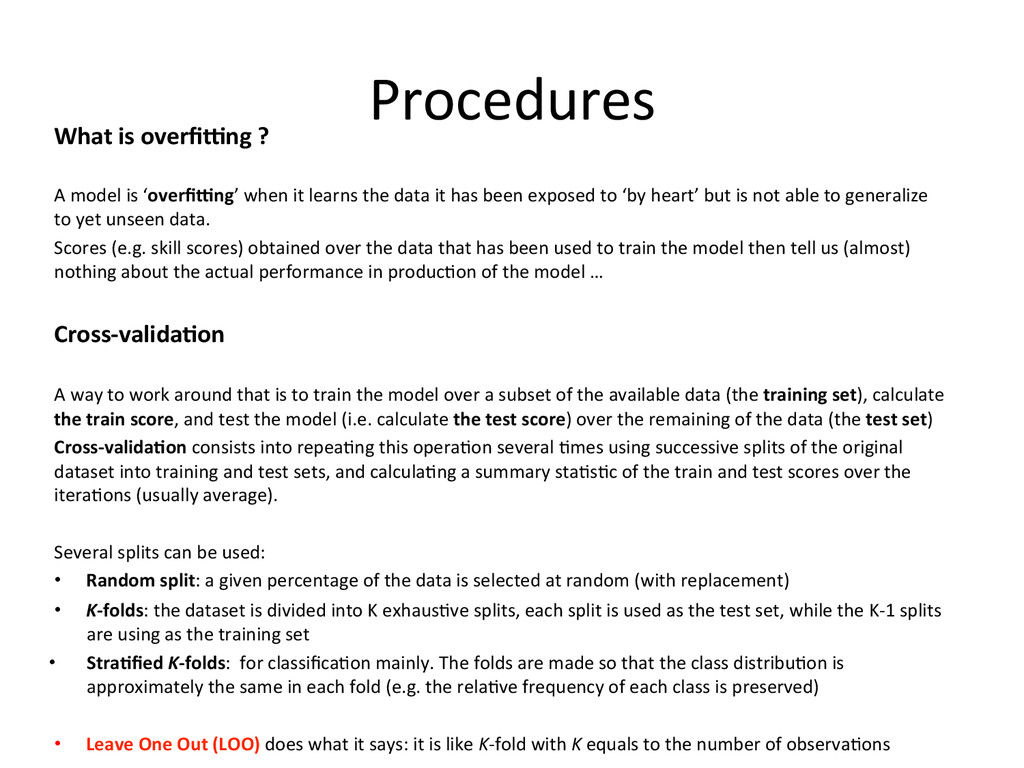
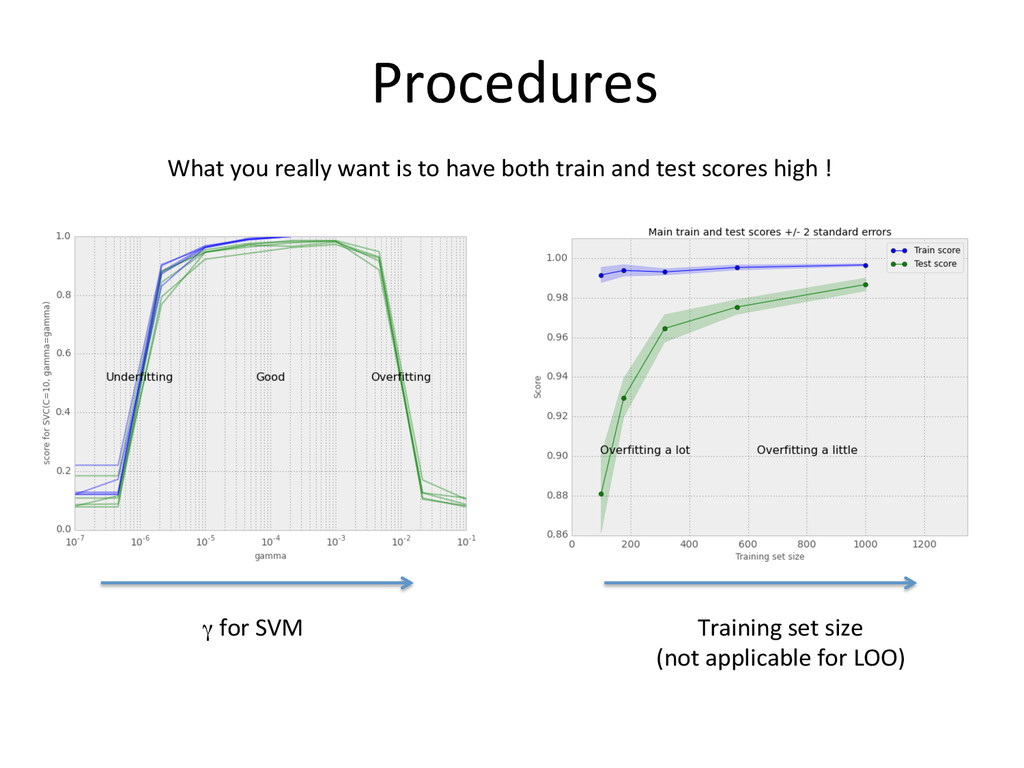
model is ‘overfi-ng’ when it learns the data it has been exposed to ‘by heart’ but is not able to generalize to yet unseen data. Scores (e.g. skill scores) obtained over the data that has been used to train the model then tell us (almost) nothing about the actual performance in produc6on of the model … Cross-‐valida5on A way to work around that is to train the model over a subset of the available data (the training set), calculate the train score, and test the model (i.e. calculate the test score) over the remaining of the data (the test set) Cross-‐valida5on consists into repea6ng this opera6on several 6mes using successive splits of the original dataset into training and test sets, and calcula6ng a summary sta6s6c of the train and test scores over the itera6ons (usually average). Several splits can be used: • Random split: a given percentage of the data is selected at random (with replacement) • K-‐folds: the dataset is divided into K exhaus6ve splits, each split is used as the test set, while the K-‐1 splits are using as the training set • Stra5fied K-‐folds: for classifica6on mainly. The folds are made so that the class distribu6on is approximately the same in each fold (e.g. the rela6ve frequency of each class is preserved) • Leave One Out (LOO) does what it says: it is like K-‐fold with K equals to the number of observa6ons
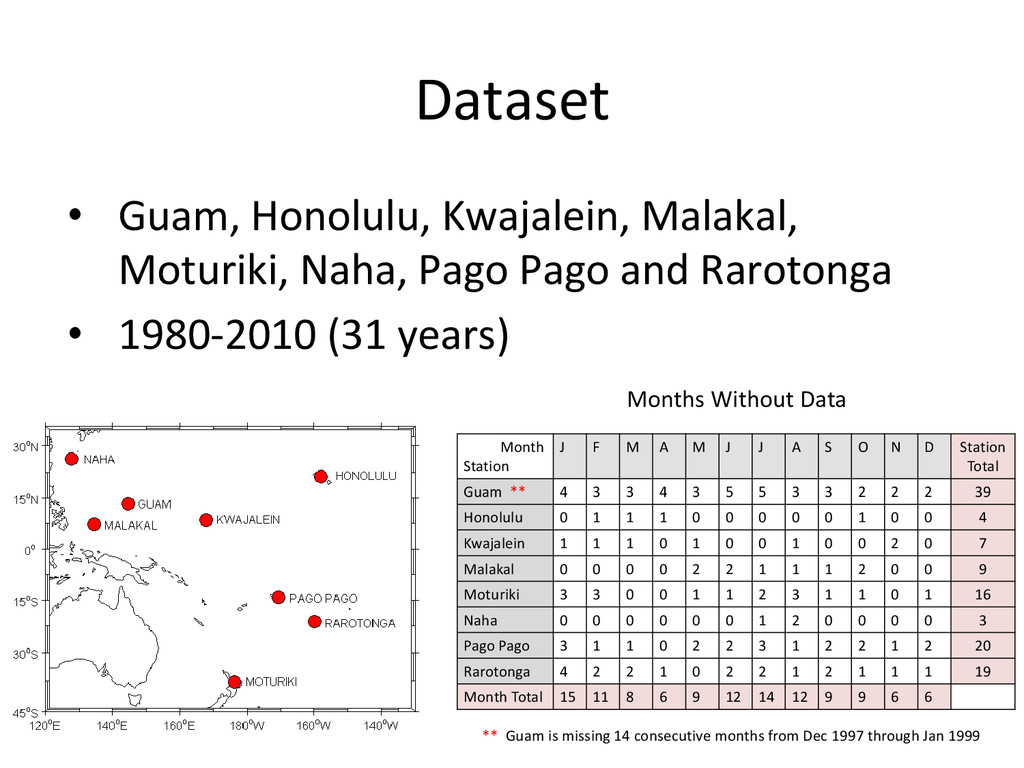
Even cross-‐validated test-‐scores can give an unrealis6c es6mate of the ability of the model to generalize if the distribu5on changes with 5me (non-‐sta5onarity) This non-‐sta5onarity however is something that we could expect in the context of climate change / sea-‐level-‐rise It can be partly taken into account by including a ‘trend’ predictor But I would argue to: 1. held out ~ 2 years of data (2009-‐2010) as an evalua6on set. 2. Con6nue the models evalua6on in real-‐6me to detect any trend in the model’s performance
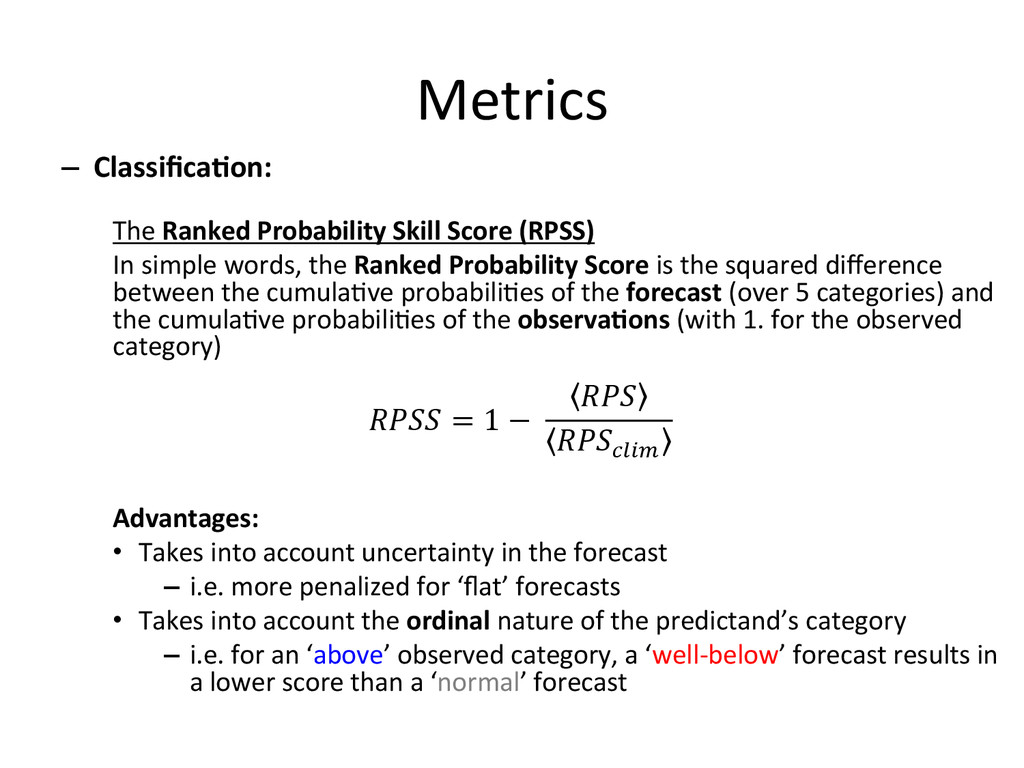
score How much beher than a ‘null’ forecast are we doing ? – Random – Climatology – Some requirements • For regression: – penalizing large errors • For classifica6on (probabili6es ahached to each of 5 classes): – Take into account the probabili6es ranking (ordinal)
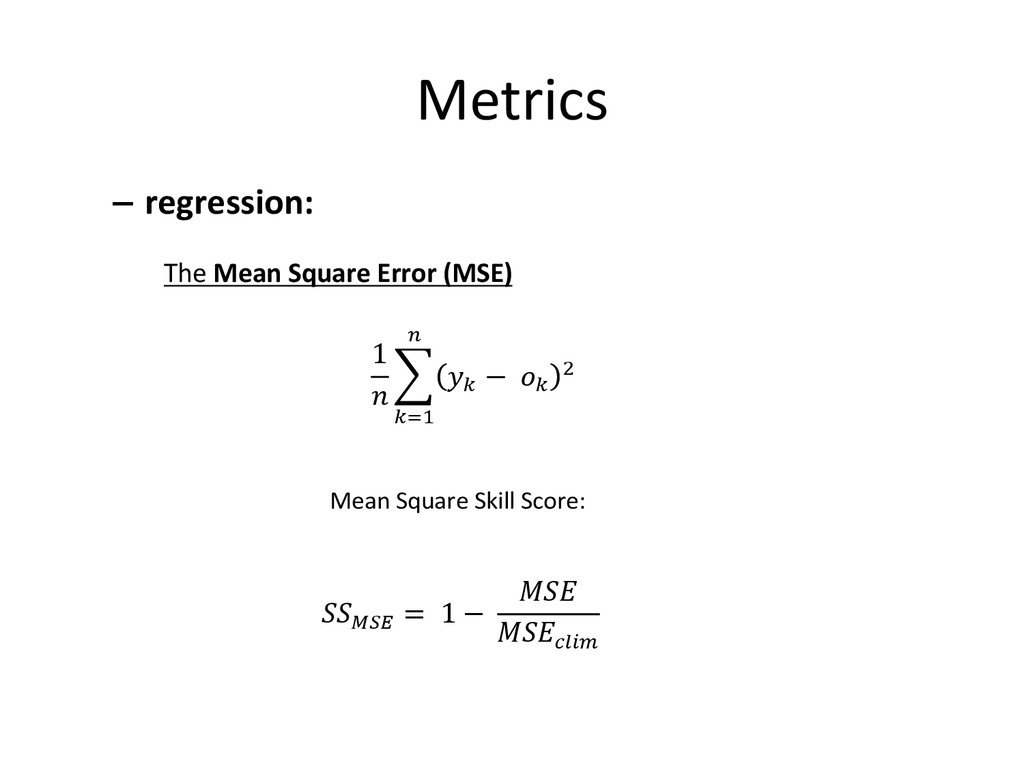
Score (RPSS) In simple words, the Ranked Probability Score is the squared difference between the cumula6ve probabili6es of the forecast (over 5 categories) and the cumula6ve probabili6es of the observa5ons (with 1. for the observed category) Advantages: • Takes into account uncertainty in the forecast – i.e. more penalized for ‘flat’ forecasts • Takes into account the ordinal nature of the predictand’s category – i.e. for an ‘above’ observed category, a ‘well-‐below’ forecast results in a lower score than a ‘normal’ forecast his!is!the!equation!for!a!single!forecast!–!observation!pair,!for!a!collection!o orecasts!over!a!given!time!period,!one!simply!averages!the!RPS!values!for!ea orecast!–!observation!pair.!! !"# =! 1 ! !"#! ! !!! !! he!skill!score!can!be!computed!as!usual!as:!! !"## = 1 −! !"# !"#!"#$ ! ome*references* Daniel!S.!Wilks:!Statistical!Methods!in!the!Atmospheric!Sciences.! nternational!Geophysics!Series.!Academic!Press,!627p.!see!in!particular!Chapt :!forecast!verification,!pp!255!–!335.!
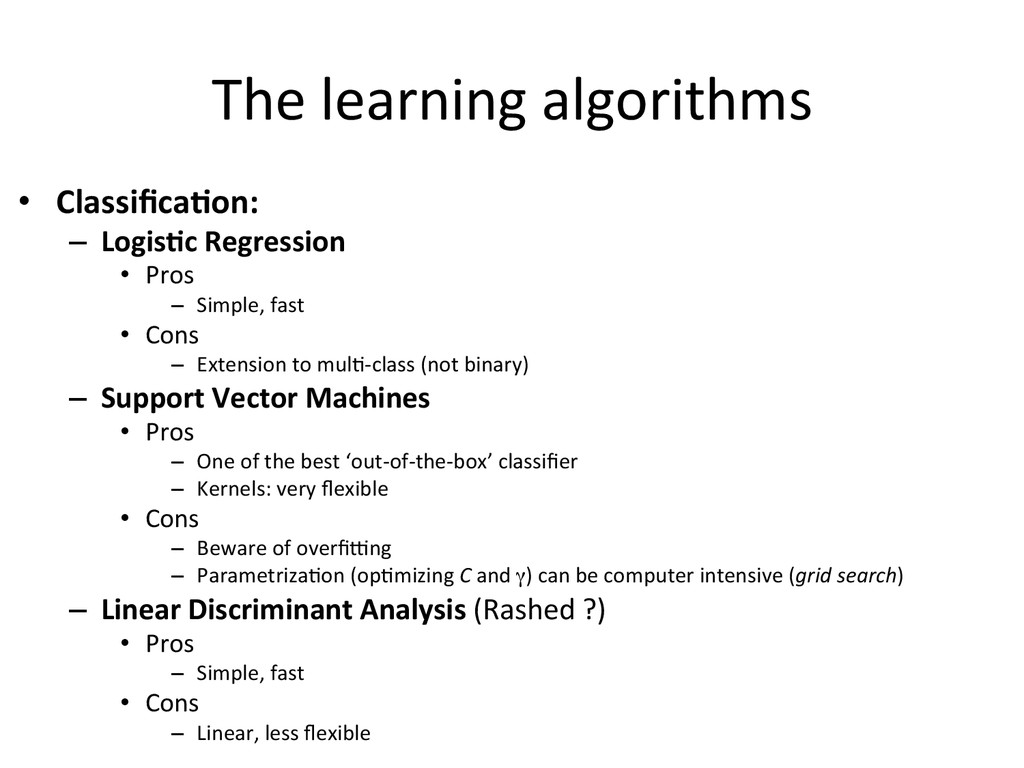
Regression • Pros – Simple, fast • Cons – Extension to mul6-‐class (not binary) – Support Vector Machines • Pros – One of the best ‘out-‐of-‐the-‐box’ classifier – Kernels: very flexible • Cons – Beware of overfiJng – Parametriza6on (op6mizing C and γ) can be computer intensive (grid search) – Linear Discriminant Analysis (Rashed ?) • Pros – Simple, fast • Cons – Linear, less flexible
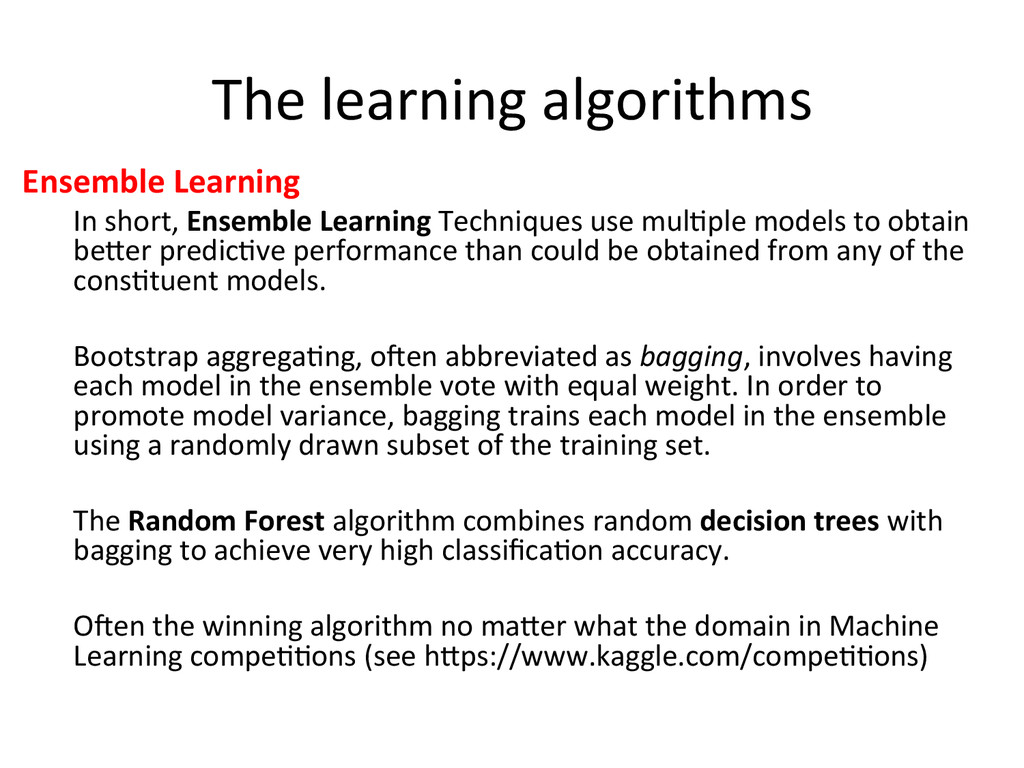
Learning Techniques use mul6ple models to obtain beher predic6ve performance than could be obtained from any of the cons6tuent models. Bootstrap aggrega6ng, ooen abbreviated as bagging, involves having each model in the ensemble vote with equal weight. In order to promote model variance, bagging trains each model in the ensemble using a randomly drawn subset of the training set. The Random Forest algorithm combines random decision trees with bagging to achieve very high classifica6on accuracy. Ooen the winning algorithm no maher what the domain in Machine Learning compe66ons (see hhps://www.kaggle.com/compe66ons)