Upgrade to Pro
— share decks privately, control downloads, hide ads and more …
Speaker Deck
Features
Speaker Deck
PRO
Sign in
Sign up for free
Search
Search
因子型を使いこなそう@fukuoka.R#09
Search
nonki1974
September 09, 2017
Technology
250
0
Share
Embed
Copy iframe code
Copy JS code
Copy link
Start on current slide
因子型を使いこなそう@fukuoka.R#09
fukuoka.R #09 (2017/09/09) の発表資料
nonki1974
September 09, 2017
More Decks by nonki1974
See All by nonki1974
GTFS with Tidytransit package
nonki1974
0
340
TokyoR#84_Rexams
nonki1974
0
230
都道府県別焼き鳥屋ランキングの作成
nonki1974
1
930
Introduction to R
nonki1974
0
390
Introduction to dplyr
nonki1974
0
560
Introduction to ggplot2
nonki1974
1
540
Analyzing PSB tracks with R
nonki1974
0
620
introduction to fukuoka.R @ Fukuoka.LT
nonki1974
0
81
所要時間のヒートマップを作成する
nonki1974
0
600
Other Decks in Technology
See All in Technology
ここは地獄!つらい朝会を体験することで、チームとしてのより良い振る舞いに気づくワークショップ / The stand-up meeting from hell in the game industry
scrummasudar
0
230
凡エンジニアがこの先生きのこるためには。〜TypeScript完全に理解したい〜
alchemy1115
2
420
[Droidcon Orlando '26] The Android Lens: Applying Mobile Forensics to AI Performance
amanda_hinchman
1
110
AI時代の開発生産性は、個人技からチーム設計へ
moongift
PRO
4
2.5k
”AIを使う” から ”AIに任せる” へ ─ 開発プロセスを再設計してAIを組織標準にするまで
cyberagentdevelopers
PRO
1
140
20260720_クラウド女子会×PyLadiesTokyoコラボ Amazon Bedrock ハンズオン用資料
yuuka51
1
110
Webの技術とガジェットで子どもも大人も楽しめるワクワク体験を提供する / Qiita Tech Festa Day 2026
you
PRO
1
180
変更し続けられるシステムをどう保つか — AI時代のSSoTという設計原則
kawauso
1
1.1k
インシデント事例と パッケージの全量解析に学ぶ ソフトウェアサプライチェーンの守り方 / supply-chain-attack-defense
flatt_security
0
900
Multicaで30個のミニプロジェクトをAIエージェント運用して見えてきたこと
eiei114
1
630
探索・可視化・自動化を一本化 Amazon Quickでデータ活用スピードを上げる方法
koheiyoshikawa
0
170
全社でのソフトウェアサプライチェーン攻撃対策をやってみた with Takumi Guard
z63d
0
280
Featured
See All Featured
How to Create Impact in a Changing Tech Landscape [PerfNow 2023]
tammyeverts
55
3.4k
Navigating Weather and Climate Data
rabernat
0
400
Raft: Consensus for Rubyists
vanstee
141
7.6k
StorybookのUI Testing Handbookを読んだ
zakiyama
31
6.9k
Neural Spatial Audio Processing for Sound Field Analysis and Control
skoyamalab
0
380
Applied NLP in the Age of Generative AI
inesmontani
PRO
4
2.4k
Building the Perfect Custom Keyboard
takai
2
820
JAMstack: Web Apps at Ludicrous Speed - All Things Open 2022
reverentgeek
1
500
Evolving SEO for Evolving Search Engines
ryanjones
0
240
The Psychology of Web Performance [Beyond Tellerrand 2023]
tammyeverts
49
3.5k
Design of three-dimensional binary manipulators for pick-and-place task avoiding obstacles (IECON2024)
konakalab
0
490
Faster Mobile Websites
deanohume
310
32k
Transcript
因子型を使いこなそう! @nonki1974 2017/09/09 fukuoka.R#09
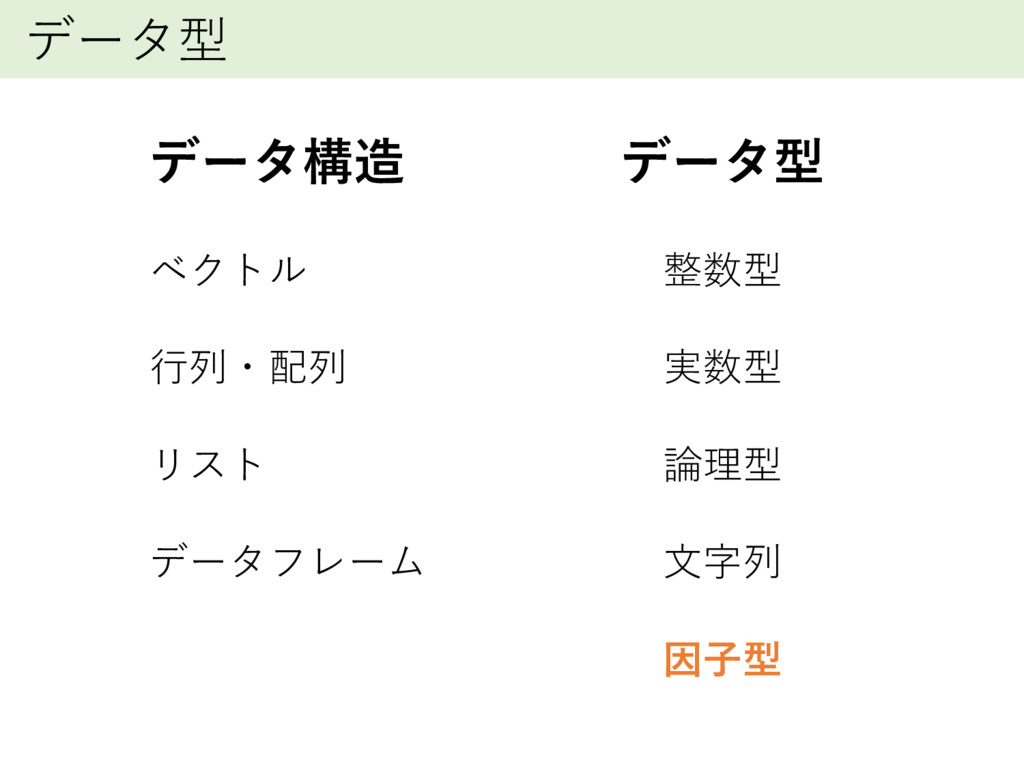
データ型 データ構造 データ型 ベクトル 行列・配列 リスト データフレーム 整数型 実数型 論理型
文字列 因子型
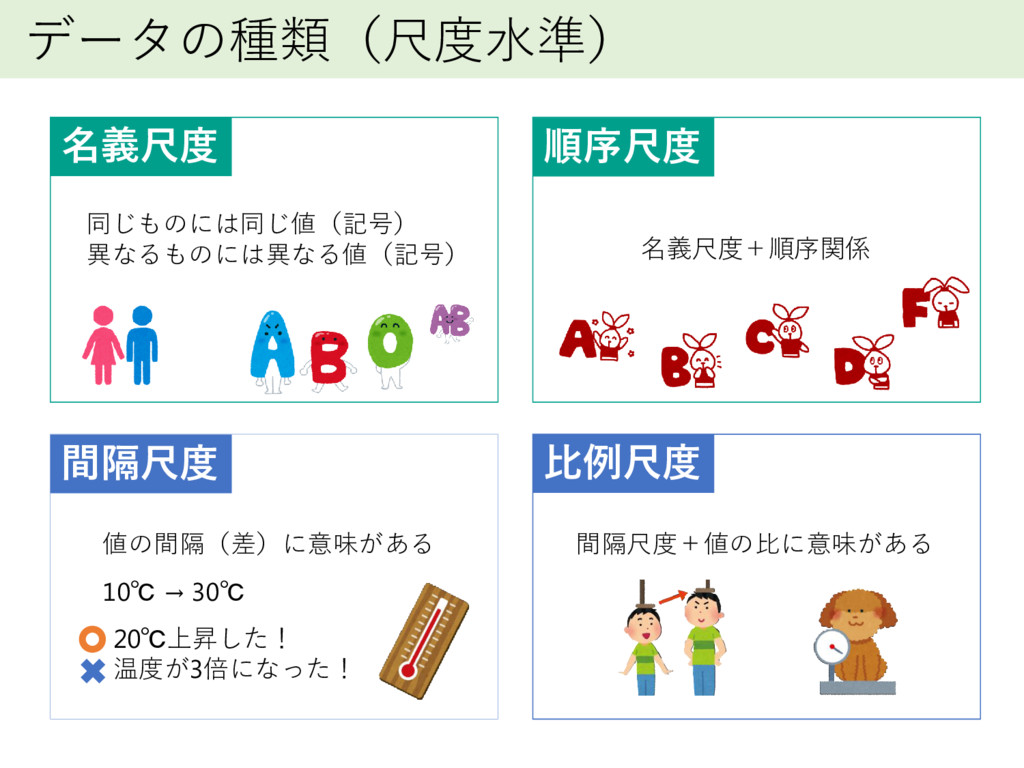
データの種類(尺度水準) 名義尺度 順序尺度 間隔尺度 比例尺度 同じものには同じ値(記号) 異なるものには異なる値(記号) 名義尺度+順序関係 値の間隔(差)に意味がある 10℃
→ 30℃ 20℃上昇した! 温度が3倍になった! 間隔尺度+値の比に意味がある
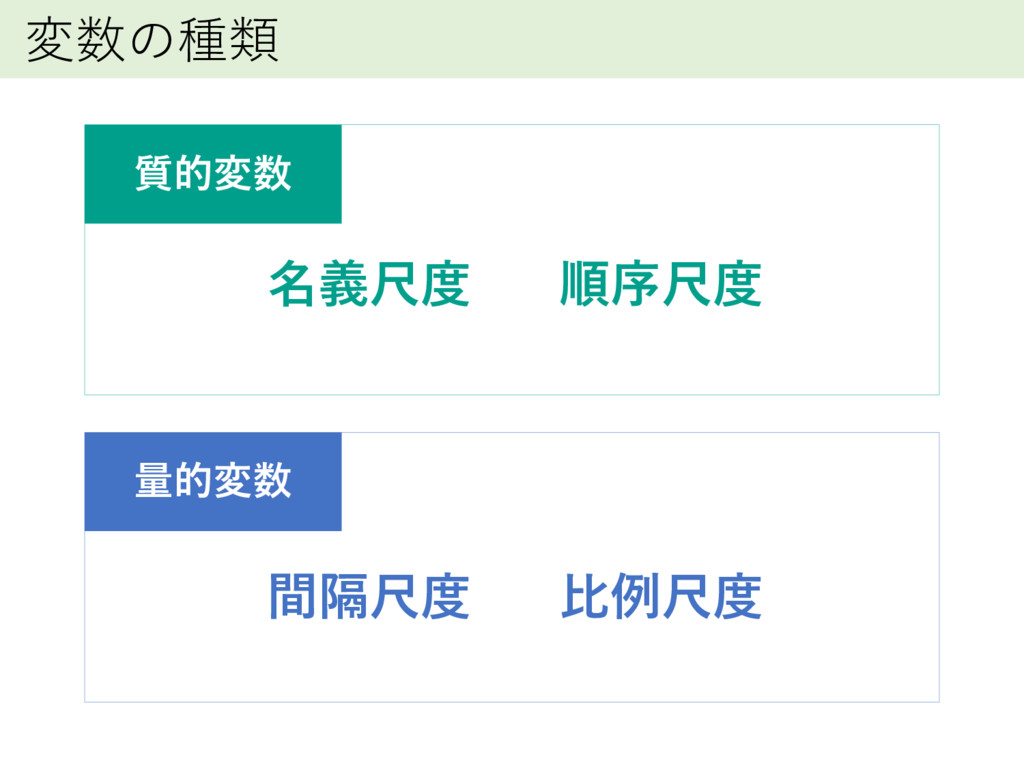
変数の種類 質的変数 名義尺度 順序尺度 量的変数 間隔尺度 比例尺度
変数の種類 質的変数 名義尺度 順序尺度 量的変数 間隔尺度 比例尺度 因子型
とりあえず文字型 > bloodtype <- c("B","A","A","A","AB", + "B","AB","A","A","A","C") > bloodtype [1]
"B" "A" "A" "A" "AB" "B" "AB" [8] "A" "A" "A" "C" > table(bloodtype) bloodtype A AB B C 6 2 2 1
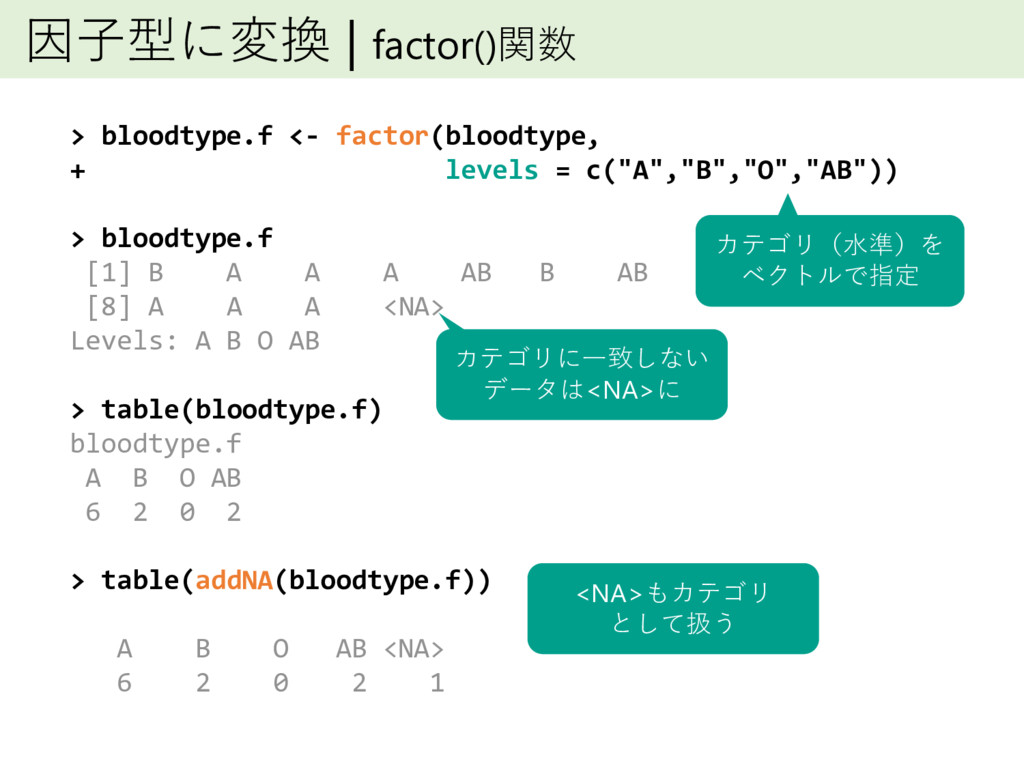
因子型に変換 | factor()関数 > bloodtype.f <- factor(bloodtype, + levels =
c("A","B","O","AB")) > bloodtype.f [1] B A A A AB B AB [8] A A A <NA> Levels: A B O AB > table(bloodtype.f) bloodtype.f A B O AB 6 2 0 2 > table(addNA(bloodtype.f)) A B O AB <NA> 6 2 0 2 1 カテゴリ(水準)を ベクトルで指定 カテゴリに一致しない データは<NA>に <NA>もカテゴリ として扱う
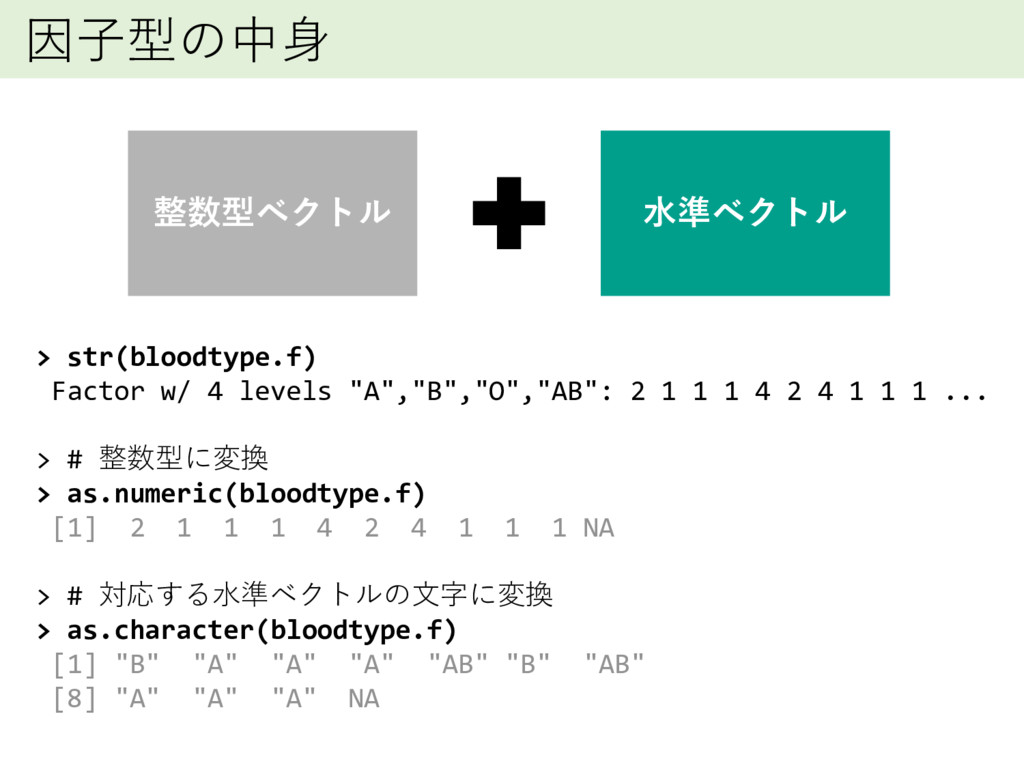
因子型の中身 整数型ベクトル 水準ベクトル > str(bloodtype.f) Factor w/ 4 levels "A","B","O","AB":
2 1 1 1 4 2 4 1 1 1 ... > # 整数型に変換 > as.numeric(bloodtype.f) [1] 2 1 1 1 4 2 4 1 1 1 NA > # 対応する水準ベクトルの文字に変換 > as.character(bloodtype.f) [1] "B" "A" "A" "A" "AB" "B" "AB" [8] "A" "A" "A" NA
データフレーム > pokemon <- read.csv("pokemon.csv") > head(pokemon$type1) [1] くさ みず
むし むし ノーマル [6] ノーマル 15 Levels: あく いわ エスパー かくとう ... むし 文字列を含んだ列は因子型として読み込まれる
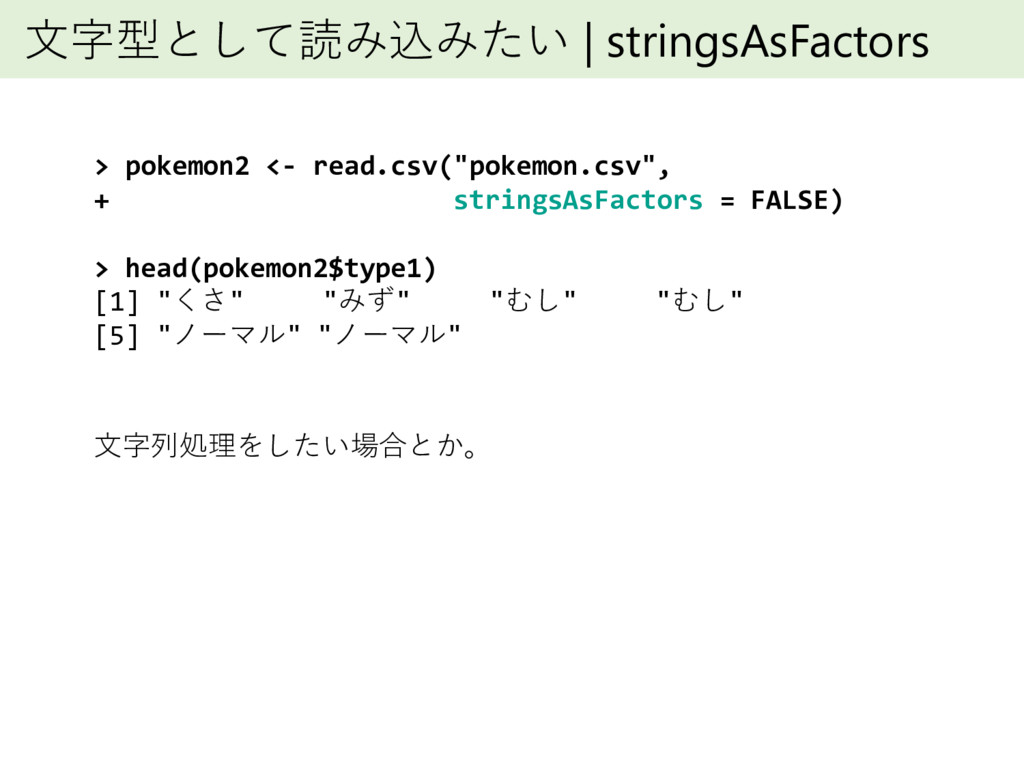
文字型として読み込みたい | stringsAsFactors > pokemon2 <- read.csv("pokemon.csv", + stringsAsFactors =
FALSE) > head(pokemon2$type1) [1] "くさ" "みず" "むし" "むし" [5] "ノーマル" "ノーマル" 文字列処理をしたい場合とか。
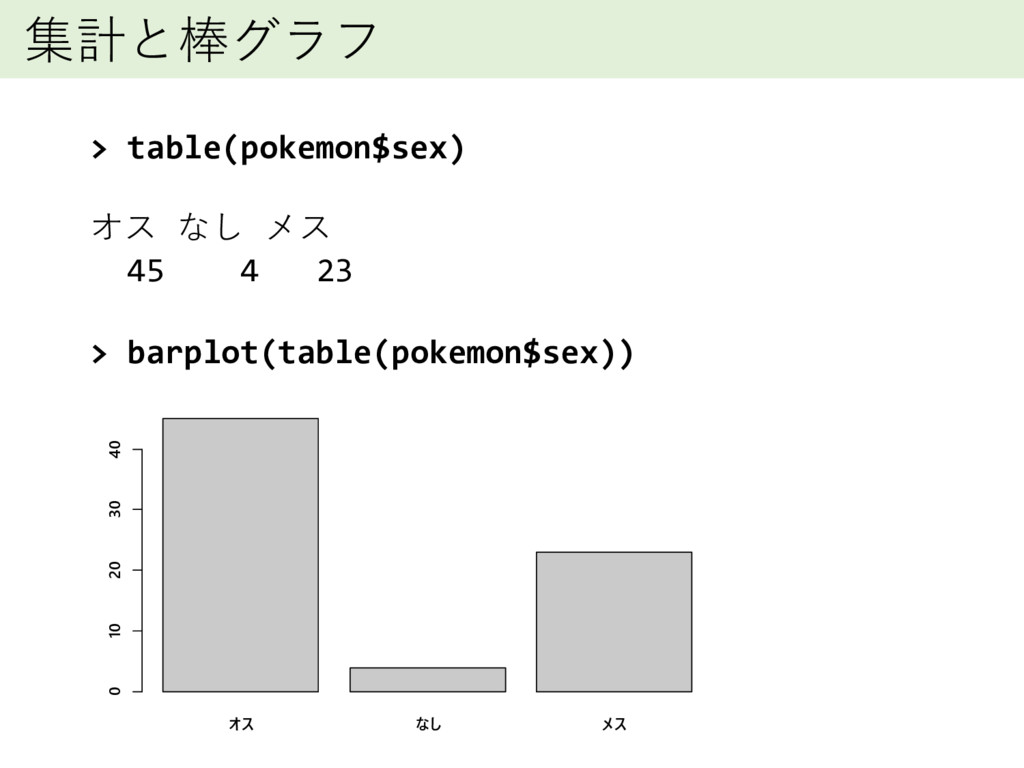
集計と棒グラフ > table(pokemon$sex) オス なし メス 45 4 23 >
barplot(table(pokemon$sex)) オス なし メス 0 10 20 30 40
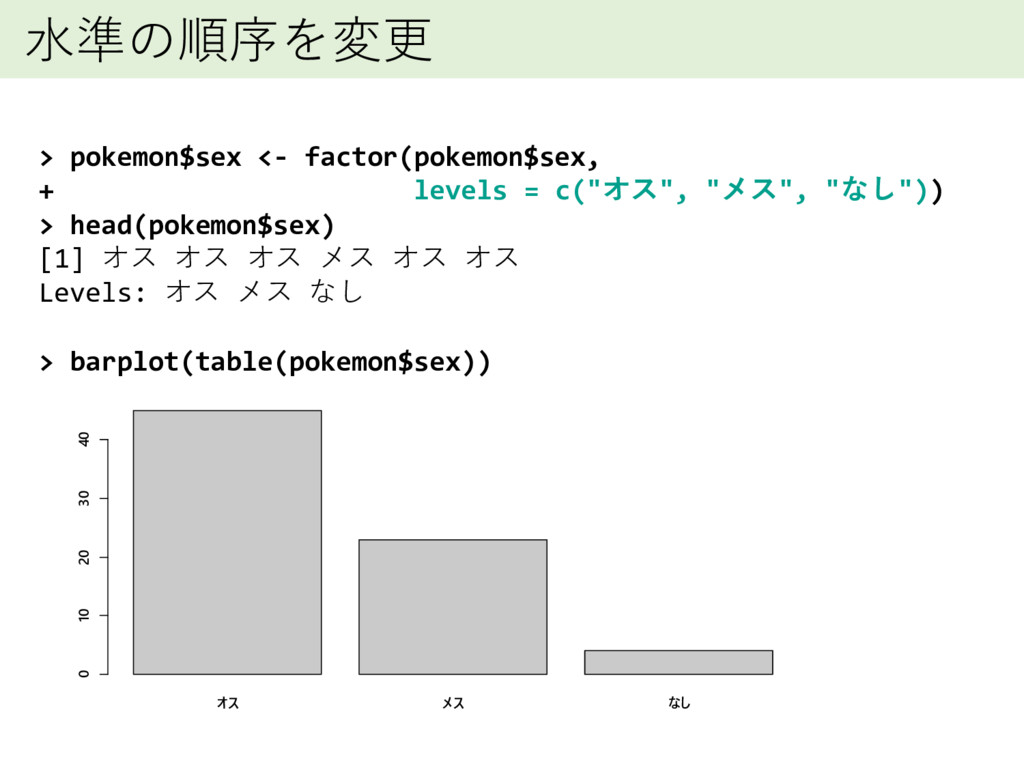
水準の順序を変更 > pokemon$sex <- factor(pokemon$sex, + levels = c("オス", "メス",
"なし")) > head(pokemon$sex) [1] オス オス オス メス オス オス Levels: オス メス なし > barplot(table(pokemon$sex)) オス メス なし 0 10 20 30 40
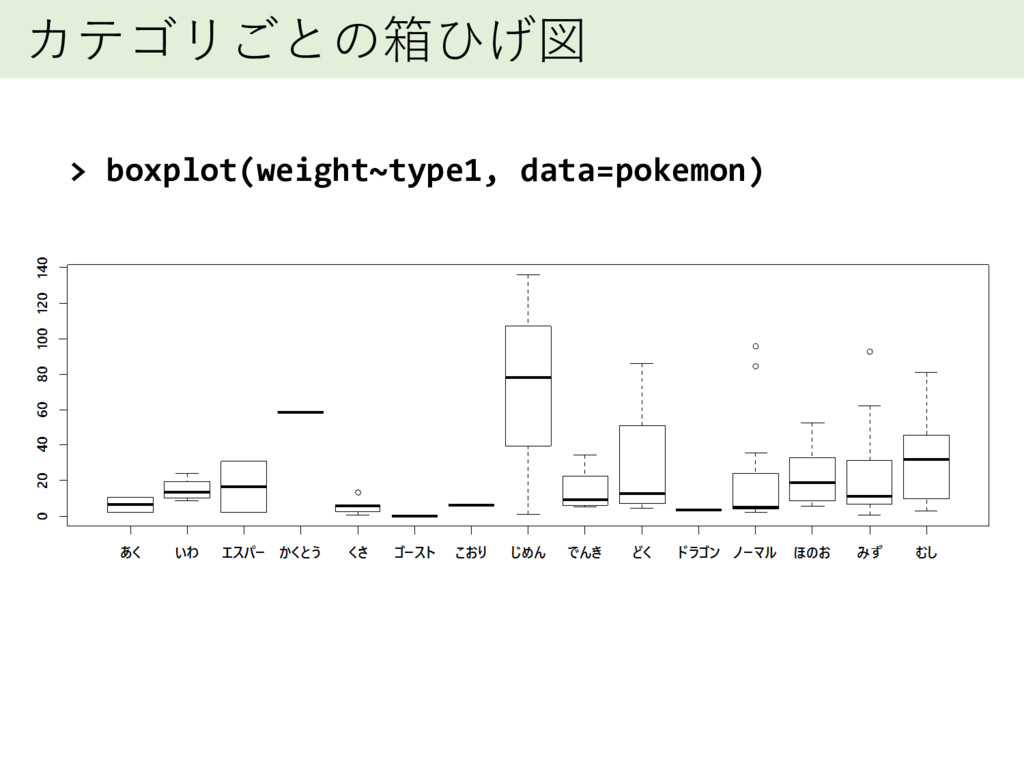
カテゴリごとの箱ひげ図 > boxplot(weight~type1, data=pokemon)
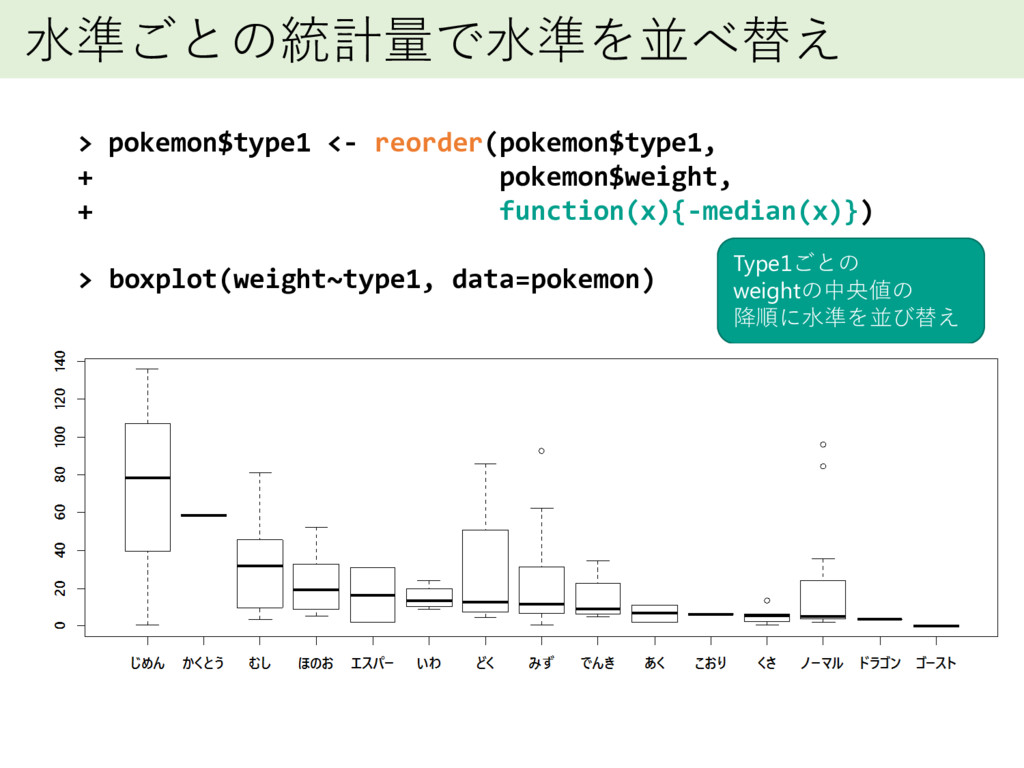
水準ごとの統計量で水準を並べ替え > pokemon$type1 <- reorder(pokemon$type1, + pokemon$weight, + function(x){-median(x)}) >
boxplot(weight~type1, data=pokemon) Type1ごとの weightの中央値の 降順に水準を並び替え
因子型の扱い 結構めんどくさい
そこで
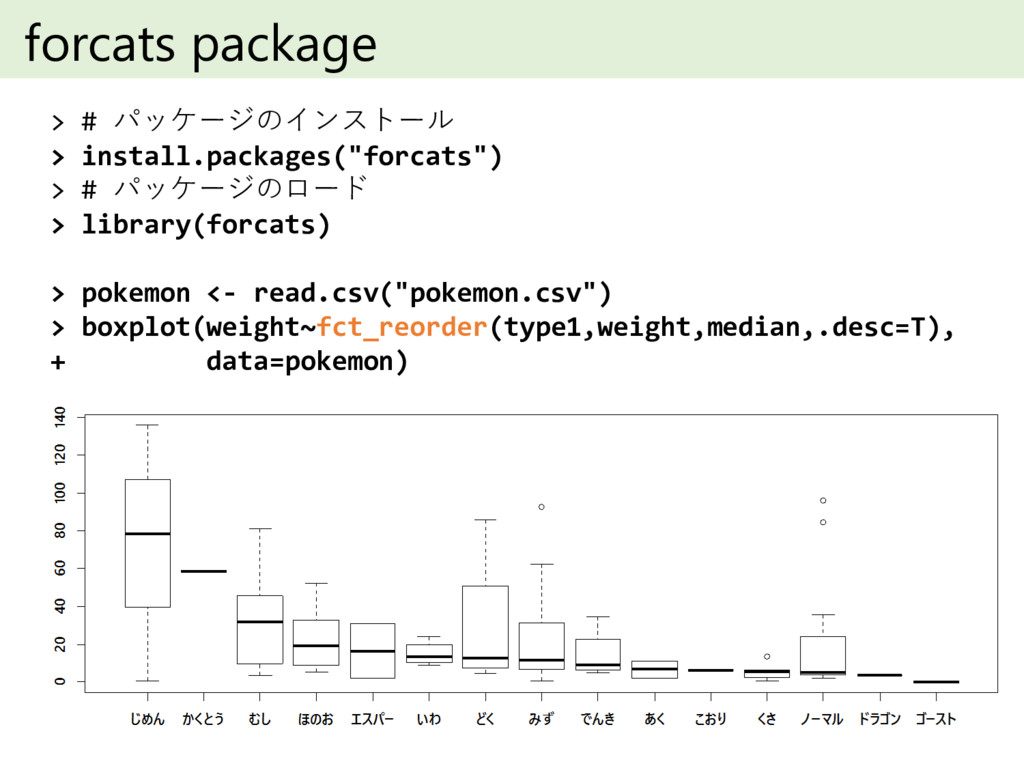
forcats package > # パッケージのインストール > install.packages("forcats") > # パッケージのロード
> library(forcats) > pokemon <- read.csv("pokemon.csv") > boxplot(weight~fct_reorder(type1,weight,median,.desc=T), + data=pokemon)
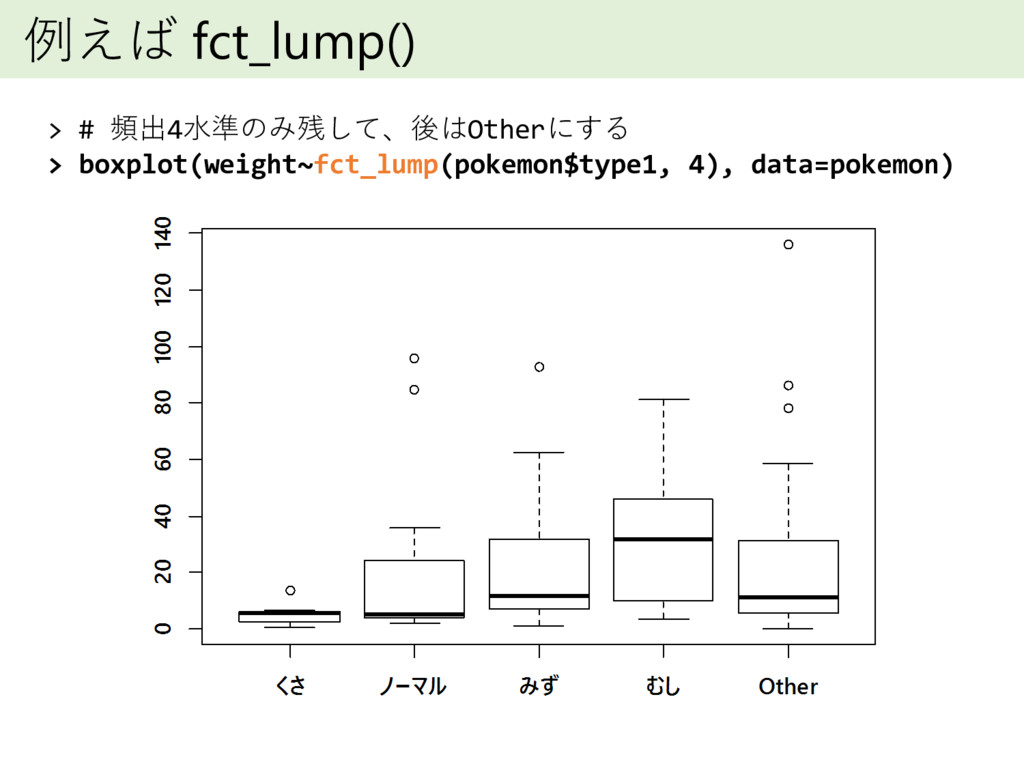
例えば fct_lump() > # 頻出4水準のみ残して、後はOtherにする > boxplot(weight~fct_lump(pokemon$type1, 4), data=pokemon)
詳細は forcats kazutan
enjoy!
![とりあえず文字型 > bloodtype <- c("B","A","A","A","AB", + "B","AB","A","A","A","C") > bloodtype [1]](https://files.speakerdeck.com/presentations/df4a93152243436ab64bcb70de759c10/slide_5.jpg)
![データフレーム > pokemon <- read.csv("pokemon.csv") > head(pokemon$type1) [1] くさ みず](https://files.speakerdeck.com/presentations/df4a93152243436ab64bcb70de759c10/slide_8.jpg)