Upgrade to Pro — share decks privately, control downloads, hide ads and more …

Cartographic design for mobile devices: A case study using the UW-Madison interactive campus map

Cartographic design for mobile devices: A case study using the UW-Madison interactive campus map

Brian Davidson
University of Wisconsin-Madison

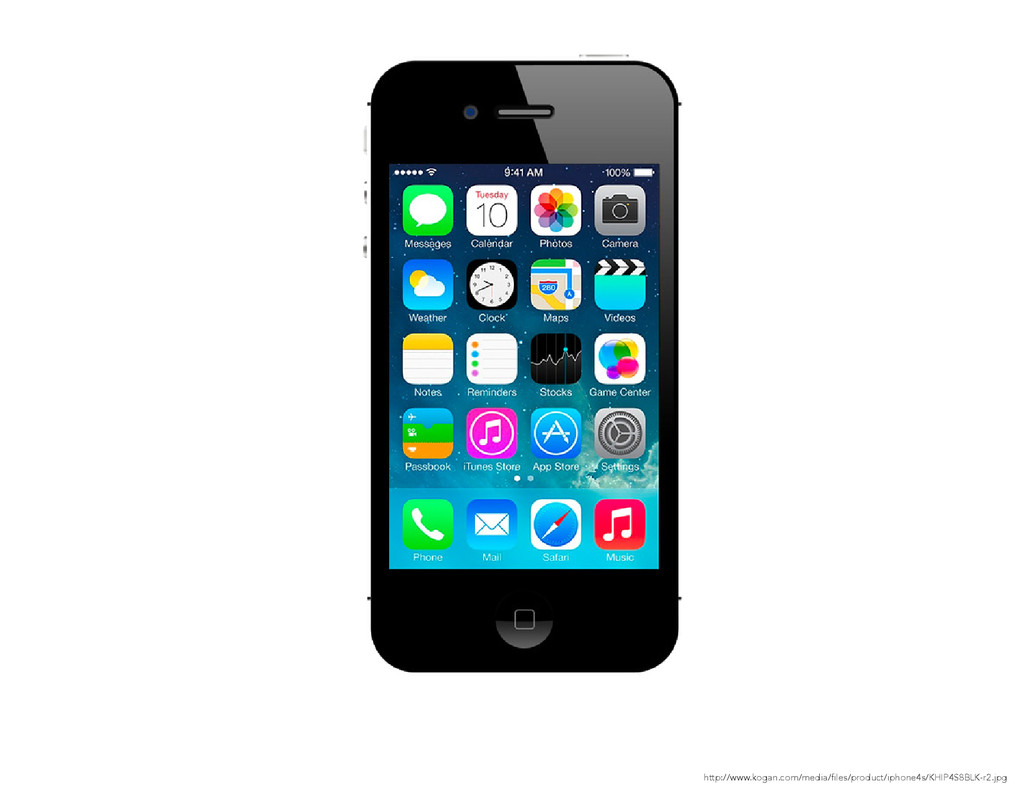
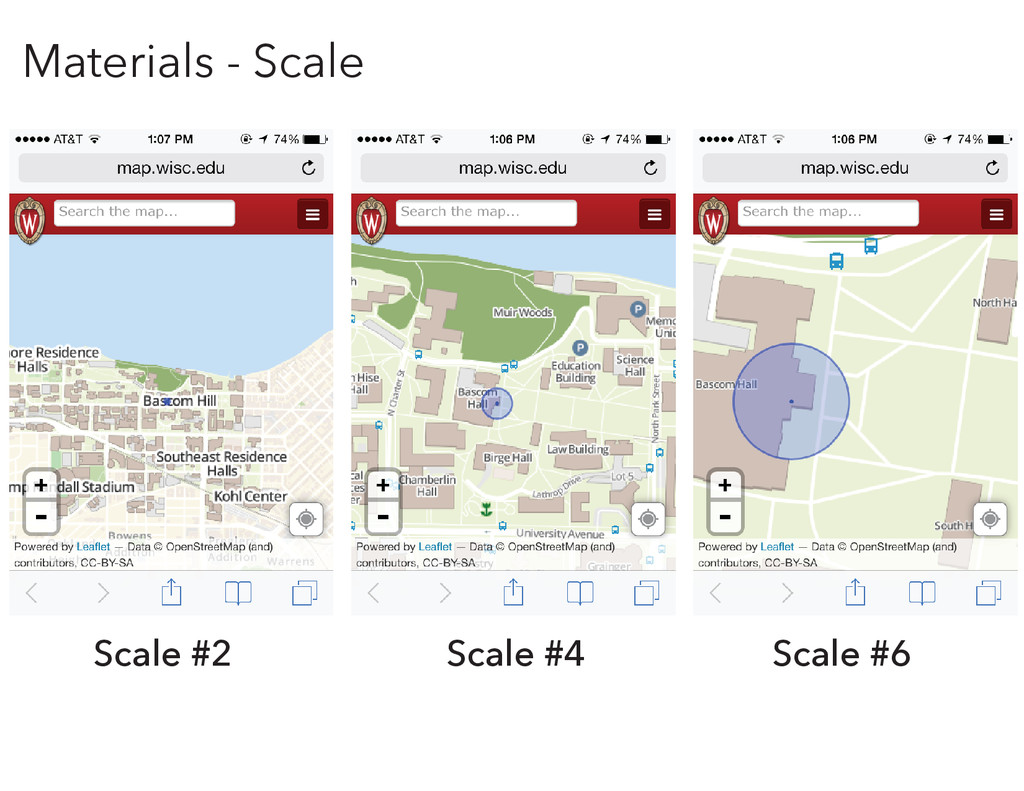
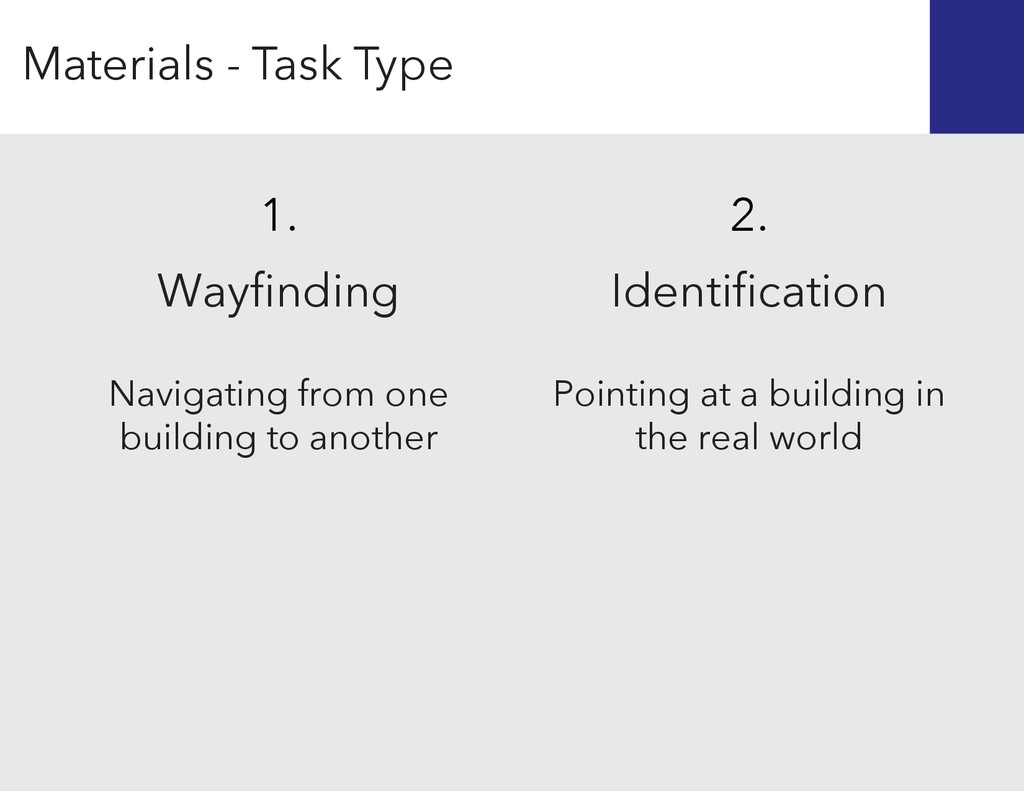
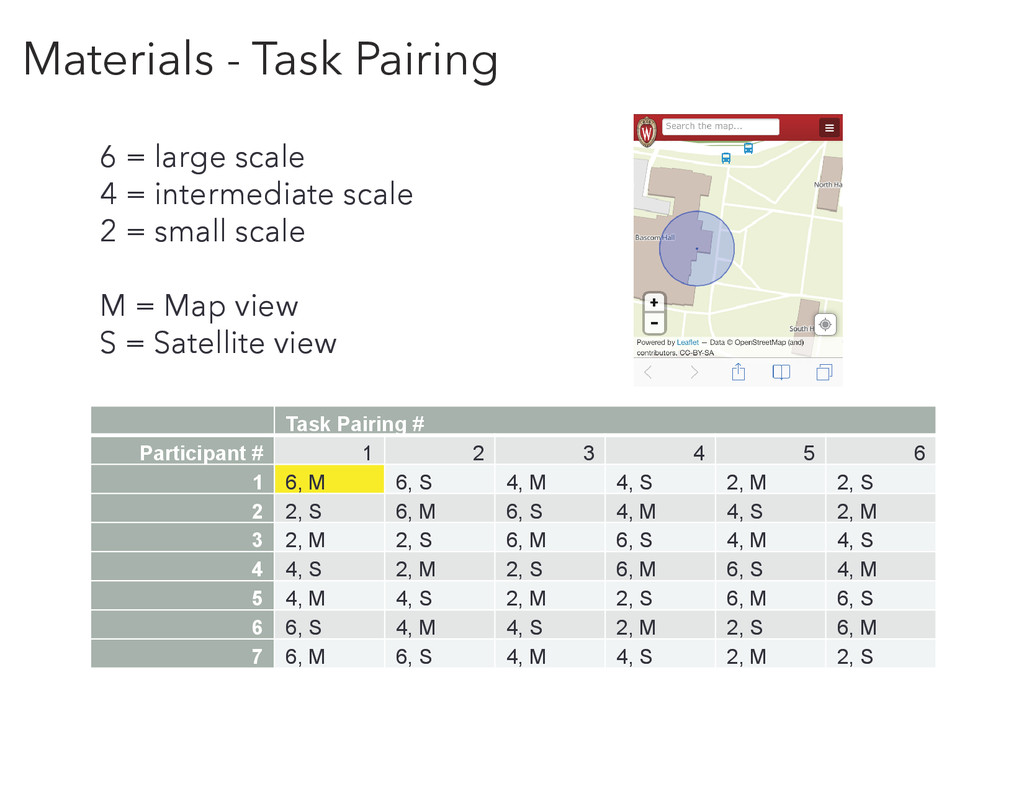
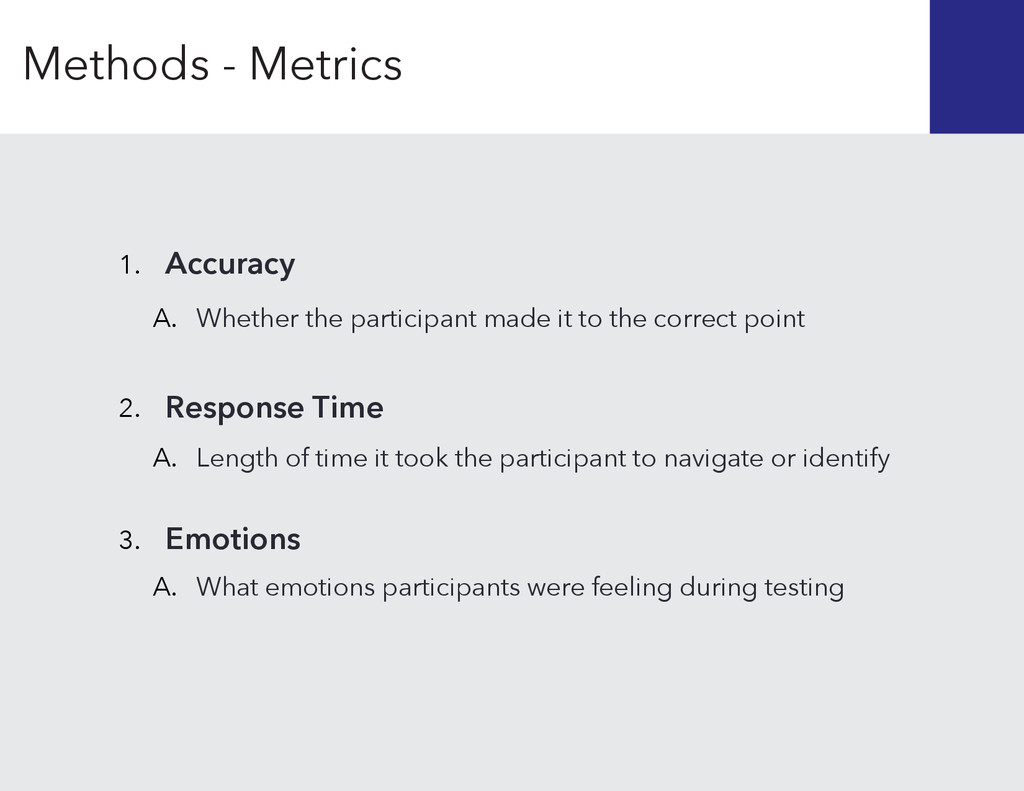
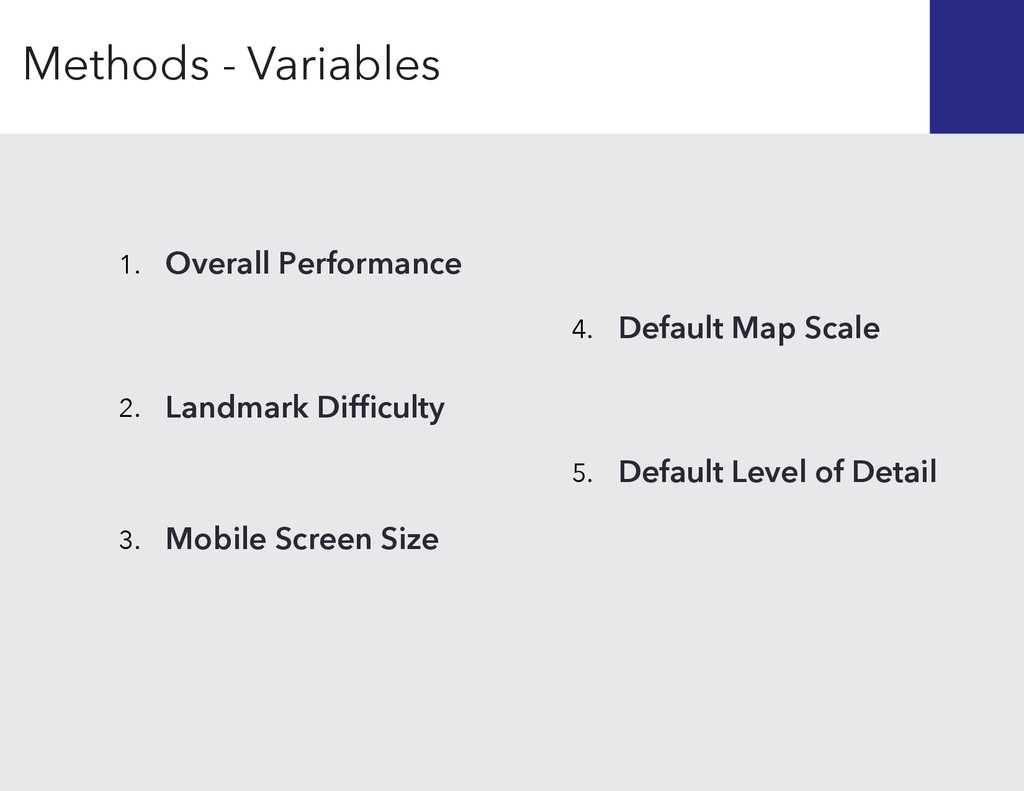
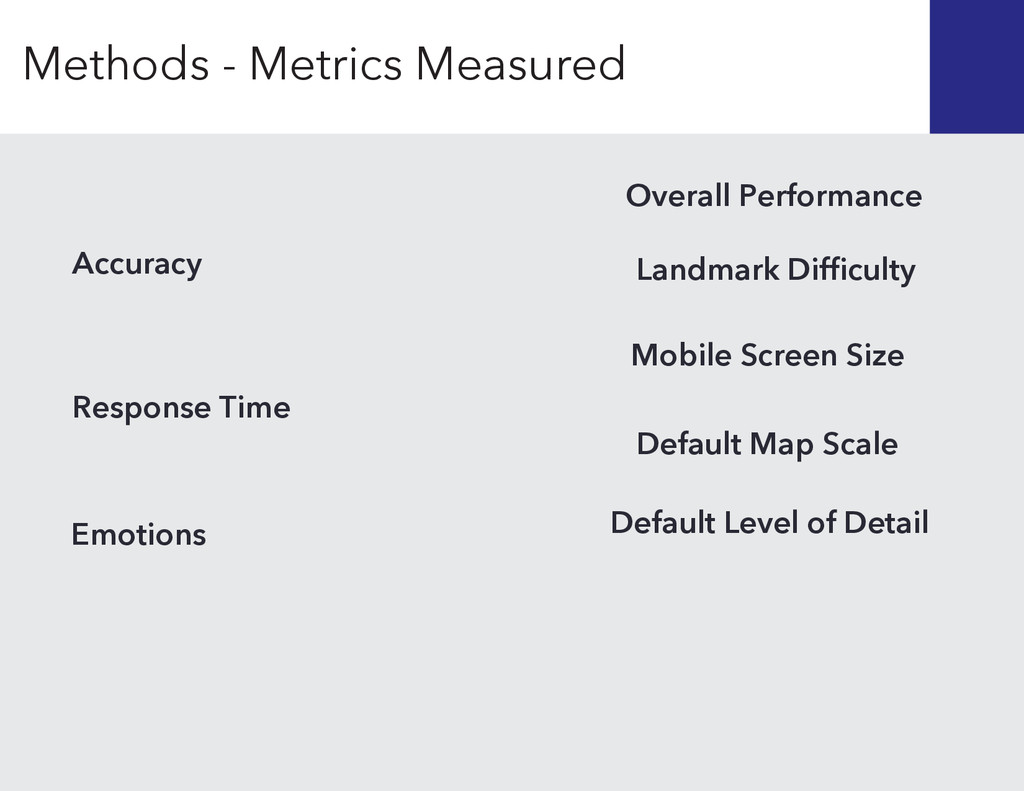
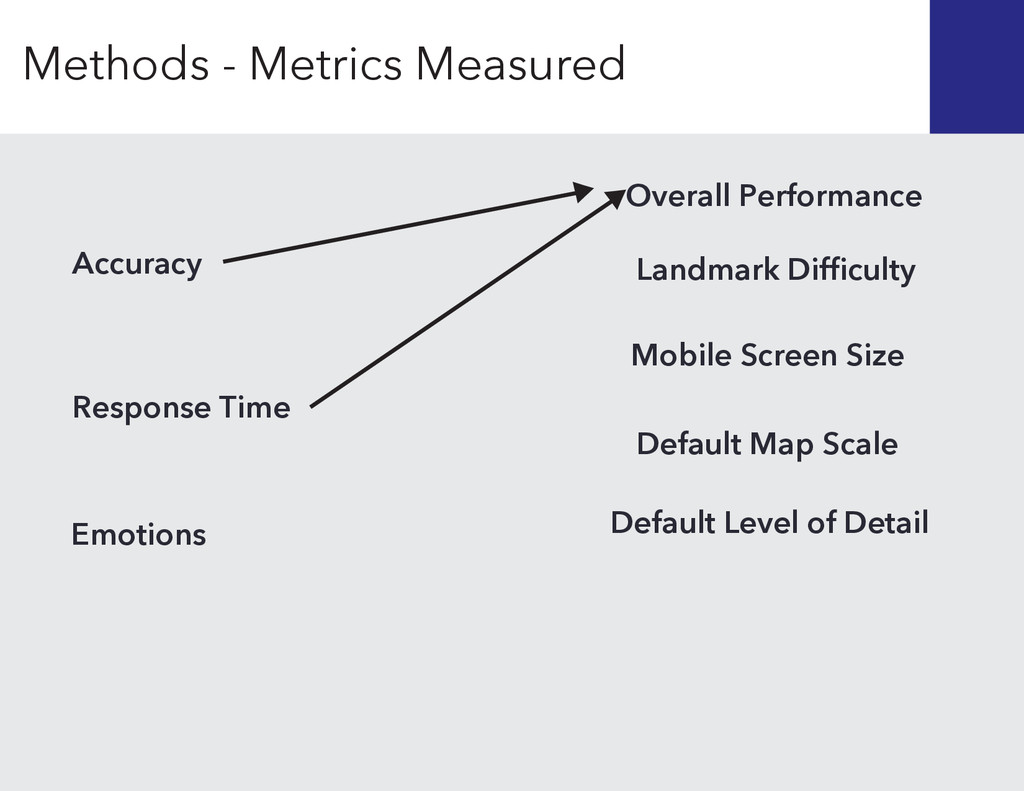
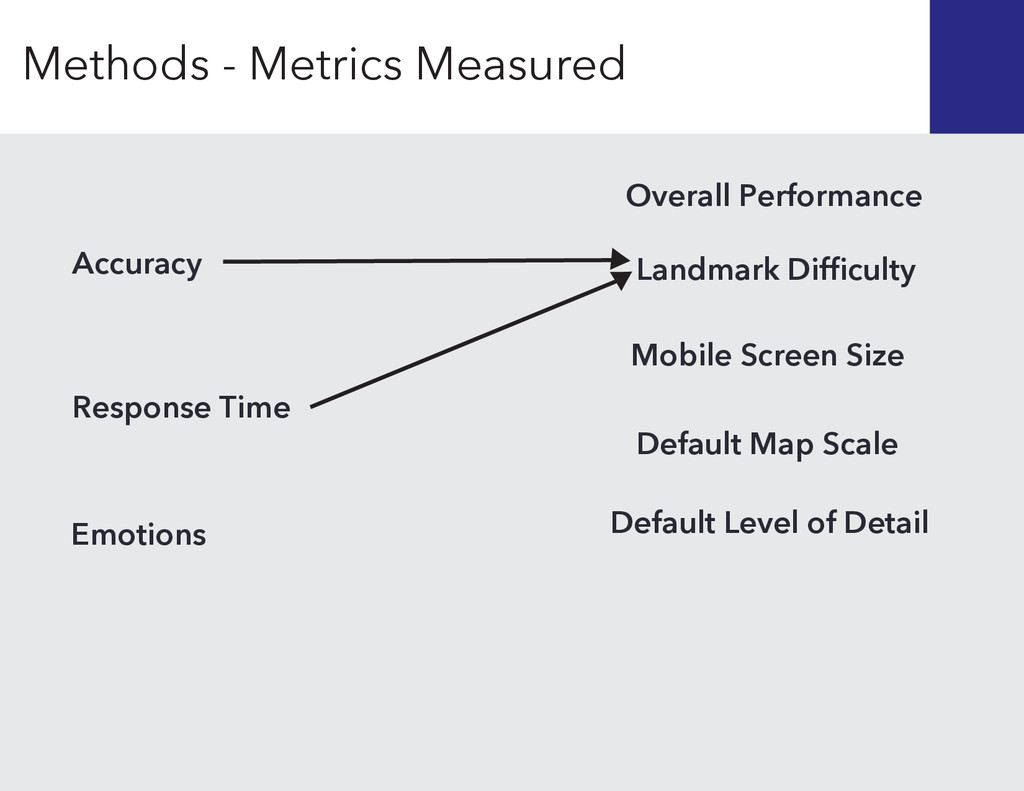
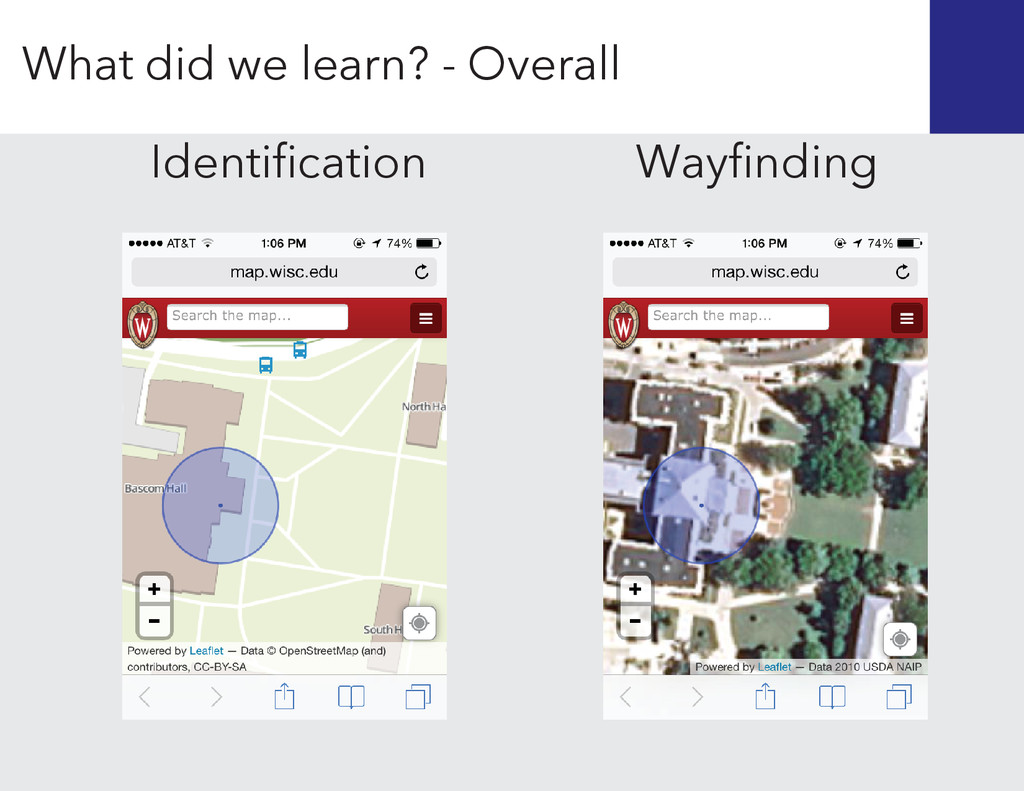
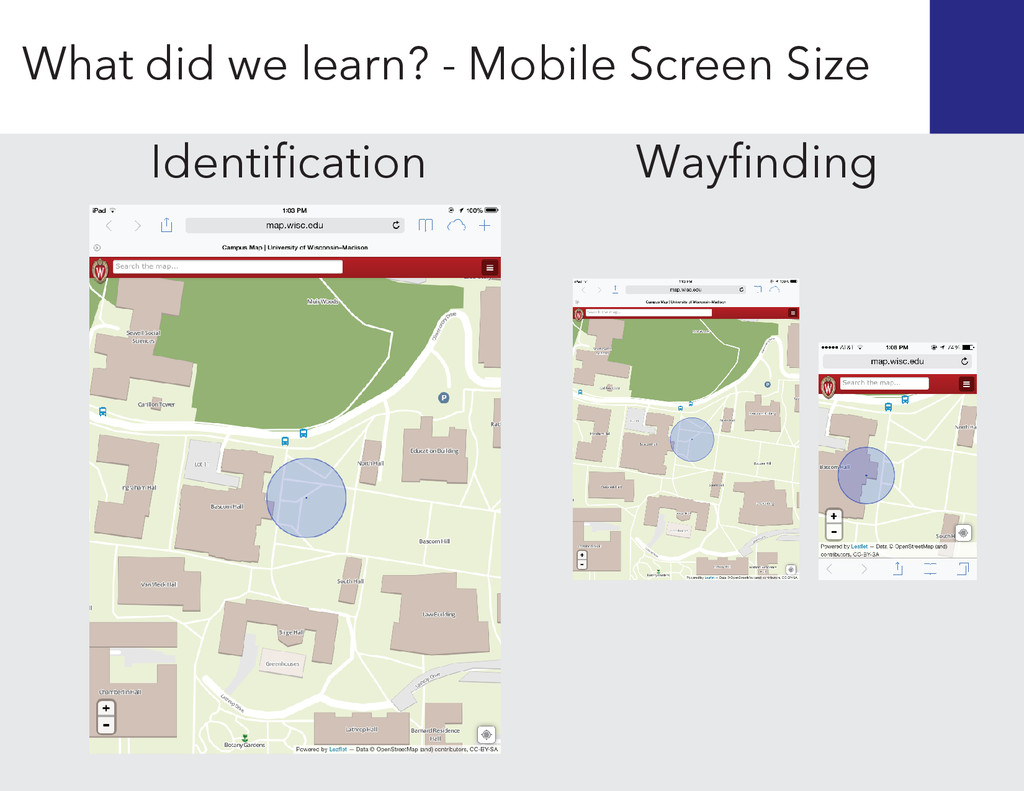
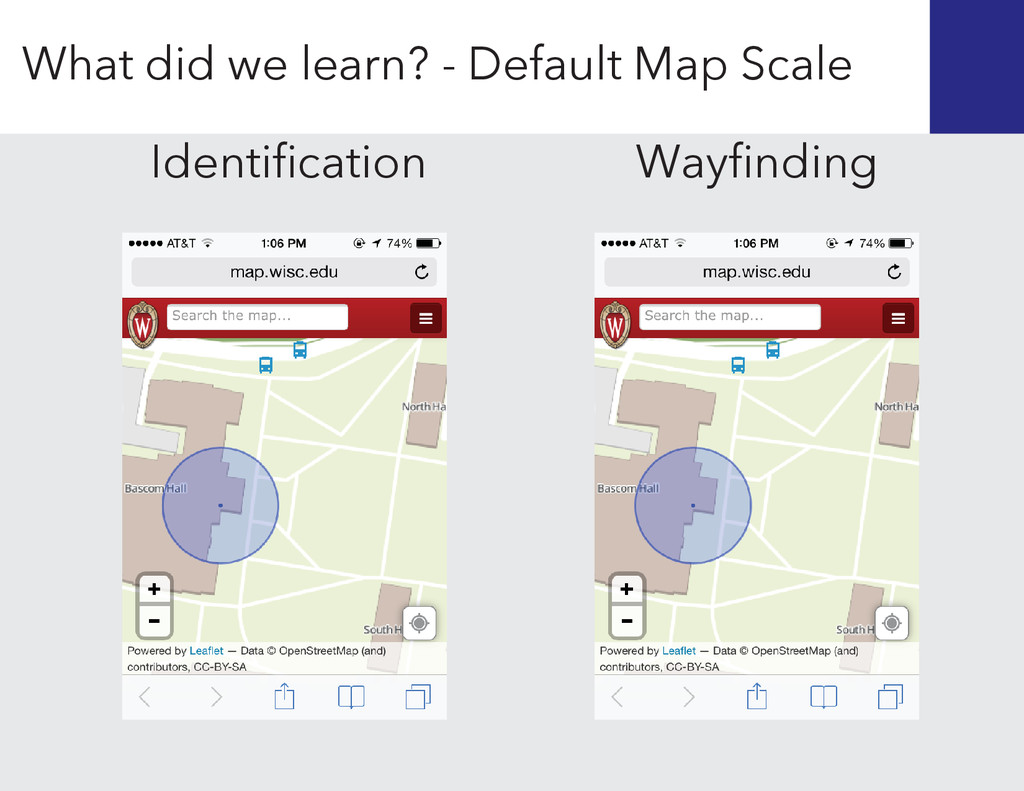
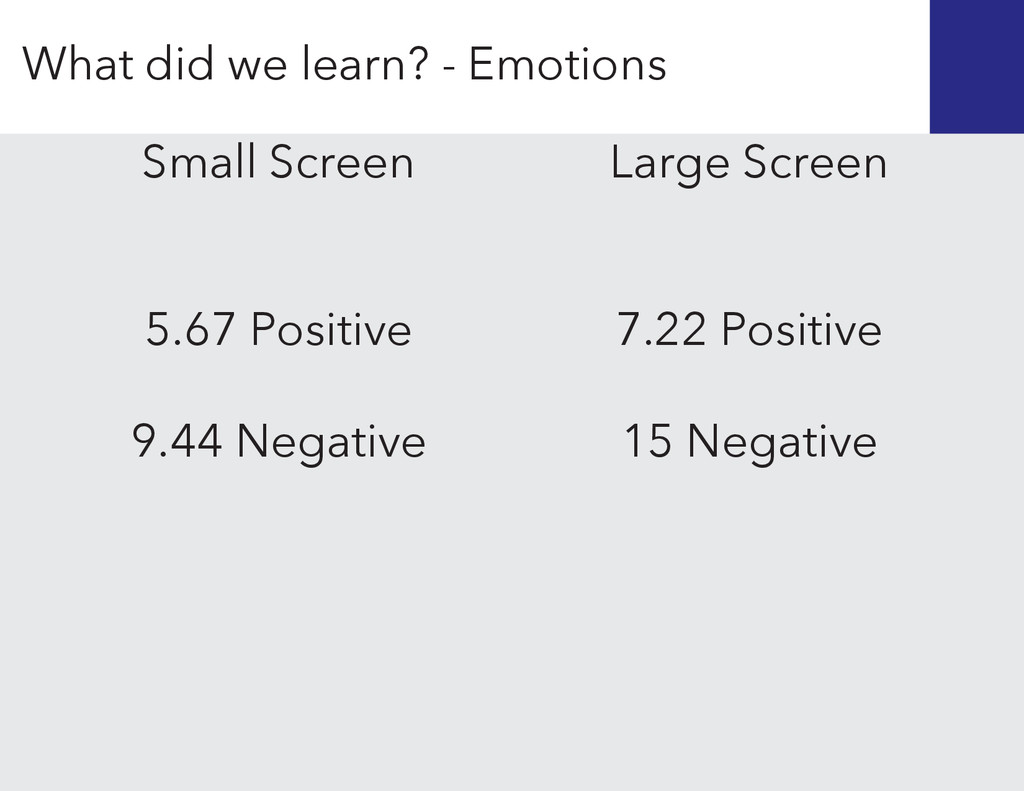
Smartphones have become an integral part of the daily lives of citizens not only in the United States, but also around the world. It is estimated that by 2016, 80% of the United States population will be using a mobile phone and 50% will be using a tablet. This study investigates the default map scale and level of detail appropriate when designing for mobile maps using the University of Wisconsin-Madison interactive campus map as a case study. Participants were asked to complete wayfinding and identification tasks and were measured based on accuracy, response time, and emotion. Overall, the goal is to provide design considerations for mobile cartography and help open the possibilities for future research in the field of mobile.

Nathaniel V. KELSO

October 10, 2014
Tweet

More Decks by Nathaniel V. KELSO

Other Decks in Design

Transcript

  1. Cartographic Design for Mobile Devices: A Case Study Using the

    UW-Madison Interactive Campus Map Brian Davidson University of Wisconsin–Madison
  2. 1. Should the default map scale of a web map

    differ between mobile device screen sizes? 2. 3. Research Questions
  3. Should the level of detail of a web map differ

    between mobile device screen sizes? 1. Should the default map scale of a web map differ between mobile device screen sizes? 2. 3. Research Questions
  4. Should the level of detail of a web map differ

    between mobile device screen sizes? Are there differences in emotional experiences between mobile device screen sizes? 1. Should the default map scale of a web map differ between mobile device screen sizes? 2. 3. Research Questions
  5. Have little to no knowledge of the UW–Madison campus 1.

    2. Must be in their first two semesters of college Two requirements
  6. 1. 2. Wayfinding Navigating from one building to another Identification

    Pointing at a building in the real world Materials - Task Type
  7. Task Pairing # Participant # 1 2 3 4 5

    6 1 6, M 6, S 4, M 4, S 2, M 2, S 2 2, S 6, M 6, S 4, M 4, S 2, M 3 2, M 2, S 6, M 6, S 4, M 4, S 4 4, S 2, M 2, S 6, M 6, S 4, M 5 4, M 4, S 2, M 2, S 6, M 6, S 6 6, S 4, M 4, S 2, M 2, S 6, M 7 6, M 6, S 4, M 4, S 2, M 2, S 6 = large scale 4 = intermediate scale 2 = small scale M = Map view S = Satellite view Materials - Task Pairing
  8. Task Pairing # Participant # 1 2 3 4 5

    6 1 6, M 6, S 4, M 4, S 2, M 2, S 2 2, S 6, M 6, S 4, M 4, S 2, M 3 2, M 2, S 6, M 6, S 4, M 4, S 4 4, S 2, M 2, S 6, M 6, S 4, M 5 4, M 4, S 2, M 2, S 6, M 6, S 6 6, S 4, M 4, S 2, M 2, S 6, M 7 6, M 6, S 4, M 4, S 2, M 2, S 6 = large scale 4 = intermediate scale 2 = small scale M = Map view S = Satellite view Materials - Task Pairing
  9. Sign consent form and explain study 1. 2. Meet participants

    at predetermined location Methods - Experimental Protocol
  10. 1. 2. 3. Begin Testing Sign consent form and explain

    study Meet participants at predetermined location Methods - Experimental Protocol
  11. A. Wayfinding task, then Identification 1. 2. 3. Begin Testing

    Sign consent form and explain study Meet participants at predetermined location Methods - Experimental Protocol
  12. Response Time 2. 1. Accuracy A. Whether the participant made

    it to the correct point Methods - Metrics
  13. A. Length of time it took the participant to navigate

    or identify Response Time 2. 1. Accuracy A. Whether the participant made it to the correct point Methods - Metrics
  14. A. Length of time it took the participant to navigate

    or identify Response Time 2. Emotions 3. 1. Accuracy A. Whether the participant made it to the correct point Methods - Metrics
  15. A. Length of time it took the participant to navigate

    or identify Response Time 2. Emotions 3. 1. Accuracy A. Whether the participant made it to the correct point A. What emotions participants were feeling during testing Methods - Metrics
  16. 2. 3. 1. 5. 4. Landmark Difficulty Mobile Screen Size

    Overall Performance Default Level of Detail Default Map Scale Methods - Variables
  17. Response Time Accuracy Landmark Difficulty Mobile Screen Size Overall Performance

    Default Level of Detail Emotions Default Map Scale Methods - Metrics Measured
  18. Response Time Accuracy Landmark Difficulty Mobile Screen Size Overall Performance

    Default Level of Detail Emotions Default Map Scale Methods - Metrics Measured
  19. Response Time Accuracy Landmark Difficulty Mobile Screen Size Overall Performance

    Default Level of Detail Emotions Default Map Scale Methods - Metrics Measured
  20. What did I learn and what else can be studied?

    (Conclusions and Recommendations)
  21. Large Screen 7.22 Positive 15 Negative Small Screen 5.67 Positive

    9.44 Negative What did we learn? - Emotions
  22. • Dr. Robert Roth, Tanya Buckingham, and Dr. Jim Burt

    • Family and Friends • Trewartha Graduate Research Award • 36 anonymous participants Special Thanks