Upgrade to Pro — share decks privately, control downloads, hide ads and more …

Large-scale GPU-Accelerated Data Visualization with MapD

OmniSci
January 30, 2018

Large-scale GPU-Accelerated Data Visualization with MapD

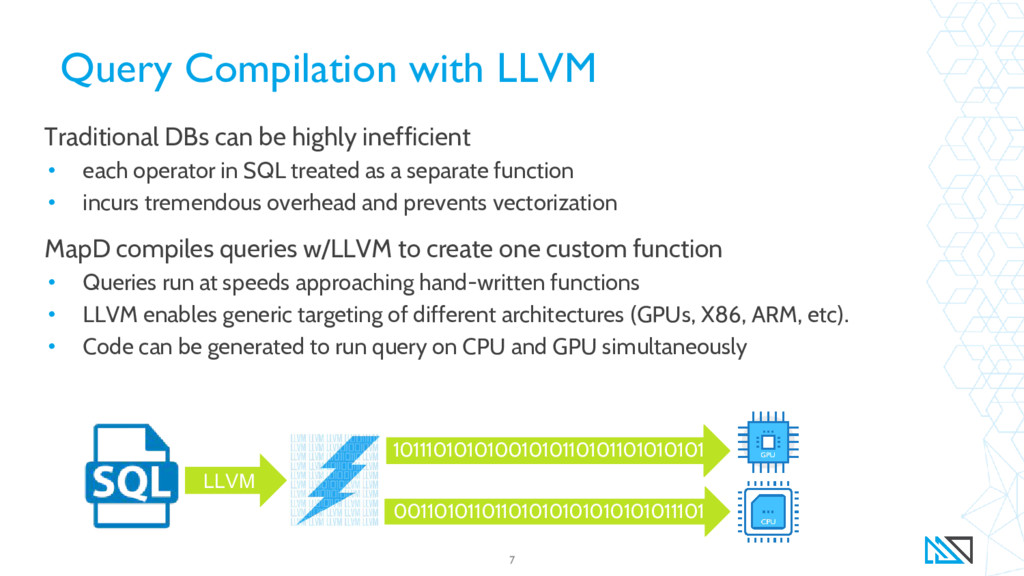
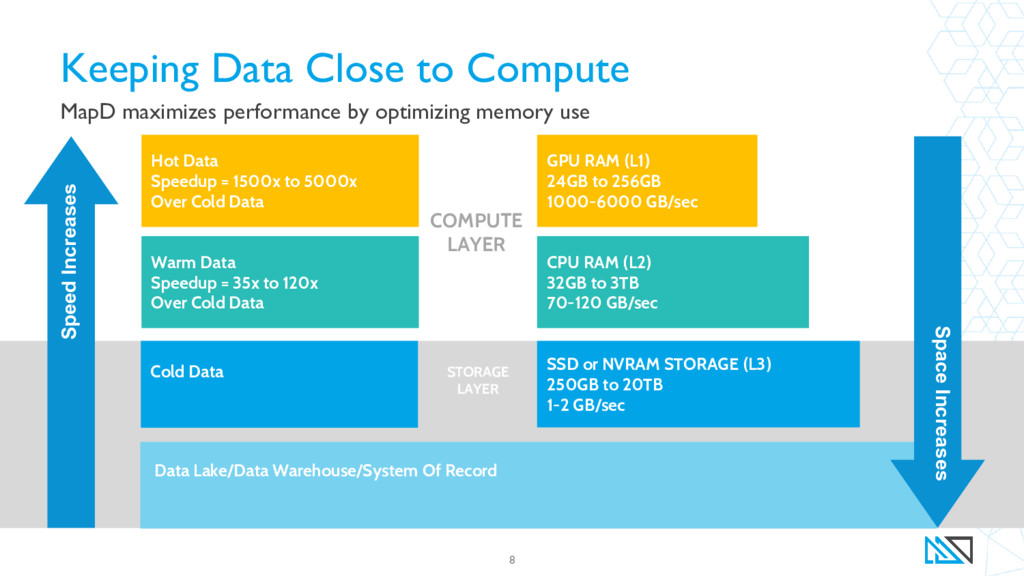
Nearly a decade ago, disk-based data analytics platforms began to be superseded by in-memory systems, which offered orders-of-magnitude more bandwidth than their predecessors. This technological sea change was driven in large part by memory prices falling to the point where it became viable to hold large working sets of data entirely in RAM.
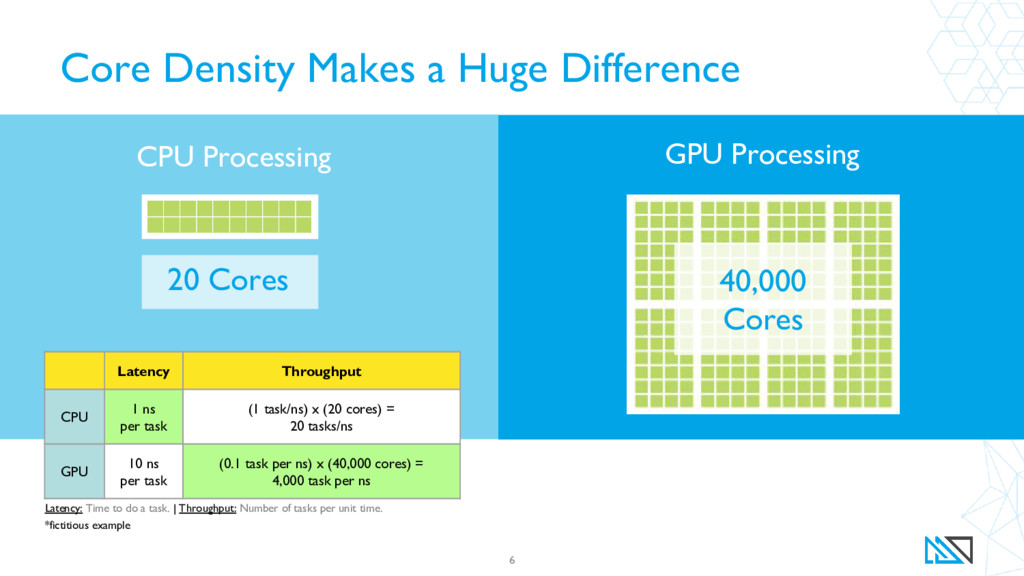
Today we are about to witness a similar paradigm shift as analytics workloads are increasingly shifted from CPUs to GPUs, which possess much higher compute and memory bandwidth than CPUs. Driven by the needs of 4K gaming and deep learning, GPUs are just now beginning to have enough onboard RAM to cache meaningful sized datasets. Today 8 GPUs and 256GB of GPU VRAM can be fit into a single server, and those numbers will likely rise significantly in the near future. And while CPUs have seen relatively minimal memory bandwidth increases over the last several years, GPUs are rapidly moving to stacked DRAM (High-Bandwidth Memory), meaning that by next year a single GPU will possess over a terabyte per second of bandwidth.
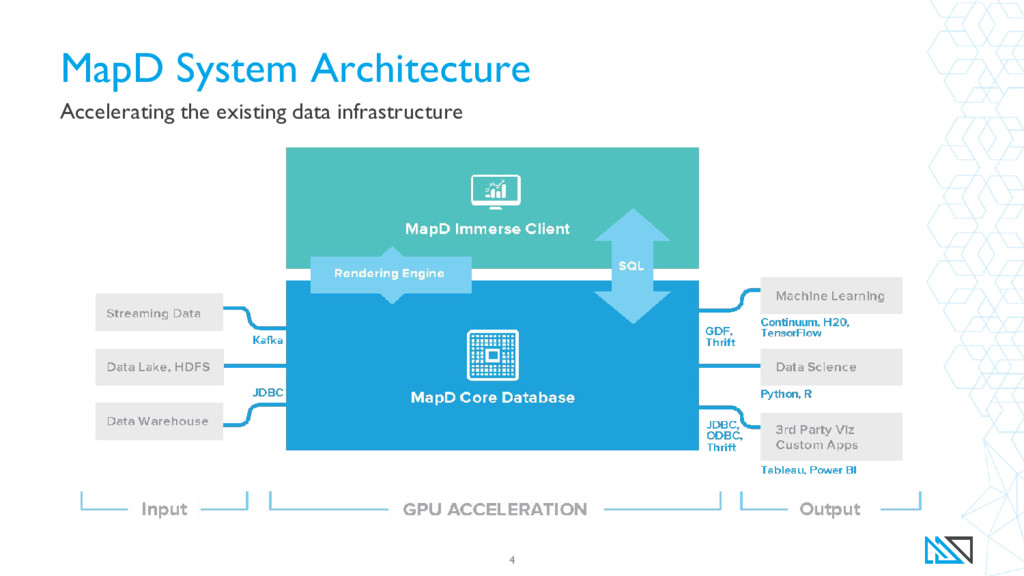
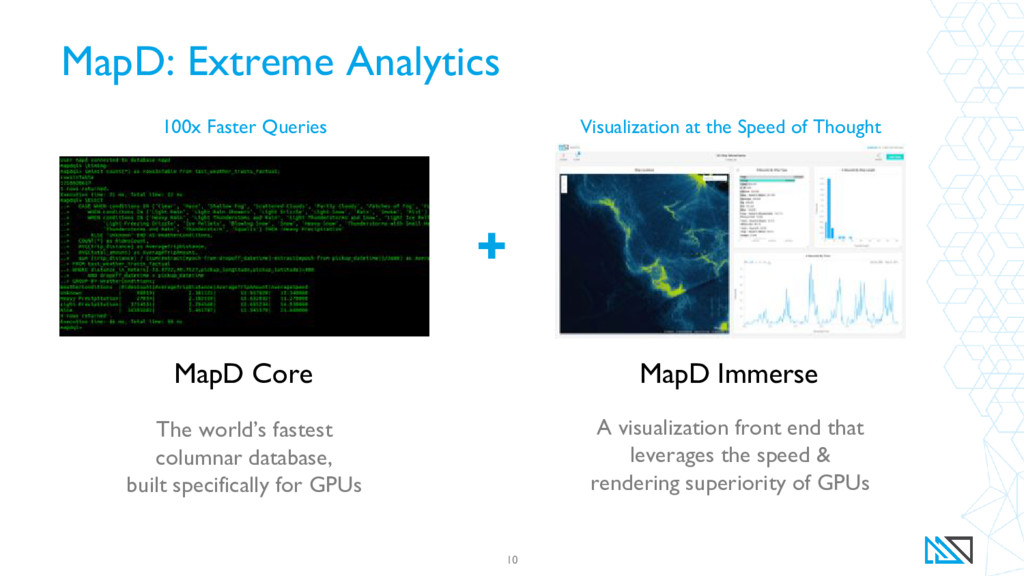
Using the MapD big data analytics platform as an example, Aaron Williams and Christophe Viau will explain why analytics platforms that will be able to leverage GPUs will have an immense advantage over their CPU-bound counterparts. They will show how MapD leverages the massive parallelism and memory bandwidth of multiple GPUs to execute SQL queries and render complex visualizations of billions of rows in data in milliseconds, literally orders of magnitude faster than CPU systems. Finally, they will show why this difference matters, highlighting the potential of GPU-based analytics to allow truly interactive exploration of big datasets.

OmniSci

January 30, 2018
Tweet

More Decks by OmniSci

Other Decks in Technology

Transcript

  1. Aaron Williams VP of Global Community @_arw_ [email protected] /in/aaronwilliams/ /williamsaaron

    Christophe Viau Data Visualization Engineer [email protected] /in/christopheviau/ /biovisualize
  2. “Every business will become a software business, build applications, use

    advanced analytics and provide Saas services.” - Smart CEO Guy has
  3. Core Density Makes a Huge Difference 6 GPU Processing CPU

    Processing 40,000 Cores 20 Cores *fictitious example Latency Throughput CPU 1 ns per task (1 task/ns) x (20 cores) = 20 tasks/ns GPU 10 ns per task (0.1 task per ns) x (40,000 cores) = 4,000 task per ns Latency: Time to do a task. | Throughput: Number of tasks per unit time.
  4. Query Compilation with LLVM 7 Traditional DBs can be highly

    inefficient • each operator in SQL treated as a separate function • incurs tremendous overhead and prevents vectorization MapD compiles queries w/LLVM to create one custom function • Queries run at speeds approaching hand-written functions • LLVM enables generic targeting of different architectures (GPUs, X86, ARM, etc). • Code can be generated to run query on CPU and GPU simultaneously 10111010101001010110101101010101 00110101101101010101010101011101 LLVM
  5. Keeping Data Close to Compute MapD maximizes performance by optimizing

    memory use 8 SSD or NVRAM STORAGE (L3) 250GB to 20TB 1-2 GB/sec CPU RAM (L2) 32GB to 3TB 70-120 GB/sec GPU RAM (L1) 24GB to 256GB 1000-6000 GB/sec Hot Data Speedup = 1500x to 5000x Over Cold Data Warm Data Speedup = 35x to 120x Over Cold Data Cold Data COMPUTE LAYER STORAGE LAYER Data Lake/Data Warehouse/System Of Record Speed Increases Space Increases
  6. MapD: Extreme Analytics 10 100x Faster Queries MapD Core The

    world’s fastest columnar database, built specifically for GPUs + Visualization at the Speed of Thought MapD Immerse A visualization front end that leverages the speed & rendering superiority of GPUs
  7. MapD Immerse Using a hybrid approach to speed and scale

    visualization 11 Basic charts are frontend rendered using D3 and other related toolkits Scatterplots, pointmaps + polygons are backend rendered using the Iris Rendering Engine on GPUs Geo-Viz is composited over a frontend rendered basemap
  8. Built for an open-source ecosystem 12 Extending multiple APIs •

    Dc.js (docs): Mapd-charting (docs) • Crossfilter: Mapd-crossfilter • Vega (editor): Mapd Raster • GPU DB Connector (docs) Part of an ecosystem • Related projects like Deck.gl • Building blocks like Mapbox, which uses Leaflet • Using smaller building blocks, like D3.js
  9. Try MapD It’s free and it’s easy 13 Play with

    the live demos: https://www.mapd.com/demos/ Try the Test Drive: https://mapd.io/testdrive-enterprise Install the Community Edition: https://www.mapd.com/platform/download-community/ Join our forums: https://community.mapd.com/ Review these slides: https://speakerdeck.com/mapd
  10. AWS Credits Available 14 Free GPU Compute! We’re looking for

    interesting use cases. Email Aaron Williams ([email protected]) with your ideas!
  11. Aaron Williams VP of Global Community @_arw_ [email protected] /in/aaronwilliams/ /williamsaaron

    Christophe Viau Data Visualization Engineer [email protected] /in/christopheviau/ /biovisualize