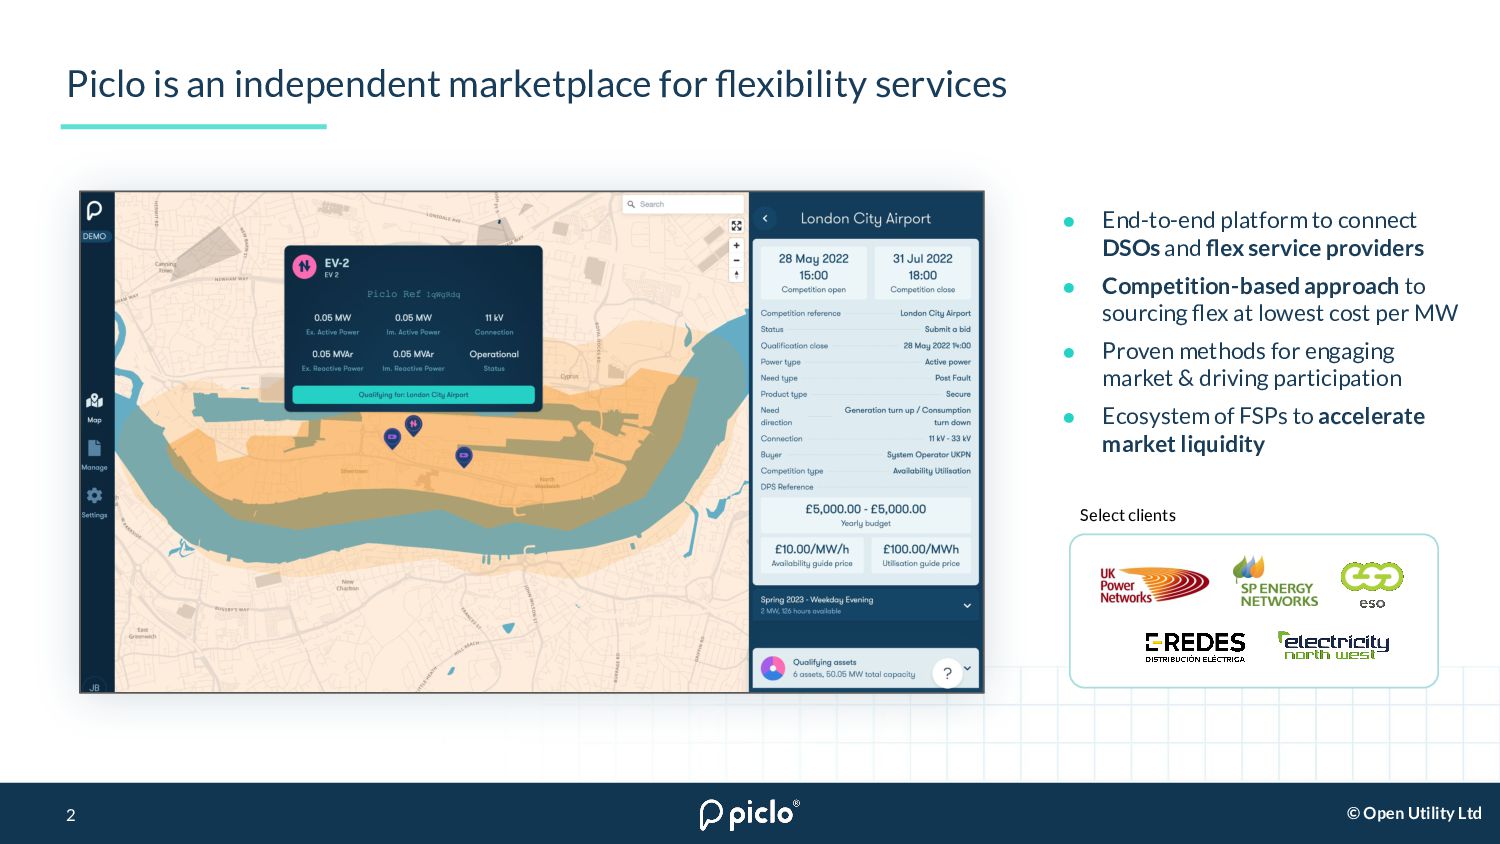
DSOs and flex service providers • Competition-based approach to sourcing flex at lowest cost per MW • Proven methods for engaging market & driving participation • Ecosystem of FSPs to accelerate market liquidity Piclo is an independent marketplace for flexibility services Select clients 2
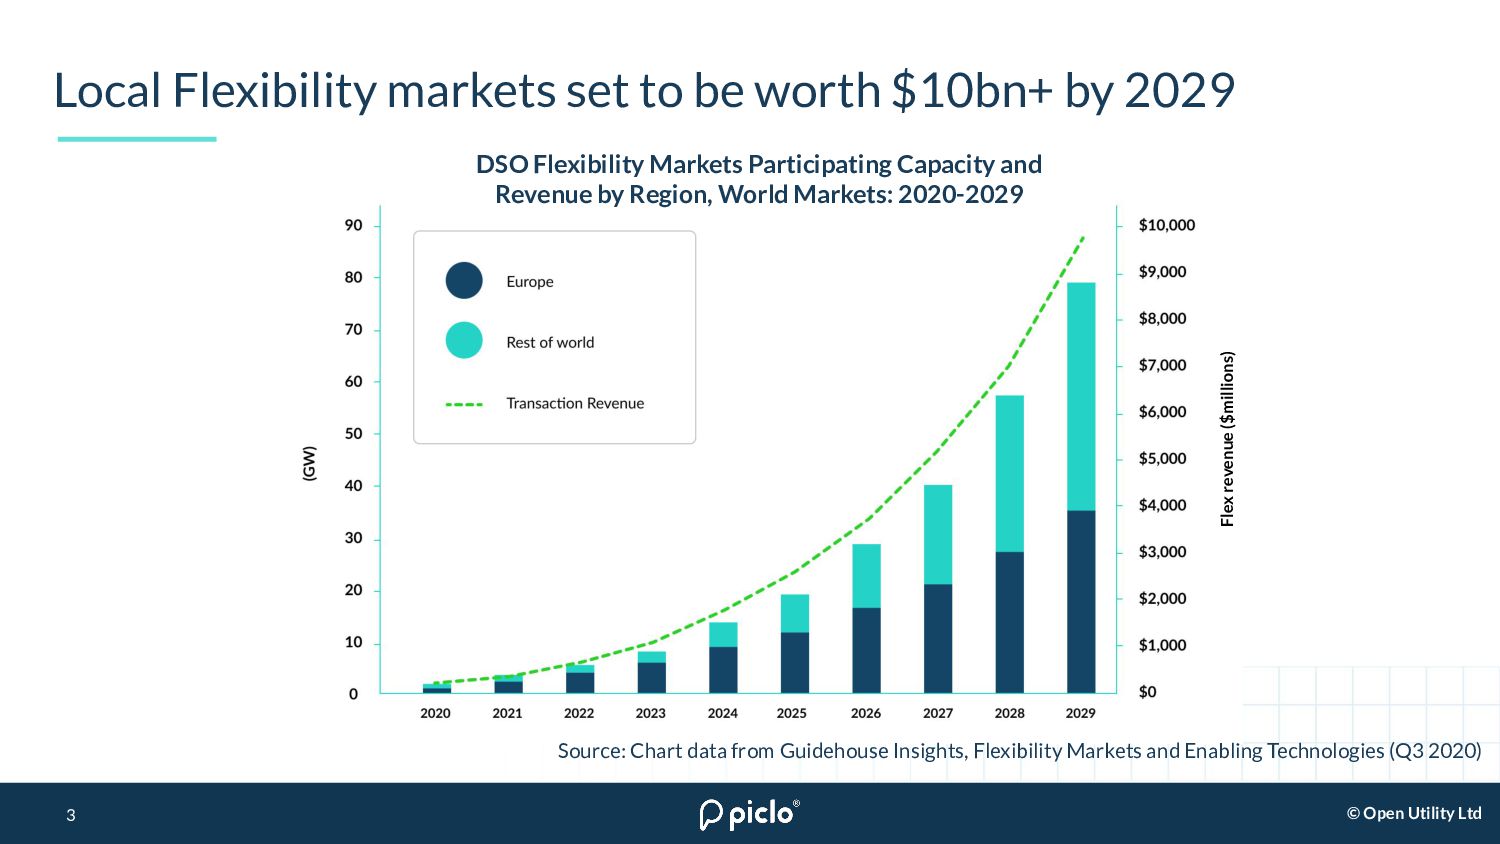
be worth $10bn+ by 2029 3 DSO Flexibility Markets Participating Capacity and Revenue by Region, World Markets: 2020-2029 Source: Chart data from Guidehouse Insights, Flexibility Markets and Enabling Technologies (Q3 2020) Flex revenue ($millions)
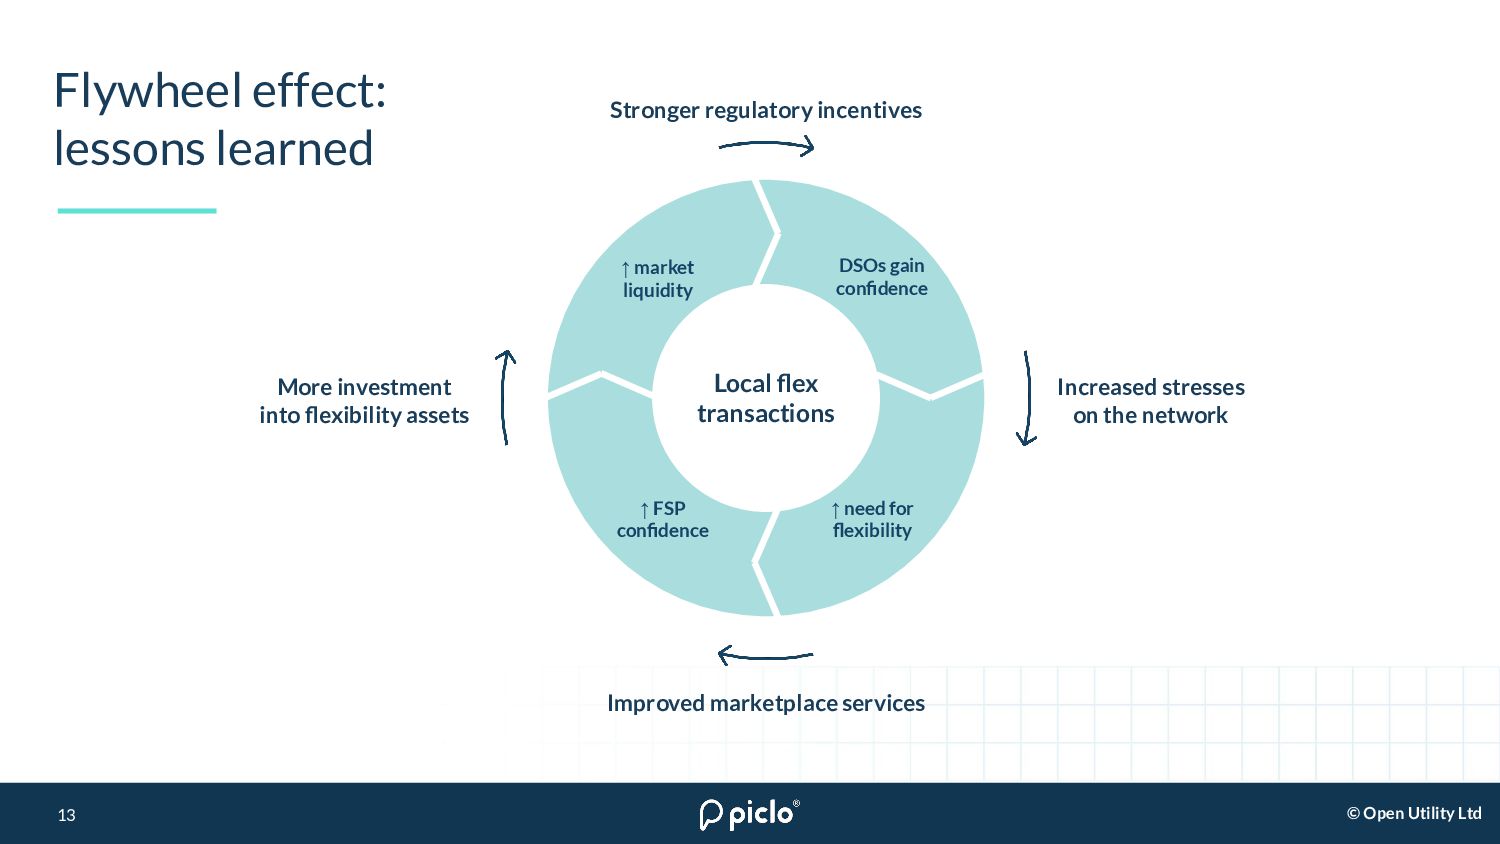
DSOs gain confidence ↑ need for flexibility ↑ FSP confidence ↑ market liquidity Increased stresses on the network Local flex transactions Stronger regulatory incentives More investment into flexibility assets Improved marketplace services
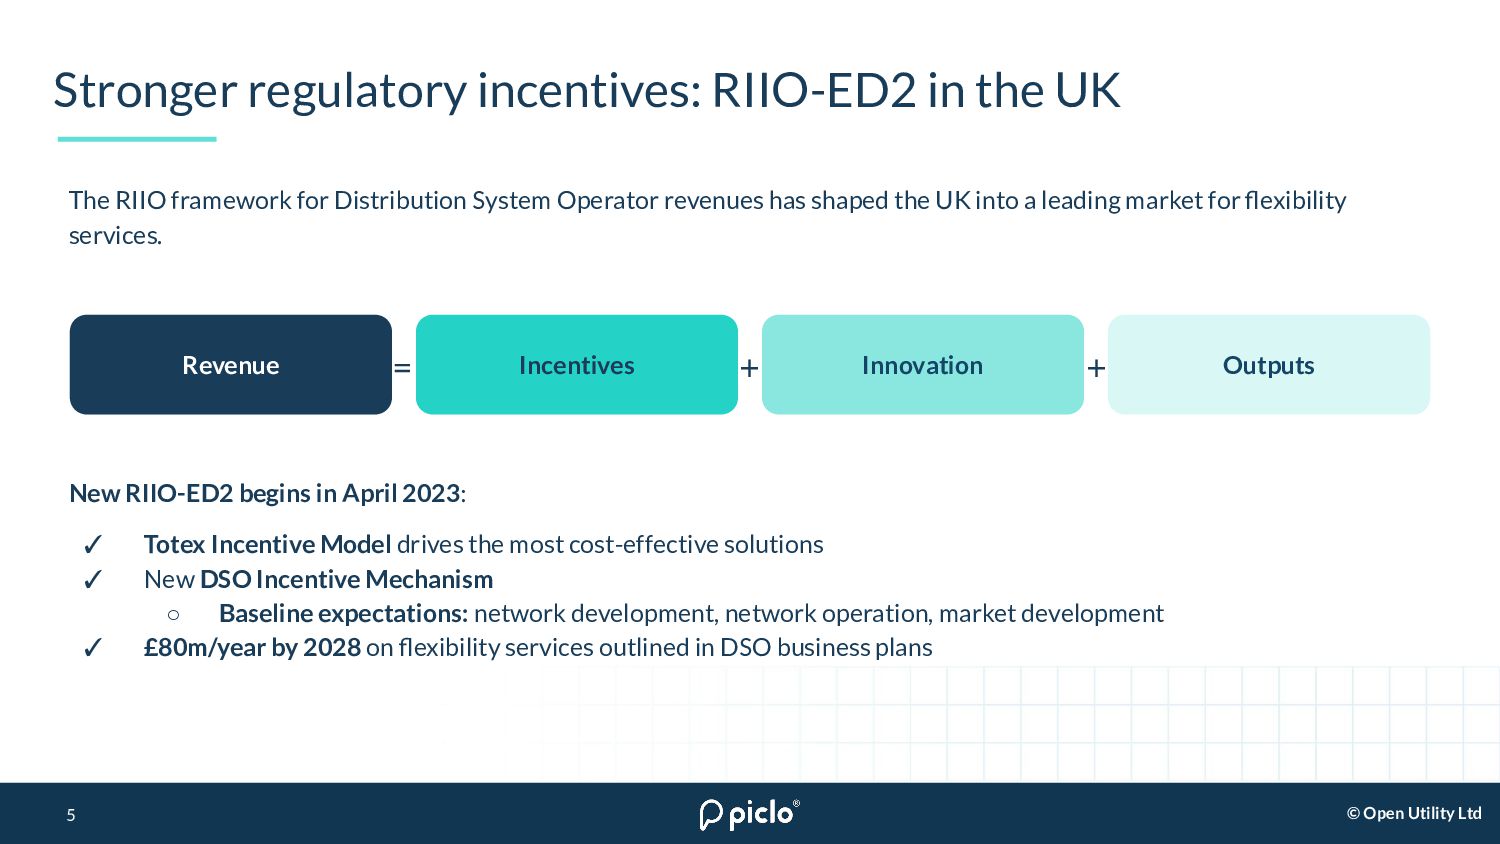
the UK 5 The RIIO framework for Distribution System Operator revenues has shaped the UK into a leading market for flexibility services. New RIIO-ED2 begins in April 2023: ✓ Totex Incentive Model drives the most cost-effective solutions ✓ New DSO Incentive Mechanism ◦ Baseline expectations: network development, network operation, market development ✓ £80m/year by 2028 on flexibility services outlined in DSO business plans Incentives Revenue Innovation Outputs + + =
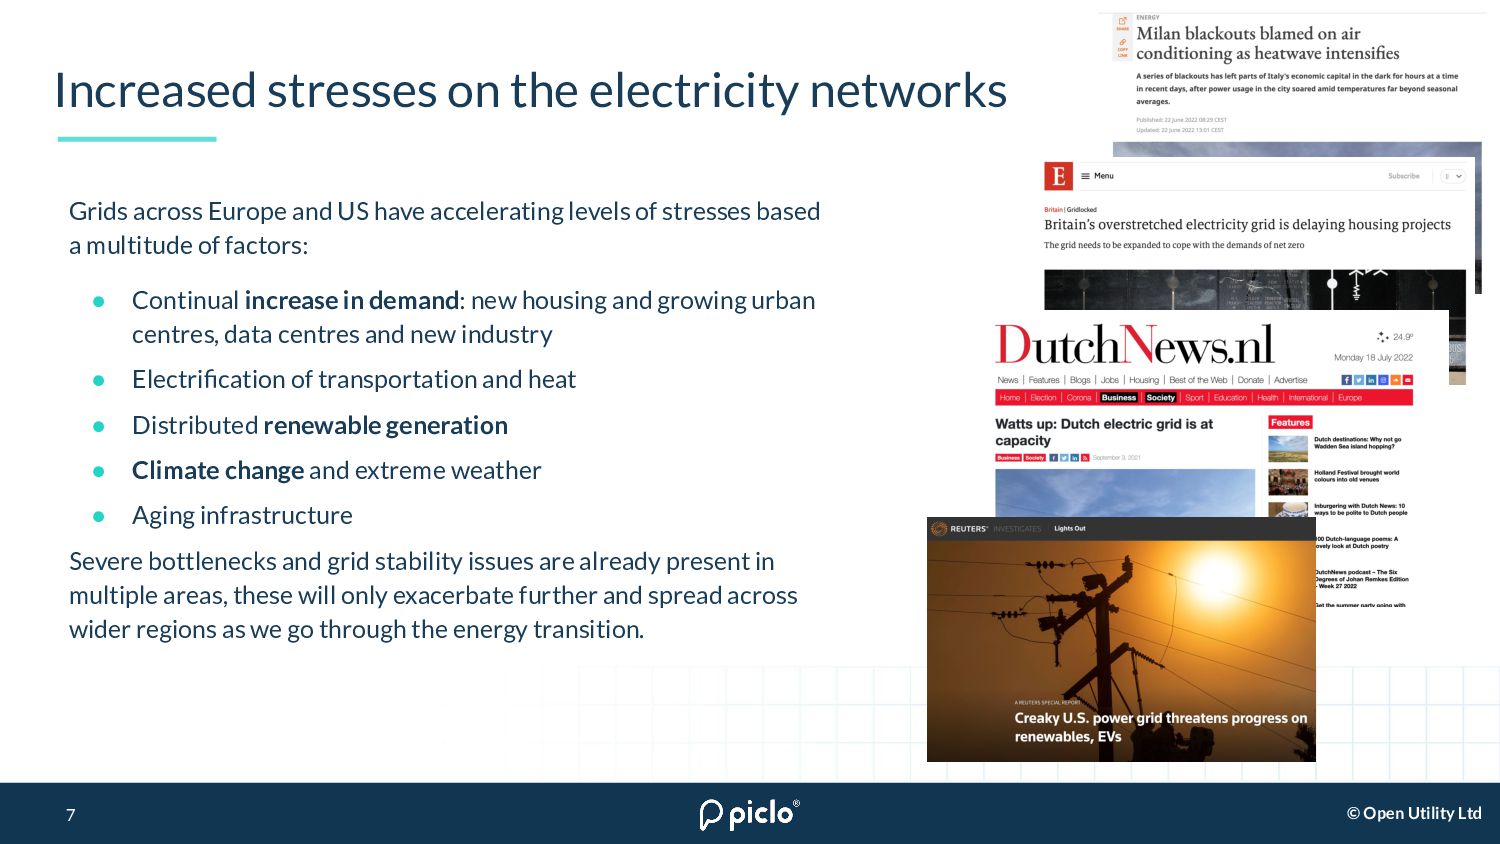
US have accelerating levels of stresses based a multitude of factors: • Continual increase in demand: new housing and growing urban centres, data centres and new industry • Electrification of transportation and heat • Distributed renewable generation • Climate change and extreme weather • Aging infrastructure Severe bottlenecks and grid stability issues are already present in multiple areas, these will only exacerbate further and spread across wider regions as we go through the energy transition. Increased stresses on the electricity networks
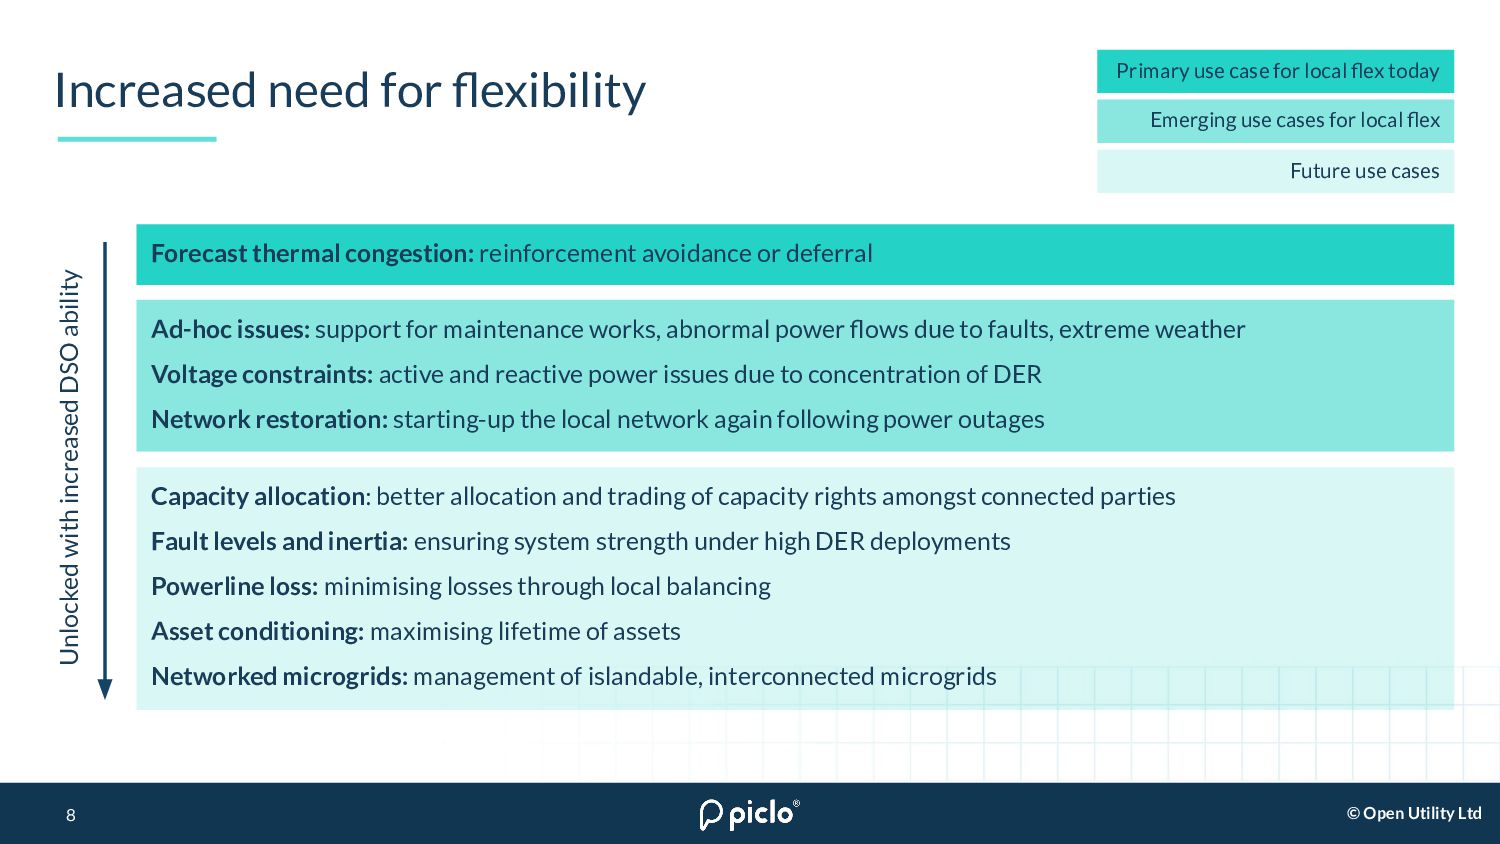
works, abnormal power flows due to faults, extreme weather Voltage constraints: active and reactive power issues due to concentration of DER Network restoration: starting-up the local network again following power outages Increased need for flexibility 8 Forecast thermal congestion: reinforcement avoidance or deferral Unlocked with increased DSO ability Primary use case for local flex today Capacity allocation: better allocation and trading of capacity rights amongst connected parties Fault levels and inertia: ensuring system strength under high DER deployments Powerline loss: minimising losses through local balancing Asset conditioning: maximising lifetime of assets Networked microgrids: management of islandable, interconnected microgrids Future use cases Emerging use cases for local flex
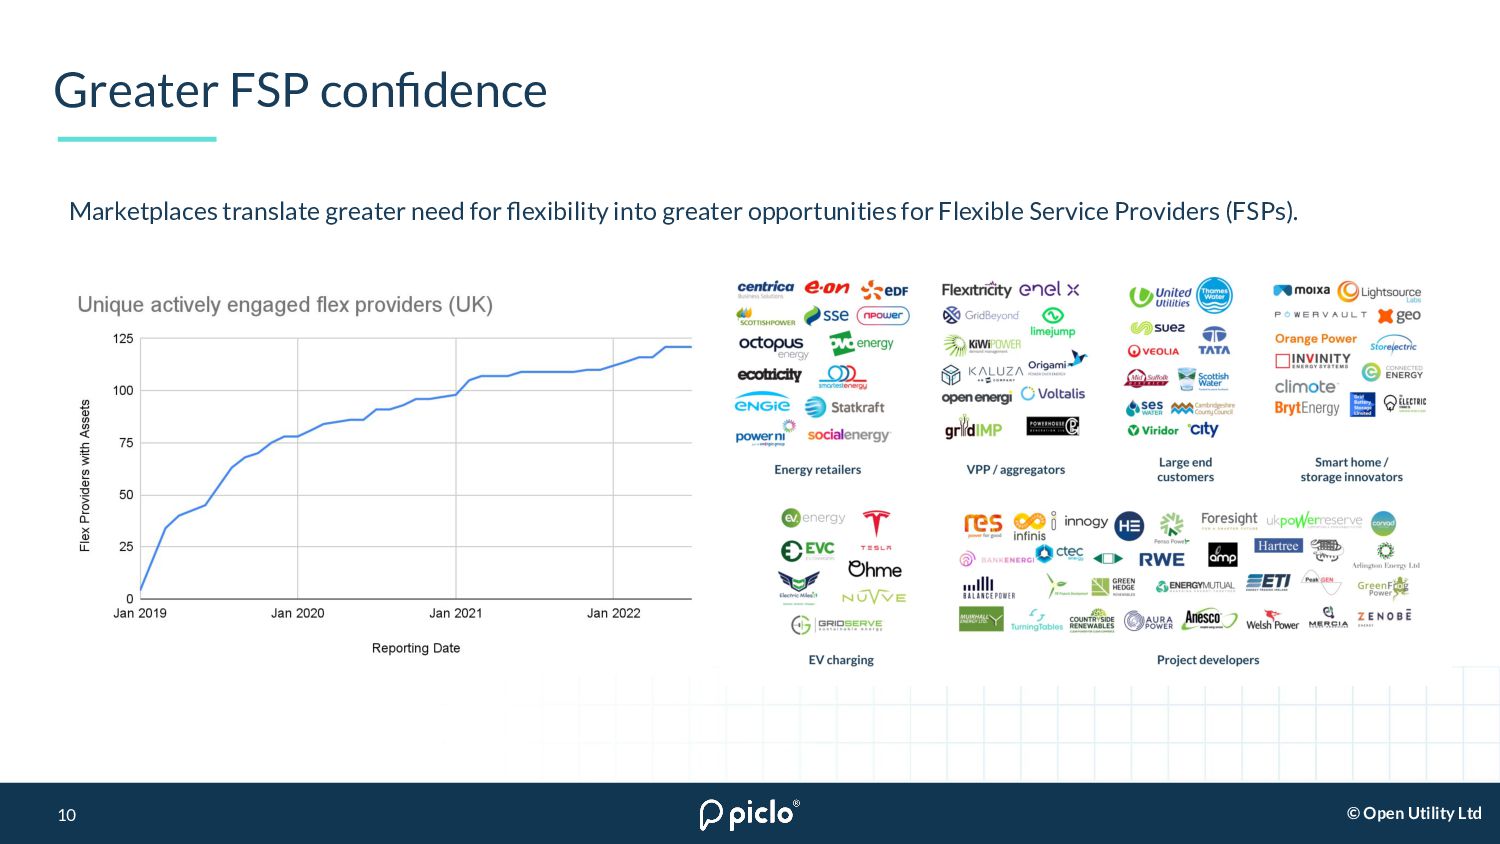
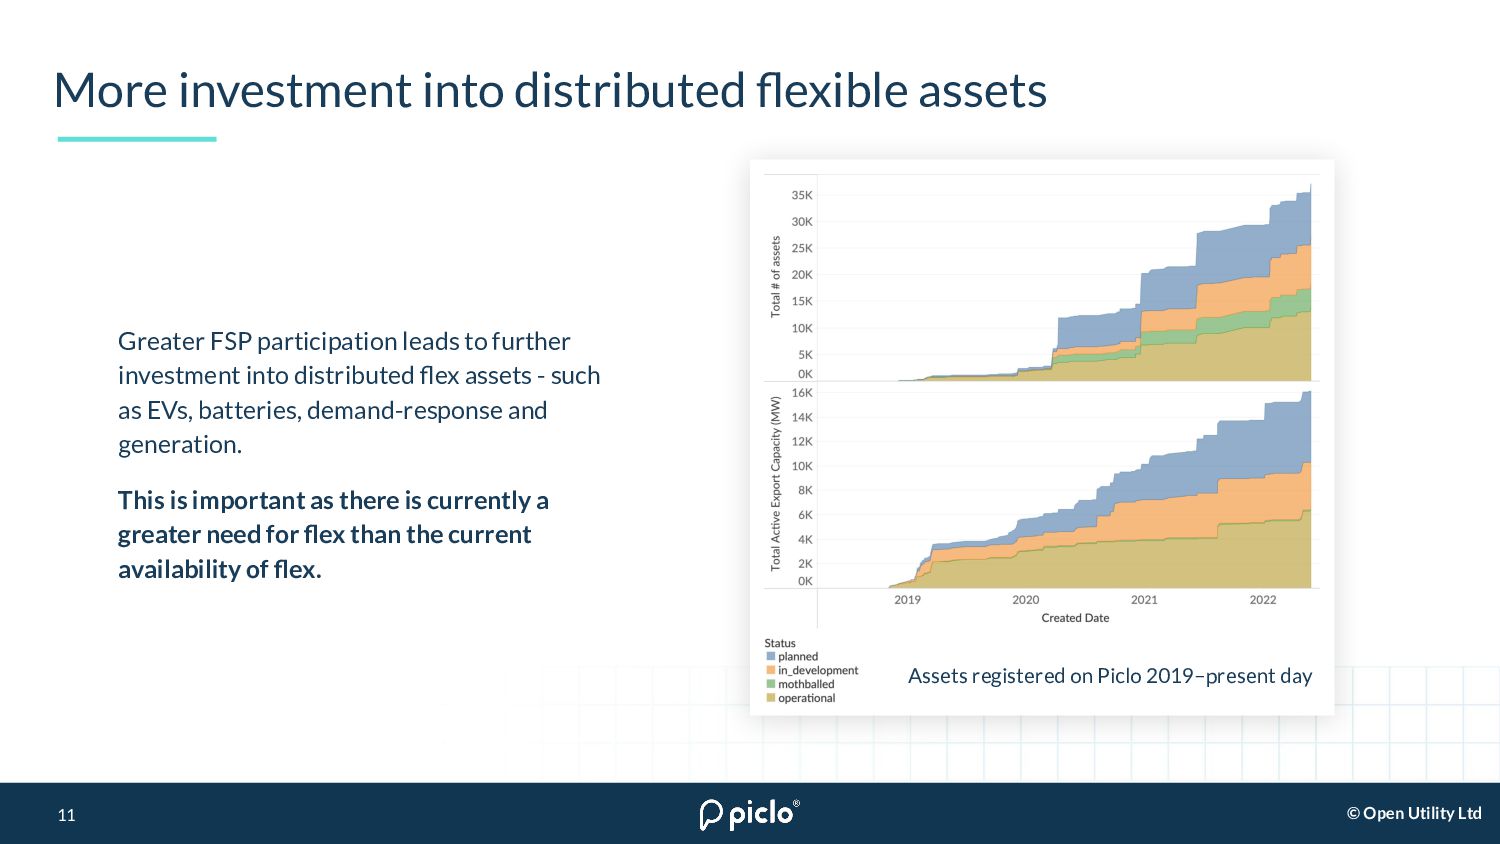
assets 11 Greater FSP participation leads to further investment into distributed flex assets - such as EVs, batteries, demand-response and generation. This is important as there is currently a greater need for flex than the current availability of flex. Assets registered on Piclo 2019–present day
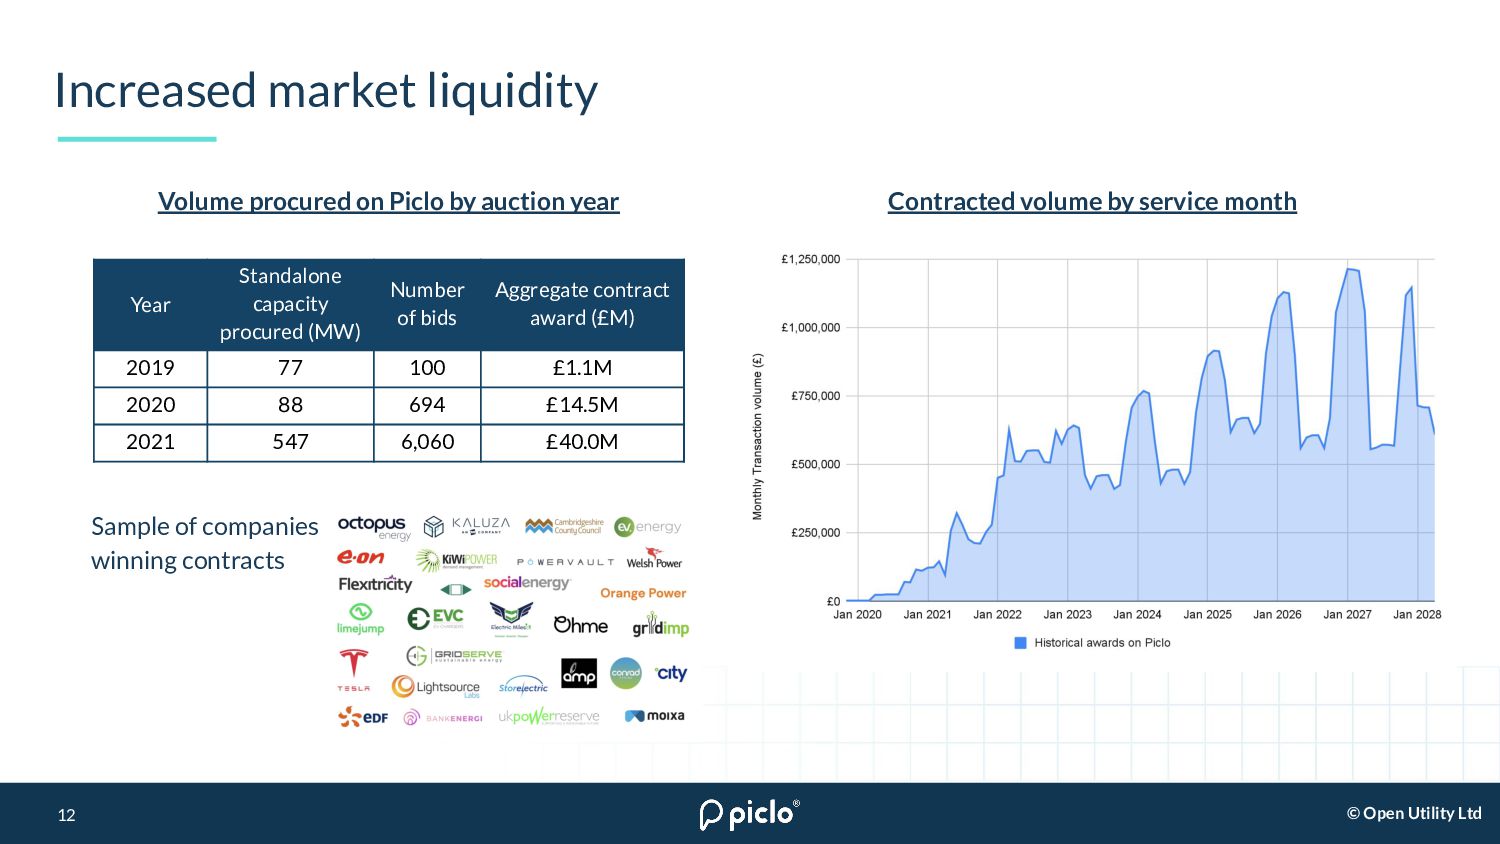
Standalone capacity procured (MW) Number of bids Aggregate contract award (£M) 2019 77 100 £1.1M 2020 88 694 £14.5M 2021 547 6,060 £40.0M Volume procured on Piclo by auction year Contracted volume by service month Sample of companies winning contracts
DSOs gain confidence ↑ need for flexibility ↑ FSP confidence ↑ market liquidity Increased stresses on the network Local flex transactions Stronger regulatory incentives More investment into flexibility assets Improved marketplace services
![Book a demo [email protected] www.piclo.energy Get in contact](https://files.speakerdeck.com/presentations/a3dbf4d8c24641d3aaeb81032086bac4/slide_13.jpg)