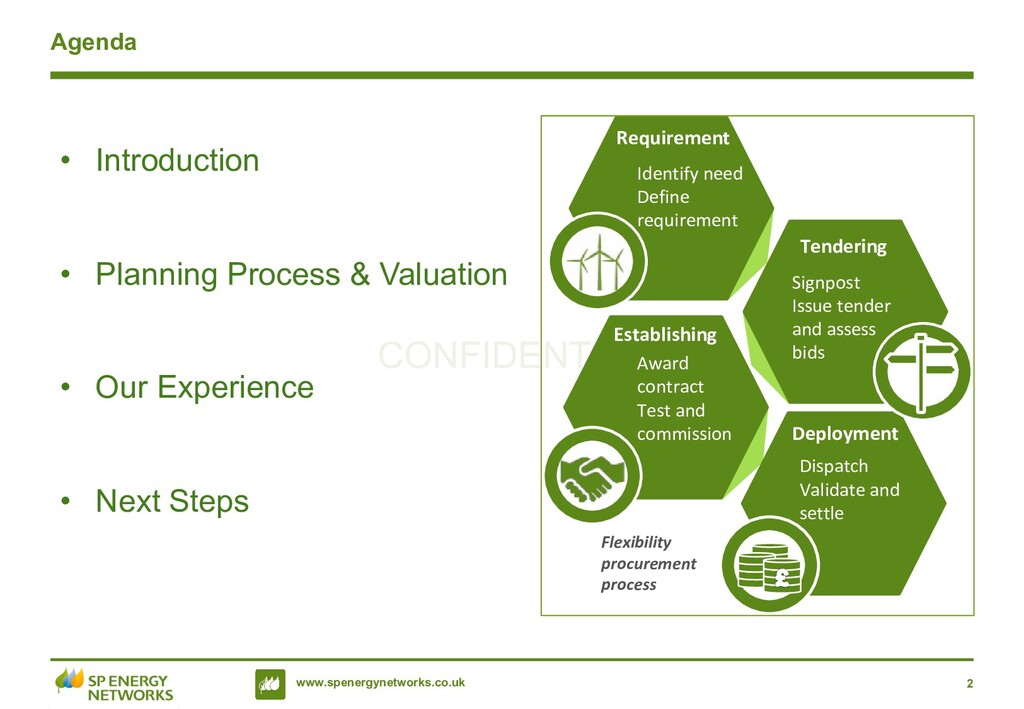
Process & Valuation • Our Experience • Next Steps Requirement Tendering Establishing Deployment Identify need Define requirement Signpost Issue tender and assess bids Award contract Test and commission Dispatch Validate and settle Flexibility procurement process
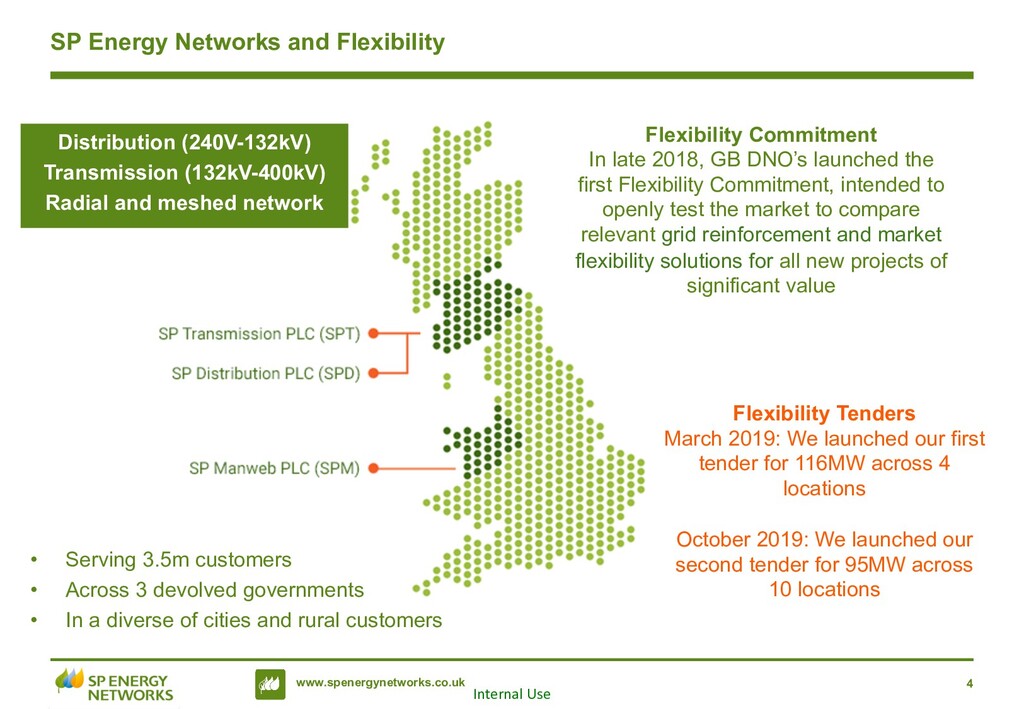
Distribution (240V-132kV) Transmission (132kV-400kV) Radial and meshed network Flexibility Commitment In late 2018, GB DNO’s launched the first Flexibility Commitment, intended to openly test the market to compare relevant grid reinforcement and market flexibility solutions for all new projects of significant value Flexibility Tenders March 2019: We launched our first tender for 116MW across 4 locations October 2019: We launched our second tender for 95MW across 10 locations • Serving 3.5m customers • Across 3 devolved governments • In a diverse of cities and rural customers
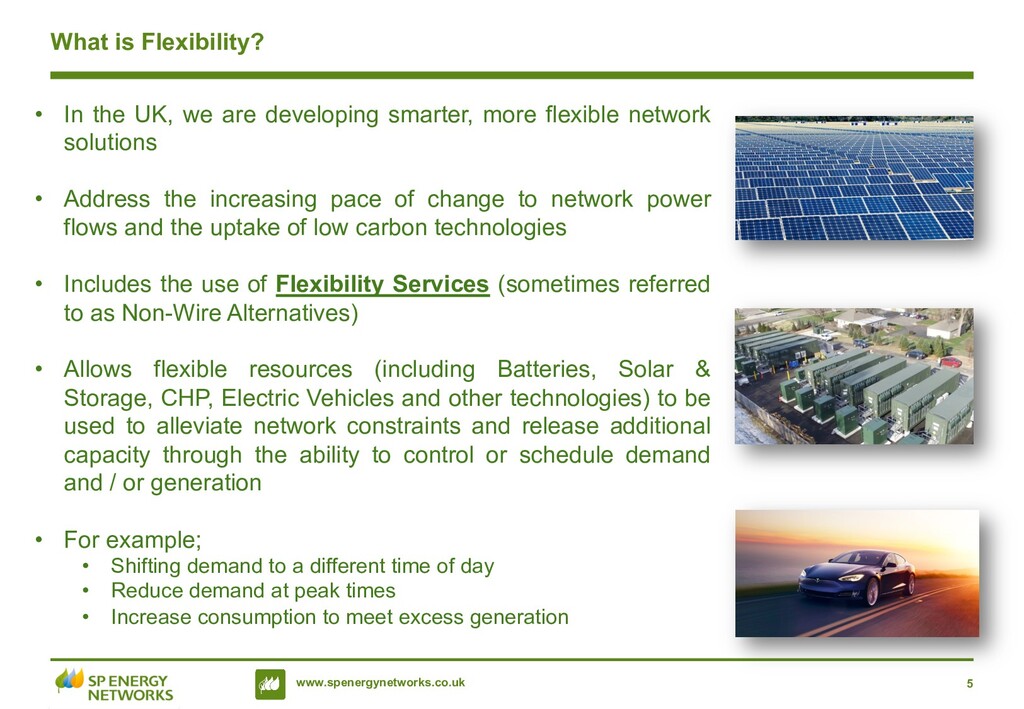
UK, we are developing smarter, more flexible network solutions • Address the increasing pace of change to network power flows and the uptake of low carbon technologies • Includes the use of Flexibility Services (sometimes referred to as Non-Wire Alternatives) • Allows flexible resources (including Batteries, Solar & Storage, CHP, Electric Vehicles and other technologies) to be used to alleviate network constraints and release additional capacity through the ability to control or schedule demand and / or generation • For example; • Shifting demand to a different time of day • Reduce demand at peak times • Increase consumption to meet excess generation
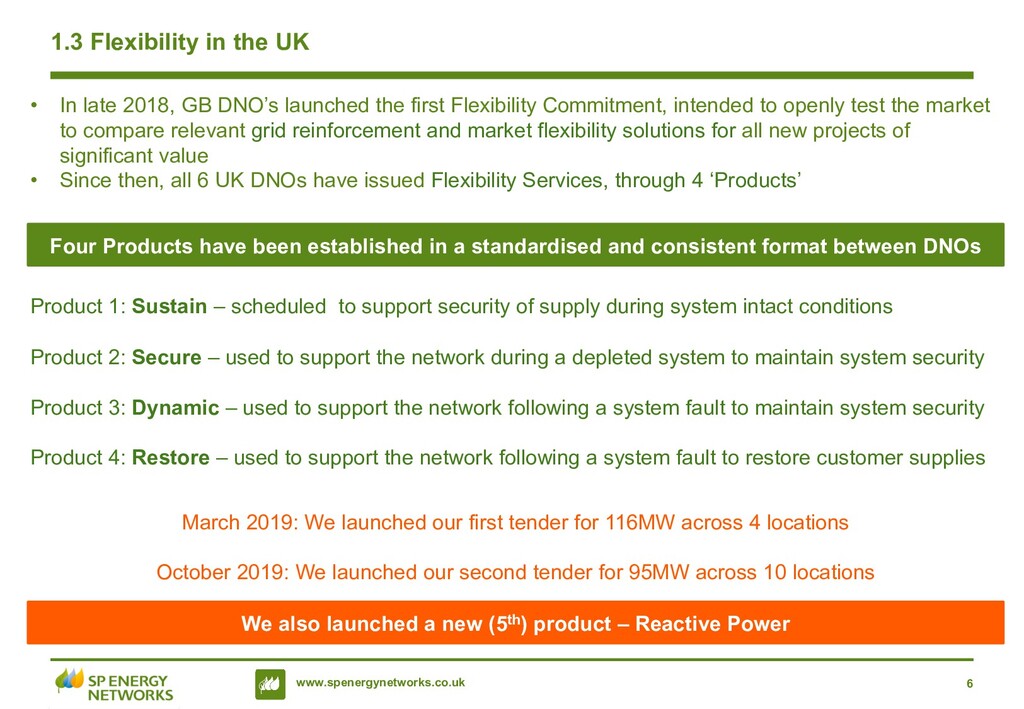
In late 2018, GB DNO’s launched the first Flexibility Commitment, intended to openly test the market to compare relevant grid reinforcement and market flexibility solutions for all new projects of significant value • Since then, all 6 UK DNOs have issued Flexibility Services, through 4 ‘Products’ Product 1: Sustain – scheduled to support security of supply during system intact conditions Product 2: Secure – used to support the network during a depleted system to maintain system security Product 3: Dynamic – used to support the network following a system fault to maintain system security Product 4: Restore – used to support the network following a system fault to restore customer supplies March 2019: We launched our first tender for 116MW across 4 locations October 2019: We launched our second tender for 95MW across 10 locations Four Products have been established in a standardised and consistent format between DNOs We also launched a new (5th) product – Reactive Power
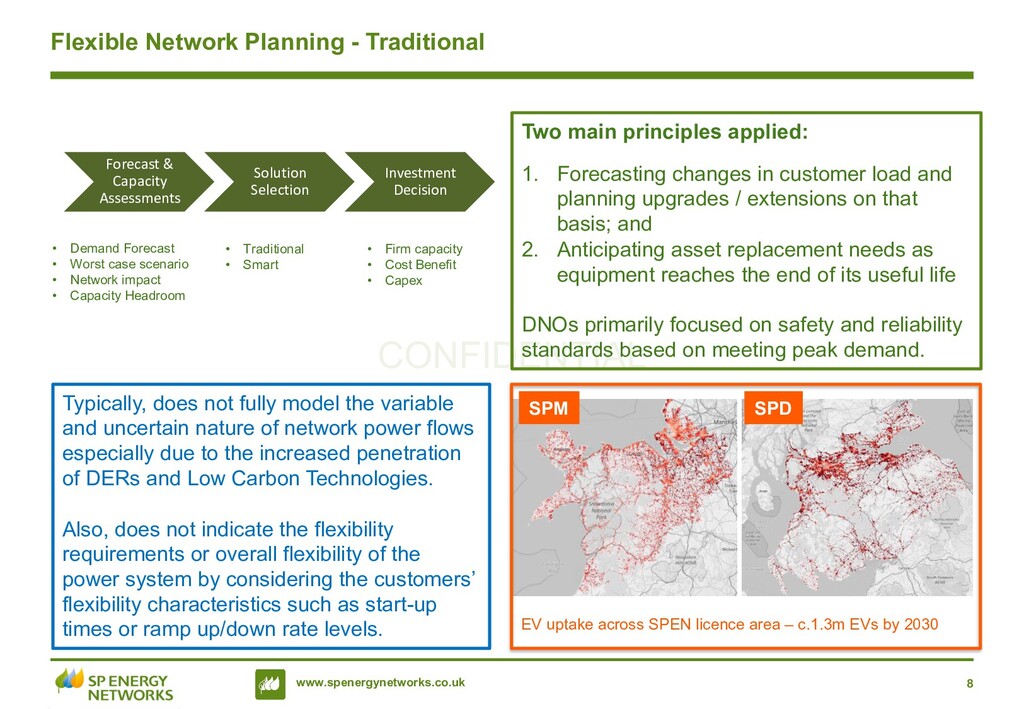
Two main principles applied: 1. Forecasting changes in customer load and planning upgrades / extensions on that basis; and 2. Anticipating asset replacement needs as equipment reaches the end of its useful life DNOs primarily focused on safety and reliability standards based on meeting peak demand. EV uptake across SPEN licence area – c.1.3m EVs by 2030 Typically, does not fully model the variable and uncertain nature of network power flows especially due to the increased penetration of DERs and Low Carbon Technologies. Also, does not indicate the flexibility requirements or overall flexibility of the power system by considering the customers’ flexibility characteristics such as start-up times or ramp up/down rate levels. SPM SPD Forecast & Capacity Assessments Solution Selection Investment Decision • Demand Forecast • Worst case scenario • Network impact • Capacity Headroom • Traditional • Smart • Firm capacity • Cost Benefit • Capex
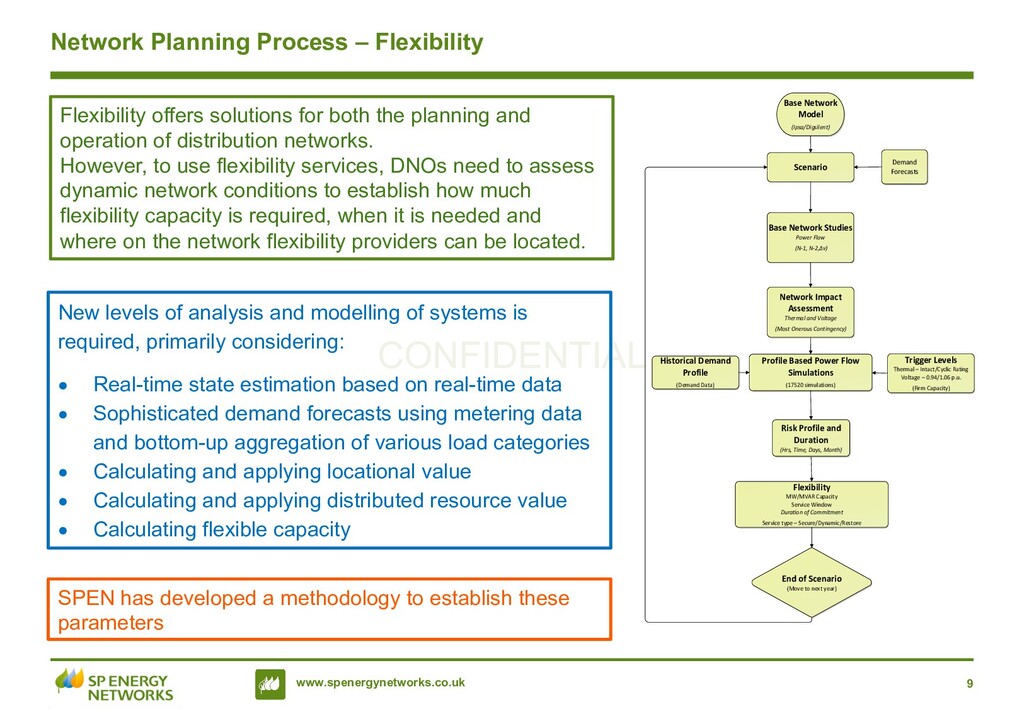
New levels of analysis and modelling of systems is required, primarily considering: • Real-time state estimation based on real-time data • Sophisticated demand forecasts using metering data and bottom-up aggregation of various load categories • Calculating and applying locational value • Calculating and applying distributed resource value • Calculating flexible capacity Flexibility offers solutions for both the planning and operation of distribution networks. However, to use flexibility services, DNOs need to assess dynamic network conditions to establish how much flexibility capacity is required, when it is needed and where on the network flexibility providers can be located. SPEN has developed a methodology to establish these parameters Base Network Model (Ipsa/Digsilent) Base Network Studies Power Flow (N-1, N-2,∆v) Scenario Demand Forecasts Profile Based Power Flow Simulations (17520 simulations) Flexibility MW/MVAR Capacity Service Window Duration of Commitment Service type – Secure/Dynamic/Restore End of Scenario (Move to next year) Risk Profile and Duration (Hrs, Time, Days, Month) Network Impact Assessment Thermal and Voltage (Most Onerous Contingency) Trigger Levels Thermal – Intact/Cyclic Rating Voltage – 0.94/1.06 p.u. (Firm Capacity) Historical Demand Profile (Demand Data)
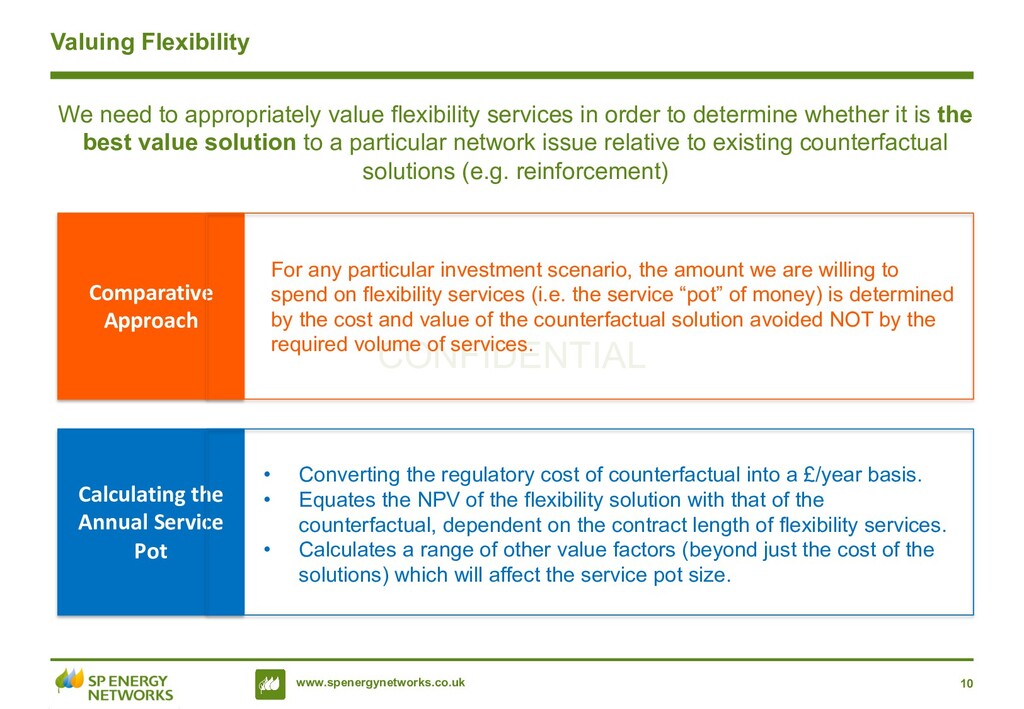
appropriately value flexibility services in order to determine whether it is the best value solution to a particular network issue relative to existing counterfactual solutions (e.g. reinforcement) Comparative Approach For any particular investment scenario, the amount we are willing to spend on flexibility services (i.e. the service “pot” of money) is determined by the cost and value of the counterfactual solution avoided NOT by the required volume of services. Calculating the Annual Service Pot • Converting the regulatory cost of counterfactual into a £/year basis. • Equates the NPV of the flexibility solution with that of the counterfactual, dependent on the contract length of flexibility services. • Calculates a range of other value factors (beyond just the cost of the solutions) which will affect the service pot size.
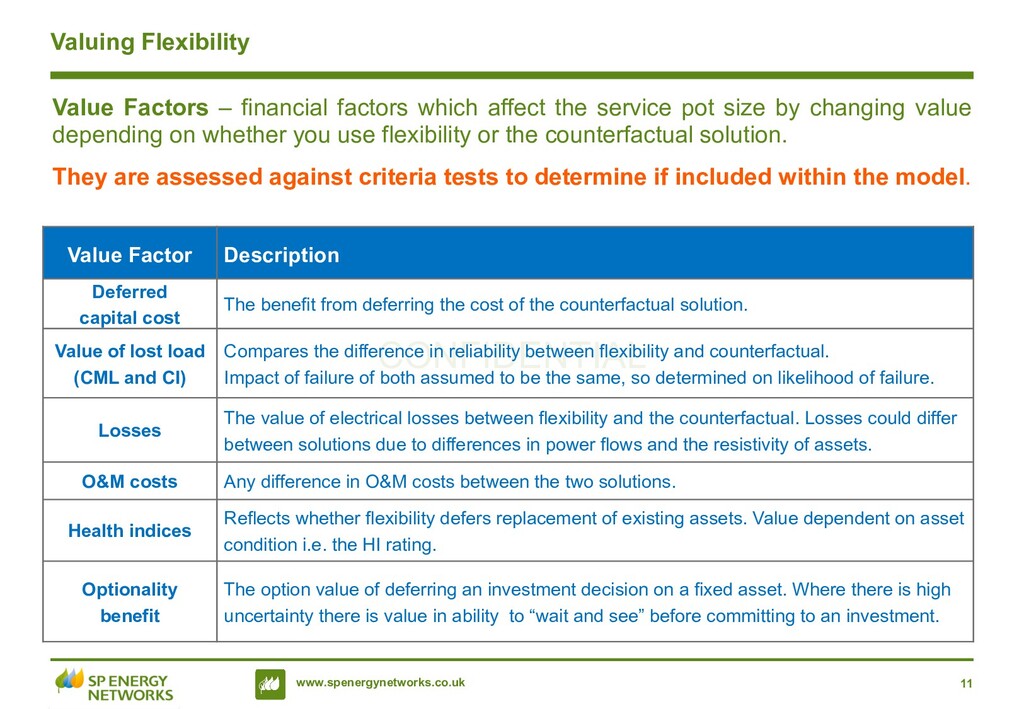
financial factors which affect the service pot size by changing value depending on whether you use flexibility or the counterfactual solution. They are assessed against criteria tests to determine if included within the model. Value Factor Description Deferred capital cost The benefit from deferring the cost of the counterfactual solution. Value of lost load (CML and CI) Compares the difference in reliability between flexibility and counterfactual. Impact of failure of both assumed to be the same, so determined on likelihood of failure. Losses The value of electrical losses between flexibility and the counterfactual. Losses could differ between solutions due to differences in power flows and the resistivity of assets. O&M costs Any difference in O&M costs between the two solutions. Health indices Reflects whether flexibility defers replacement of existing assets. Value dependent on asset condition i.e. the HI rating. Optionality benefit The option value of deferring an investment decision on a fixed asset. Where there is high uncertainty there is value in ability to “wait and see” before committing to an investment.
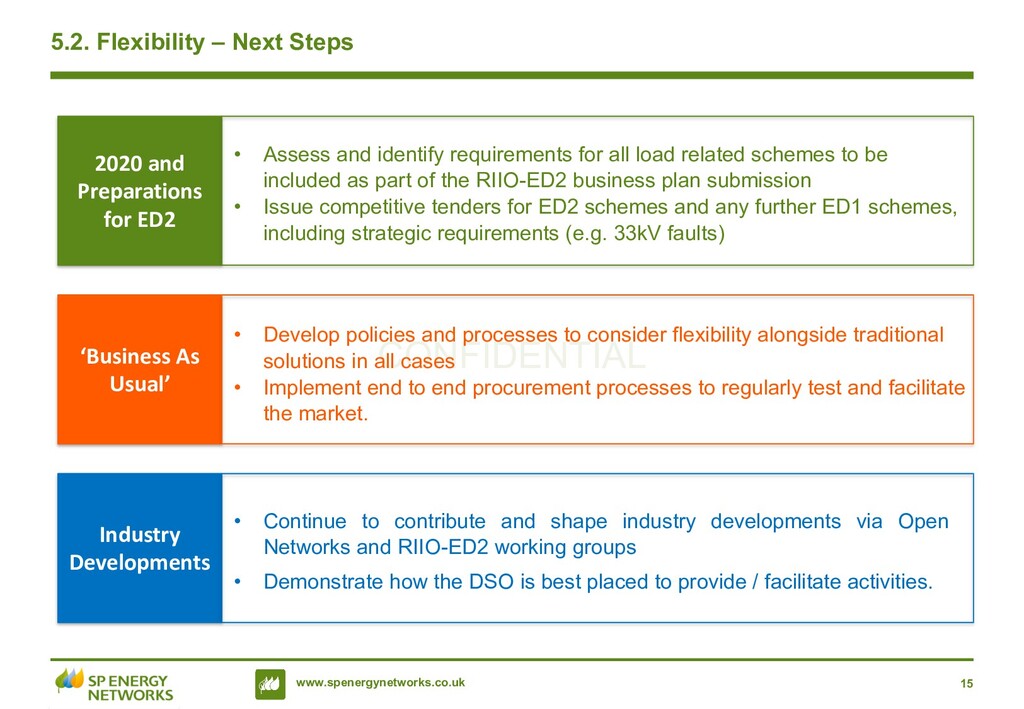
‘Business As Usual’ • Develop policies and processes to consider flexibility alongside traditional solutions in all cases • Implement end to end procurement processes to regularly test and facilitate the market. Industry Developments • Continue to contribute and shape industry developments via Open Networks and RIIO-ED2 working groups • Demonstrate how the DSO is best placed to provide / facilitate activities. 2020 and Preparations for ED2 • Assess and identify requirements for all load related schemes to be included as part of the RIIO-ED2 business plan submission • Issue competitive tenders for ED2 schemes and any further ED1 schemes, including strategic requirements (e.g. 33kV faults)