Share
Embed
OGG - Investor Presentation - November 26
OGG - Investor Presentation - November 26

Philip Rabenok
November 19, 2026
Transcript
48 slides
-
Building Canada’s Next Major Gold Mine November 2026 Investor Presentation
OGG NYSE TSXV | osiskogold.ca -
2 Cautionary Statements CAUTIONARY STATEMENT REGARDING FORWARD-LOOKING INFORMATION that affect
Osisko Gold and its business. Certain statements contained in this presentation (this "Presentation") may be deemed "forward-looking statements" within the meaning of the United States Private Securities Litigation Reform Act of 1995, as amended, and "forward-looking information" within the meaning of applicable Canadian securities legislation (together, "forward-looking statements"). These forward-looking statements, by their nature, require Osisko Gold Group Inc. ("Osisko Gold", "OGG", or the "Company") to make certain assumptions and necessarily involve known and unknown risks and uncertainties that could cause actual results to differ materially from those expressed or implied in these forward-looking statements. Forward-looking statements are not guarantees of performance. Words such as "may", "will", "would", "could", "expect", "believe", "plan", "anticipate", "intend", "estimate", "potential", "propose", "project", "outlook", "foresee", "continue", "objective", "scheduled", "target", variants of these words or the negative or comparable terminology, as well as terms usually used in the future and the conditional, are intended to identify forwardlooking statements. Forward-looking statements in this Presentation include, but are not limited to, statements pertaining to: the expected timing of first gold pour and commercial production at the Cariboo Gold Project and of key construction milestones, including underground development rates and targeted monthly advance rates, completion and collaring of the Valley portals and work on the Valley conveyor portal, the receipt of mine development material at, and completion of, the waste rock storage facility, completion and commissioning of the water treatment plants, construction of the transmission line and process plant, equipment deliveries, including the underground mobile equipment fleet, workforce ramp-up, and commissioning and ramp-up of mining and milling; the continued advancement of detailed engineering, procurement and construction activities, including the award of remaining contract packages; the ability to advance the Cariboo Gold Project through construction within the estimated budget, including the go-forward capital obligation estimate and its embedded contingency, the estimated project completion, the estimated remaining cost to complete construction, the expected leasing or financing of equipment under currently negotiated, non-binding term sheets, and estimated pre-production net revenue and capitalized operating costs; the Company's estimated sources and uses of capital and its ability to fund the remaining construction of the Cariboo Gold Project to commercial production, including the use of funds held in segregated accounts from the proceeds of the Senior Secured Notes and the Company's ability to satisfy the conditions for disbursement therefrom, the use of proceeds of the Trafigura Equity Investment, anticipated exploration, general and administrative, debt service and other expenditures, and the projected surplus of sources over uses (if any); the negotiation and execution of definitive documentation for the proposed term loan facility with Trafigura and equipment financing on commercially acceptable terms, or at all; the potential exercise of outstanding warrants of the Company and the proceeds therefrom (if any); the expected performance of Trafigura under the concentrate and doré offtake arrangements; the Company's ability to meet its obligations under the Senior Secured Notes and the Convertible Senior Notes; the potential conversion, settlement and redemption of the Convertible Senior Notes, the expected effect of the capped call transactions in offsetting potential dilution, and the illustrative settlement scenarios and effective cost of capital described herein; the Cariboo Gold Project's permitting status, the permitting of the Reclamation Closure Plan for Mosquito Creek and the expected timing of receipt of remaining authorizations, permit amendments and construction permits; continued engagement with First Nations and other stakeholders, including the potential for further agreements (if any); the results of the optimized feasibility study for the Cariboo Gold Project (the "2025 Cariboo FS") and of the 2026 go-forward capital update, including estimated after-tax net present value, internal rate of return, payback, free cash flow, total cash costs and all-in sustaining costs under the base case, long-term consensus and spot gold price scenarios, mine life, mine design, production rates and profile, head grades, ore sorting performance, processing recoveries, concentrate payability, grid power supply, and the potential for future throughput expansion (if any); estimates of mineral reserves and mineral resources, and the potential for infill and conversion drilling to upgrade mineral resources to higher levels of geological confidence and to convert mineral resources to mineral reserves (if at all); the anticipated positioning of the Cariboo Gold Project relative to other Canadian gold mines and projects and on the global cost curve, and the potential for the market to re-rate the Company as the Cariboo Gold Project advances through construction toward production (if at all); the Company's planned drilling programs at the Cariboo Gold Project and on regional targets, including their scope, timing and results and the implications thereof (if any); the significance and interpretation of drilling results at the Cariboo Gold Project, including at depth, and at the Proserpine target, including the potential extension of known vein corridors at depth and along strike, the potential for bulk mining methods at Proserpine and the potential for additional deposits on the Cariboo property (if any); the continuation of small-scale test mining and direct shipping of mineralized material at the Tintic Project and the advancement of technical work and exploration of porphyry, epithermal and carbonate replacement targets at the Tintic Project; the Company's objective of becoming an intermediate gold producer; and the exploration potential and potential for future discoveries (if any) on its properties. Information contained in forward-looking statements is based upon certain material assumptions that were applied in drawing a conclusion or making a forecast or projection, including: construction proceeding on the anticipated schedule and within the estimated budget; the accuracy of the go-forward capital obligation estimate and the estimated remaining cost to complete and their underlying assumptions, including inflation, labour costs, exchange rates, the adequacy of contingency, the availability of equipment leasing or financing on anticipated terms and gold prices realized on pre-production revenue; underground development rates improving as anticipated, including following the availability of additional headings through the Valley portals; the availability of personnel, contractors, equipment, supplies and infrastructure, including the timely delivery of long-lead items and mobile equipment; contractors, consultants and suppliers performing as expected; the absence of work stoppages or suspensions at the Cariboo Gold Project; the absence of unforeseen ground conditions or other geological challenges; the availability of the Company's estimated sources of capital as anticipated, including the Company's ability to satisfy the conditions for disbursement from the segregated accounts established under the Senior Secured Notes and the parties negotiating definitive documentation for the proposed term loan facility with Trafigura on terms consistent with the non-binding terms; Trafigura performing its obligations under the offtake arrangements; the Company having sufficient funds to meet its debt service obligations as they become due; required permits, authorizations and amendments being obtained and maintained in a timely manner; the continued support of First Nations and other stakeholders; the assumptions, qualifications and limitations underlying the 2025 Cariboo FS and the Technical Reports, including the mineral reserve and mineral resource estimates, mine design, production profile, processing recoveries and operating costs, and the gold price and exchange rate assumptions used in the 2026 go-forward capital update; the accuracy and comparability of third-party, peer and market data; the availability of drill rigs and personnel, and the ability of drilling and sampling to accurately predict mineralization; results of further drilling being consistent with those to date; test mining and direct shipping at the Tintic Project continuing to generate gold sales as anticipated; the Company's continued access to capital on acceptable terms; and the absence of material adverse changes in gold prices, foreign exchange rates, interest rates, the market price of the Common Shares and general economic and market conditions. Osisko Gold considers its assumptions to be reasonable based on information currently available, but cautions the reader that its assumptions regarding future events, many of which are beyond the control of Osisko Gold, may ultimately prove to be incorrect since they are subject to risks and uncertainties Such risks and uncertainties include, but are not limited to: risks associated with the development and construction of the Cariboo Gold Project, including construction delays, cost overruns, inflation and supply chain disruptions; underground development rates failing to improve as anticipated; work stoppages or suspensions at the Cariboo Gold Project; unforeseen ground, geotechnical or water management conditions; delays in commissioning of infrastructure, including the water treatment plants; contractor, consultant and supplier performance; delays or shortages in necessary equipment, supplies and infrastructure, including long-lead items; the inability to obtain equipment leasing or equipment financing on acceptable terms; pre-production revenue being lower than estimated; the inability to satisfy the conditions for disbursement from the segregated accounts established under the Senior Secured Notes; the risk that a definitive agreement for the proposed term loan facility with Trafigura is not entered into on the terms contemplated, or at all; counterparty performance, including under the offtake arrangements with Trafigura; the Company's indebtedness and its ability to meet its obligations under the Senior Secured Notes and the Convertible Senior Notes as they become due, and restrictions imposed by the covenants thereunder; dilution resulting from the conversion of the Convertible Senior Notes or the exercise of outstanding warrants, and the risk that outstanding warrants are not exercised; labour shortages or disputes, difficulties in recruiting key personnel and health, safety and security incidents; risks relating to third-party approvals, including the issuance of permits by governments, favourable regulatory conditions and approvals, capital market conditions and the Company's ability to access capital on terms acceptable to the Company for the contemplated exploration and development at the Company's properties; regulatory framework and presence of laws and regulations that may impose restrictions on mining; actual production, grades, recoveries, operating costs and capital costs differing from those estimated in the 2025 Cariboo FS and the 2026 go-forward capital update; third-party, peer and market data proving inaccurate or not comparable; errors in management's geological modelling; the timing and ability of the Company to obtain and maintain required approvals and permits; the results of exploration activities, including the risk that further drilling does not confirm current interpretations or support resource conversion; risks associated with test mining not supported by a feasibility study, including test mining and direct shipping at the Tintic Project generating lower gold sales than anticipated or being suspended; risks relating to exploration, development and mining activities; the global economic climate; fluctuations in metal and commodity prices; fluctuations in the currency markets and interest rates; volatility in the market price of the Common Shares; environmental risks; and community, non-governmental and governmental actions, including relationships with First Nations, and the impact of stakeholder actions. Readers are urged to consult the disclosure provided under the heading "Risk Factors" in the Company's annual information form for the year ended December 31, 2025 as well as those risks and factors disclosed in the Company's most recent financial statements and management's discussion and analysis and other public filings filed under Osisko Gold's issuer profile on SEDAR+ (www.sedarplus.ca) and on the SEC's EDGAR website (www.sec.gov), for further information regarding the risks and other factors facing the Company, its business and operations. Although the Company believes the expectations conveyed by the forward-looking statements are reasonable based on information available as of the date hereof, no assurances can be given as to future results, levels of activity and achievements. Forward-looking statements are not guarantees of performance and there can be no assurance that these forward-looking statements will prove to be accurate, as actual results and future events could differ materially from those anticipated in such statements. Accordingly, readers should not place undue reliance on forward-looking statements. Readers are cautioned that the foregoing lists of assumptions, risks and uncertainties are not exhaustive. The forward-looking statements contained herein are made as of the date of this Presentation and, except as required by applicable law, the Company undertakes no obligation to update publicly or to revise any of the forward-looking statements, whether as a result of new information, future events or otherwise. Unless otherwise noted, this Presentation has been prepared based on information available as of November 11, 2026. All currency references are to Canadian dollars, unless specified otherwise. NON-IFRS FINANCIAL MEASURES This Presentation contains certain non-IFRS (as defined herein) measures, including "all-in sustaining cost" (or "AISC"), "cash cost", "free cash flow" and "adjusted working capital". All-in sustaining cost per gold ounce is defined as production costs less silver sales plus general and administrative, exploration and other expenses, and sustaining capital expenditures divided by gold ounces sold. Cash costs are a non-IFRS measure reported by the Company on an ounces of gold sold basis. Cash costs include mining, processing, refining, general and administrative costs and royalties but exclude depreciation, reclamation, income taxes, capital costs and exploration costs. Free cash flow is calculated as cash flow from mine-site operating activities less capital expenditures. Management believes that such measures provide investors with an improved ability to evaluate the performance of the Company. Non-IFRS financial measures do not have any standardized meaning prescribed under International Financial Reporting Standards ("IFRS") and, therefore, they may not be comparable to similar measures employed by other companies. These measures are intended to provide additional information and should not be considered in isolation or as a substitute for measures of performance prepared in accordance with IFRS, such as cost of sales. For further detail on non-IFRS measures used in this Presentation, please refer to the 2025 Cariboo FS. OGG NYSE TSXV -
3 Cautionary Statements CAUTIONARY NOTE TO U.S. INVESTORS ACCURACY AND
RELIABILITY OF MARKET, INDUSTRY AND THIRD-PARTY INFORMATION As a foreign private issuer under U.S. securities laws that files reports under the Canada-U.S. multijurisdictional disclosure system, the Company is permitted to prepare and report information regarding mineral properties, mineralization and estimates of mineral reserves and mineral resources, including the information in its technical reports, financial statements and MD&A, in accordance with Canadian reporting requirements, which are governed by NI 43-101. As such, such information concerning mineral properties, mineralization and estimates of mineral reserves and mineral resources, including the information in its technical reports, financial statements and MD&A, is not comparable to similar information made public by most companies subject to U.S. mineral property disclosure requirements of the U.S. Securities and Exchange Commission ("SEC"). Certain information contained in this Presentation is based on, or derived from, information provided by independent third-party sources and the Company’s own internal estimates and research. The Company believes that such information is accurate and that the sources from which it has been obtained are reliable, however, OGG has not independently verified such information and does not assume any responsibility for the accuracy or completeness of such information. In addition, no independent source has evaluated the reasonableness or accuracy of the Company’s internal estimates or research and no reliance should be made on any information or statements made in this Presentation relating to or based on such internal estimates and research. In furnishing this information, the Company does not undertake any obligation to provide you with access to any additional information or to update or correct the information. Further to recent amendments, U.S. mineral property disclosure requirements (the "SEC Rules") are now governed by subpart 1300 of Regulation S-K under the U.S. Securities Act. Under the SEC Rules, the SEC now recognizes estimates of "measured mineral resources", "indicated mineral resources" and "inferred mineral resources." In addition, the SEC has amended its definitions of "proven mineral reserves" and "probable mineral reserves" to be "substantially similar" to the corresponding standards adopted by the Canadian Institute of Mining, Metallurgy and Petroleum, adopted by the CIM Council ("CIM Standards"), which is the required definition standard adopted by NI 43-101. While the SEC will now recognize "measured mineral resources", "indicated mineral resources" and "inferred mineral resources", U.S. investors should not assume that any part or all of the mineralization in these categories will ever be converted into a higher category of mineral resources or into mineral reserves. Mineralization described using these terms has a greater amount of uncertainty as to its existence and feasibility than mineralization that has been characterized as reserves. Accordingly, U.S. investors are cautioned not to assume that any measured mineral resources, indicated mineral resources, or inferred mineral resources that the Company reports are or will be economically or legally mineable. Further, "inferred mineral resources" have a greater amount of uncertainty as to their existence and as to whether they can be mined legally or economically. Therefore, U.S. investors are also cautioned not to assume that all or any part of the "inferred mineral resources" exist. Under NI 43-101, estimates of inferred mineral resources may not form the basis of feasibility or pre-feasibility studies or economic studies except for preliminary economic assessments. While the above terms are "substantially similar" to CIM Standards, there are differences in the definitions under the SEC Rules and the CIM Standards. Accordingly, there is no assurance any mineral reserves or mineral resources that the Company may report as "proven mineral reserves", "probable mineral reserves", "measured mineral resources", "indicated mineral resources" and "inferred mineral resources" under NI 43-101 would be the same had the Company prepared the reserve or resource estimates under the SEC Rules. CAUTION REGARDING MINERAL RESOURCE ESTIMATES This Presentation uses the terms measured, indicated and inferred mineral resources as a relative measure of the level of confidence in the mineral resource estimate. Readers are cautioned that mineral resources are not mineral reserves and that the economic viability of resources that are not mineral reserves has not been demonstrated. The mineral resource estimate disclosed in this Presentation may be materially affected by geology, environmental, permitting, legal, title, sociopolitical, marketing or other relevant issues. Mineral Resources are reported using the 2014 CIM Definition Standards and were estimated in accordance with the CIM 2019 Best Practices Guidelines, as required by NI 43-101. Under NI 43-101, estimates of inferred mineral resources may not form the basis of feasibility or prefeasibility studies or economic studies except for preliminary economic assessments. Readers are cautioned not to assume that further work on the stated mineral resources will lead to mineral reserves that can be mined economically. CAUTION REGARDING TEST MINING WITHOUT FEASIBILITY STUDY Certain operations of the Company including current and prior test mining activities at the Tintic Project's Trixie test mine, have operated without the benefit of a feasibility study that defines mineral reserves, and demonstrates economic and technical viability. As a result, there is increased uncertainty of achieving any particular level of recovery of material or the cost of such recovery. The Company cautions that, historically, such projects have a much higher risk of economic and technical failure. There is no guarantee that commercial production will commence, continue as anticipated or at all or that anticipated production costs will be achieved. SCIENTIFIC AND TECHNICAL INFORMATION Scientific and technical information relating to the Cariboo Gold Project and the 2025 Cariboo FS on the Cariboo Gold Project is supported by the technical report titled "NI 43-101 Technical Report, Feasibility Study for the Cariboo Gold Project, District of Wells, British Columbia, Canada" and dated June 11, 2025 (with an effective date of April 25, 2025) (the "Cariboo Technical Report"). Scientific and technical information relating to the Tintic Project and the current mineral resource estimate for the Trixie deposit (the "2024 Trixie MRE") is supported by the technical report titled "NI 43-101 Technical Report, Mineral Resource Estimate for the Trixie Deposit, Tintic Project, Utah, United States of America" and dated April 25, 2024 (with an effective date of March 14, 2024) (the "Tintic Technical Report" and collectively with the Cariboo Technical Report, the "Technical Reports"). For readers to fully understand the information in the Technical Reports, reference should be made to the full text of the Technical Reports in their entirety, including all assumptions, parameters, qualifications, limitations and methods therein. The Technical Reports are intended to be read as a whole, and sections should not be read or relied upon out of context. The Technical Reports were prepared in accordance with NI 43-101 and are available electronically on SEDAR+ (www.sedarplus.ca) and on EDGAR (www.sec.gov) under Osisko Gold's issuer profile and on the Company's website at www.osiskogold.ca. QUALIFIED PERSONS Scott Smith, P. Geo., Vice President, Exploration, of Osisko Gold Group Inc., is considered a "qualified person" within the meaning of NI 43-101 and have reviewed and approved the scientific and technical information contained herein. ABBREVIATIONS AND UNITS OF MEASUREMENT In this Presentation, the Company uses certain abbreviations, including: measured and indicated ("M&I"), million ("M"), thousand ("k"), metric tonnes ("t"), troy ounces ("oz"), grams per tonne ("g/t"), gold ("Au"), silver ("Ag"), copper ("Cu"), lead ("Pb"), zinc ("Zn"), net present value ("NPV"); NPV at a 5% discount rate ("NPV5%"); internal rate of return ("IRR"); tonnes per day ("tpd"); free cash flow ("FCF"); years ("yrs"); per annum ("pa"); average ("avg."); life-of-mine ("LOM"); versus ("vs."). OGG NYSE TSXV -
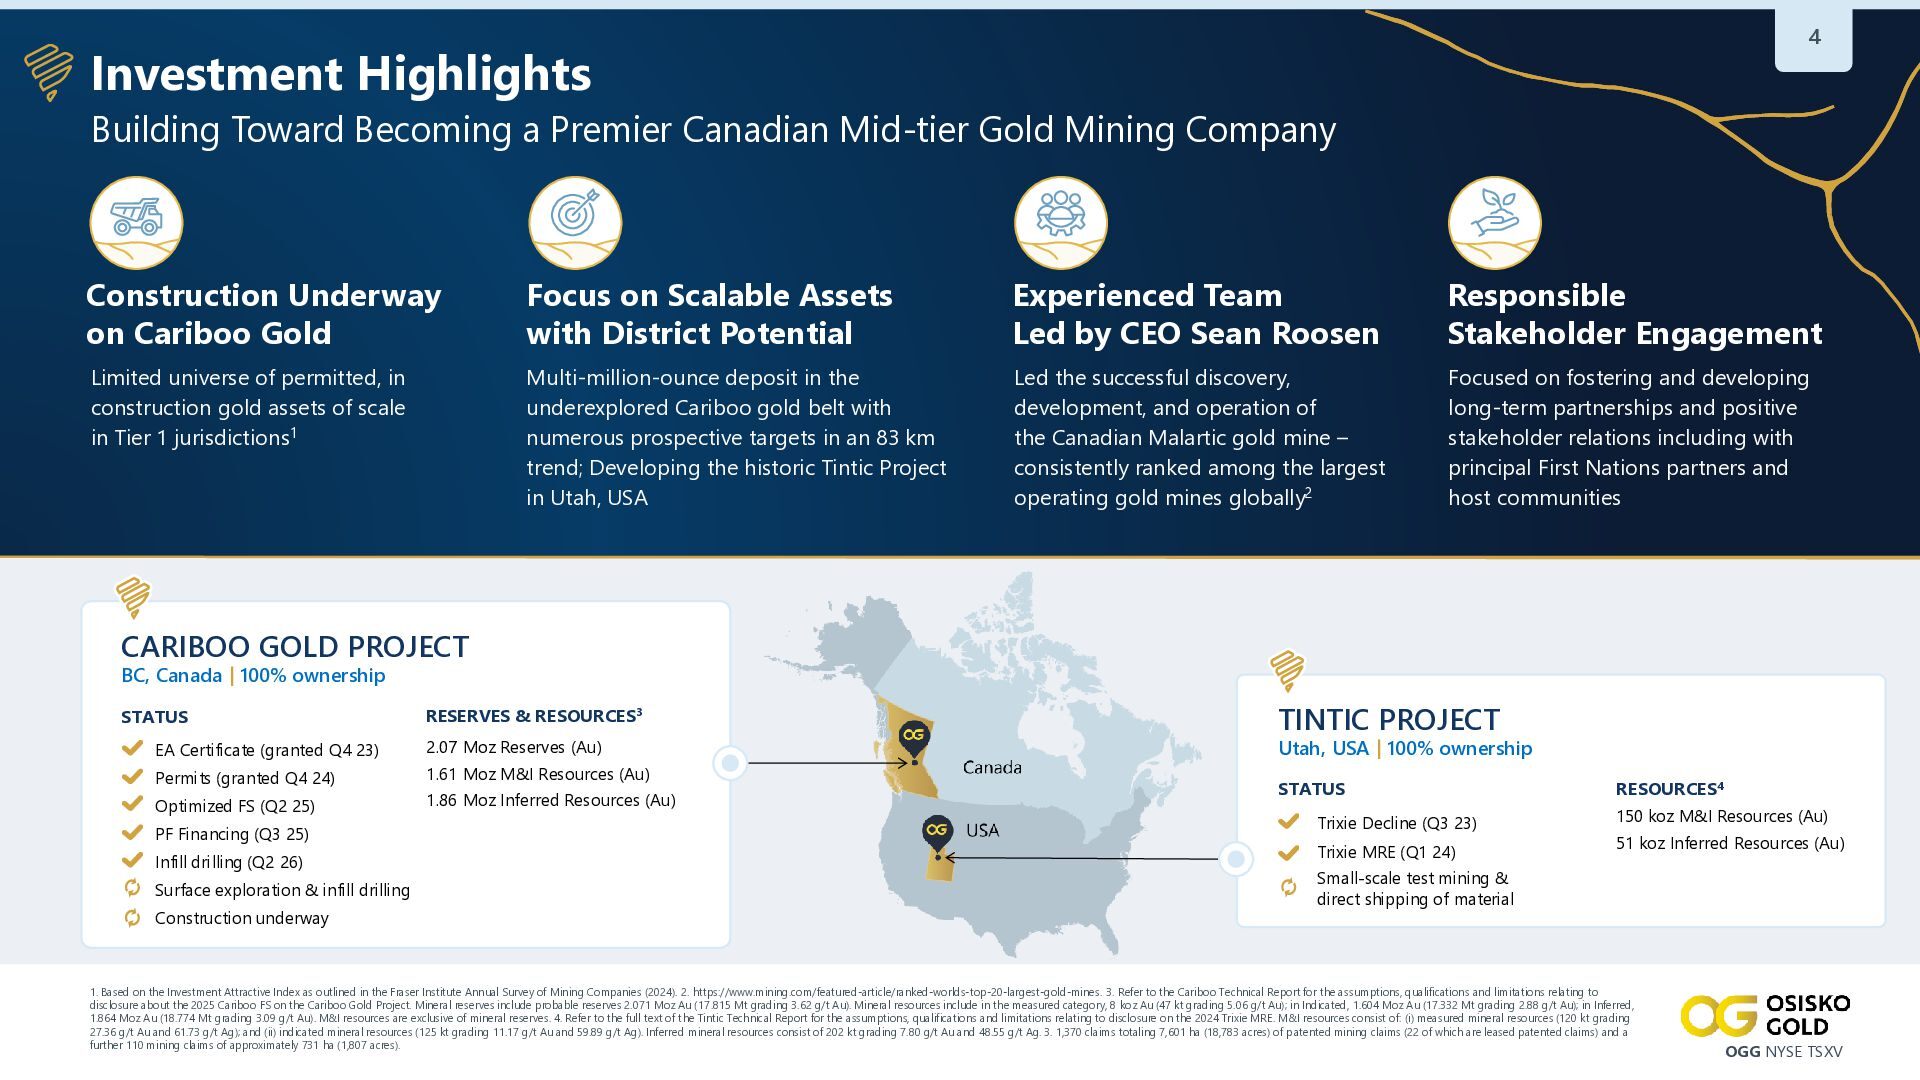
4 Investment Highlights Building Toward Becoming a Premier Canadian Mid-tier
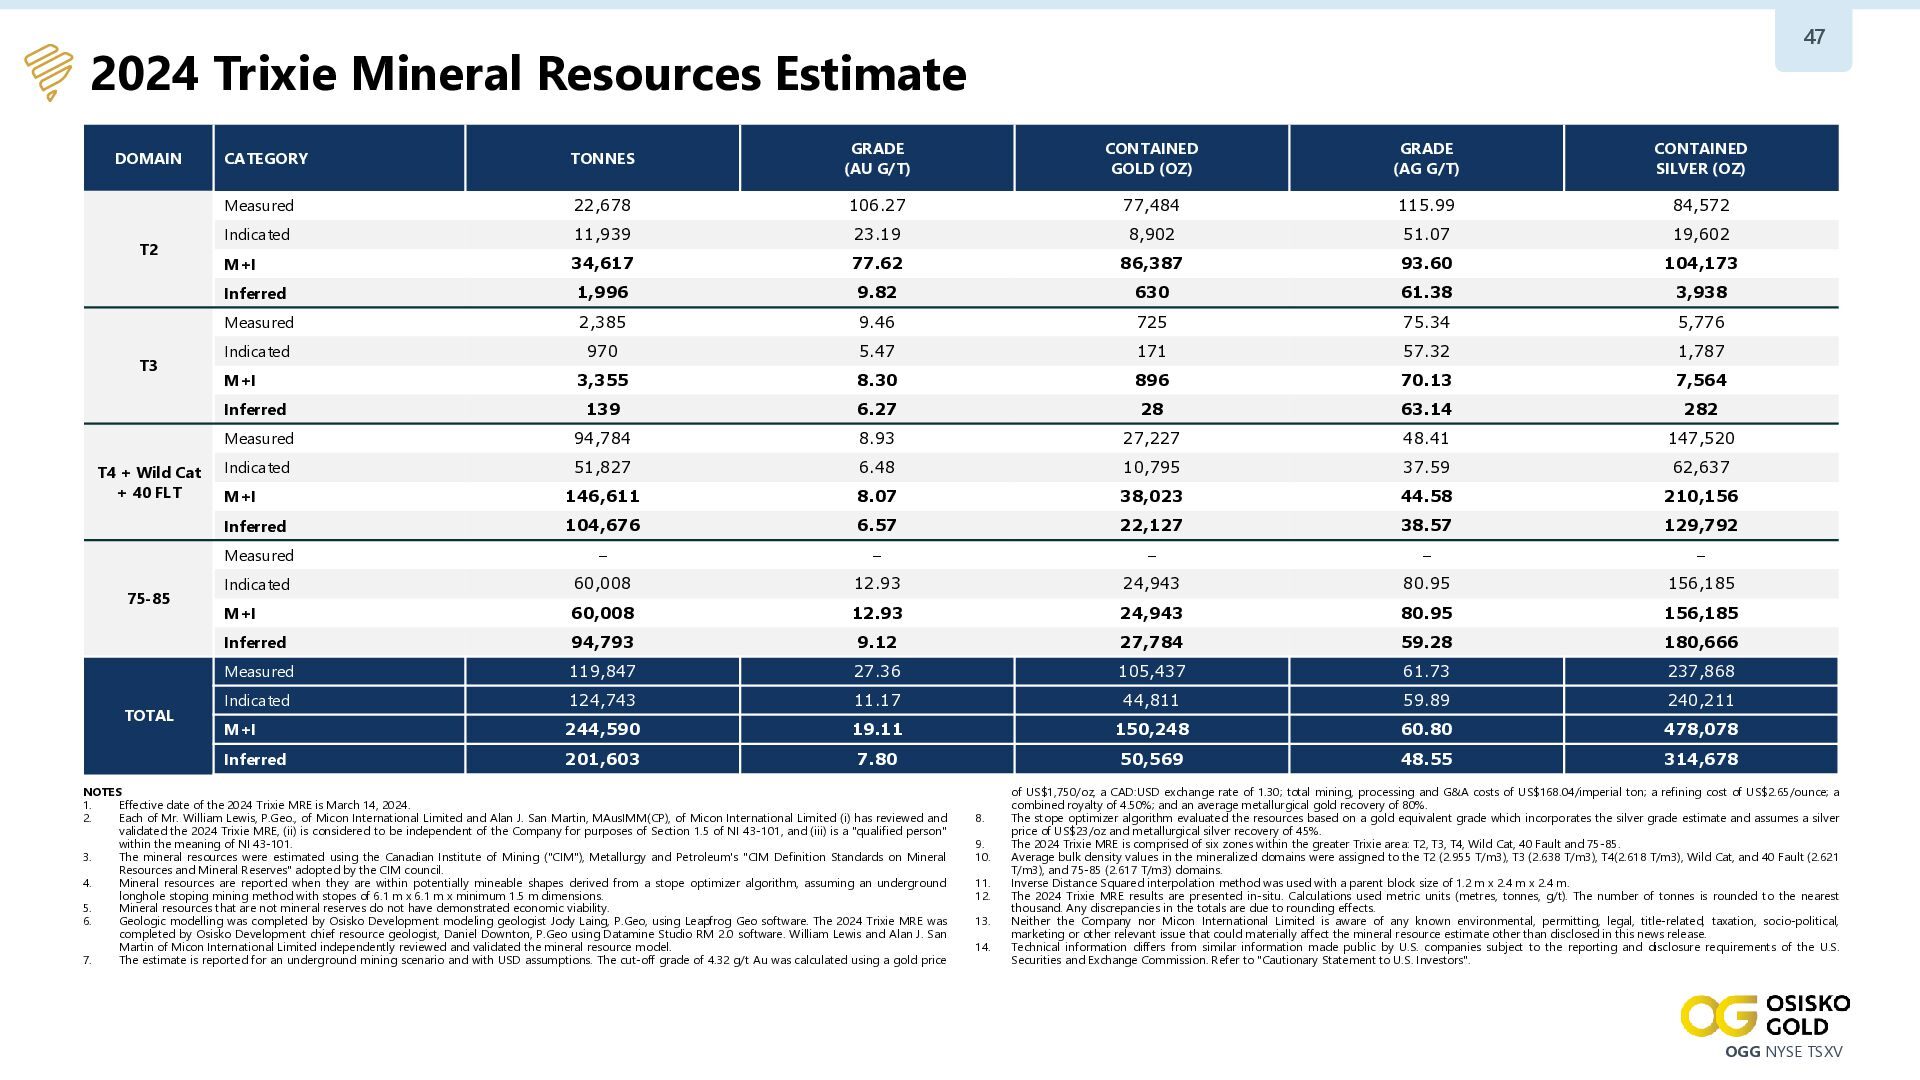
Gold Mining Company Construction Underway on Cariboo Gold Focus on Scalable Assets with District Potential Experienced Team Led by CEO Sean Roosen Responsible Stakeholder Engagement Limited universe of permitted, in construction gold assets of scale in Tier 1 jurisdictions1 Multi-million-ounce deposit in the underexplored Cariboo gold belt with numerous prospective targets in an 83 km trend; Developing the historic Tintic Project in Utah, USA Led the successful discovery, development, and operation of the Canadian Malartic gold mine – consistently ranked among the largest operating gold mines globally2 Focused on fostering and developing long-term partnerships and positive stakeholder relations including with principal First Nations partners and host communities CARIBOO GOLD PROJECT BC, Canada | 100% ownership STATUS RESERVES & RESOURCES3 EA Certificate (granted Q4 23) 2.07 Moz Reserves (Au) Permits (granted Q4 24) 1.61 Moz M&I Resources (Au) Optimized FS (Q2 25) 1.86 Moz Inferred Resources (Au) PF Financing (Q3 25) Infill drilling (Q2 26) Surface exploration & infill drilling Construction underway TINTIC PROJECT Utah, USA | 100% ownership STATUS Trixie Decline (Q3 23) Trixie MRE (Q1 24) RESOURCES4 150 koz M&I Resources (Au) 51 koz Inferred Resources (Au) Small-scale test mining & direct shipping of material 1. Based on the Investment Attractive Index as outlined in the Fraser Institute Annual Survey of Mining Companies (2024). 2. https://www.mining.com/featured-article/ranked-worlds-top-20-largest-gold-mines. 3. Refer to the Cariboo Technical Report for the assumptions, qualifications and limitations relating to disclosure about the 2025 Cariboo FS on the Cariboo Gold Project. Mineral reserves include probable reserves 2.071 Moz Au (17.815 Mt grading 3.62 g/t Au). Mineral resources include in the measured category, 8 koz Au (47 kt grading 5.06 g/t Au); in Indicated, 1.604 Moz Au (17.332 Mt grading 2.88 g/t Au); in Inferred, 1.864 Moz Au (18.774 Mt grading 3.09 g/t Au). M&I resources are exclusive of mineral reserves. 4. Refer to the full text of the Tintic Technical Report for the assumptions, qualifications and limitations relating to disclosure on the 2024 Trixie MRE. M&I resources consist of: (i) measured mineral resources (120 kt grading 27.36 g/t Au and 61.73 g/t Ag); and (ii) indicated mineral resources (125 kt grading 11.17 g/t Au and 59.89 g/t Ag). Inferred mineral resources consist of 202 kt grading 7.80 g/t Au and 48.55 g/t Ag. 3. 1,370 claims totaling 7,601 ha (18,783 acres) of patented mining claims (22 of which are leased patented claims) and a further 110 mining claims of approximately 731 ha (1,807 acres). OGG NYSE TSXV -
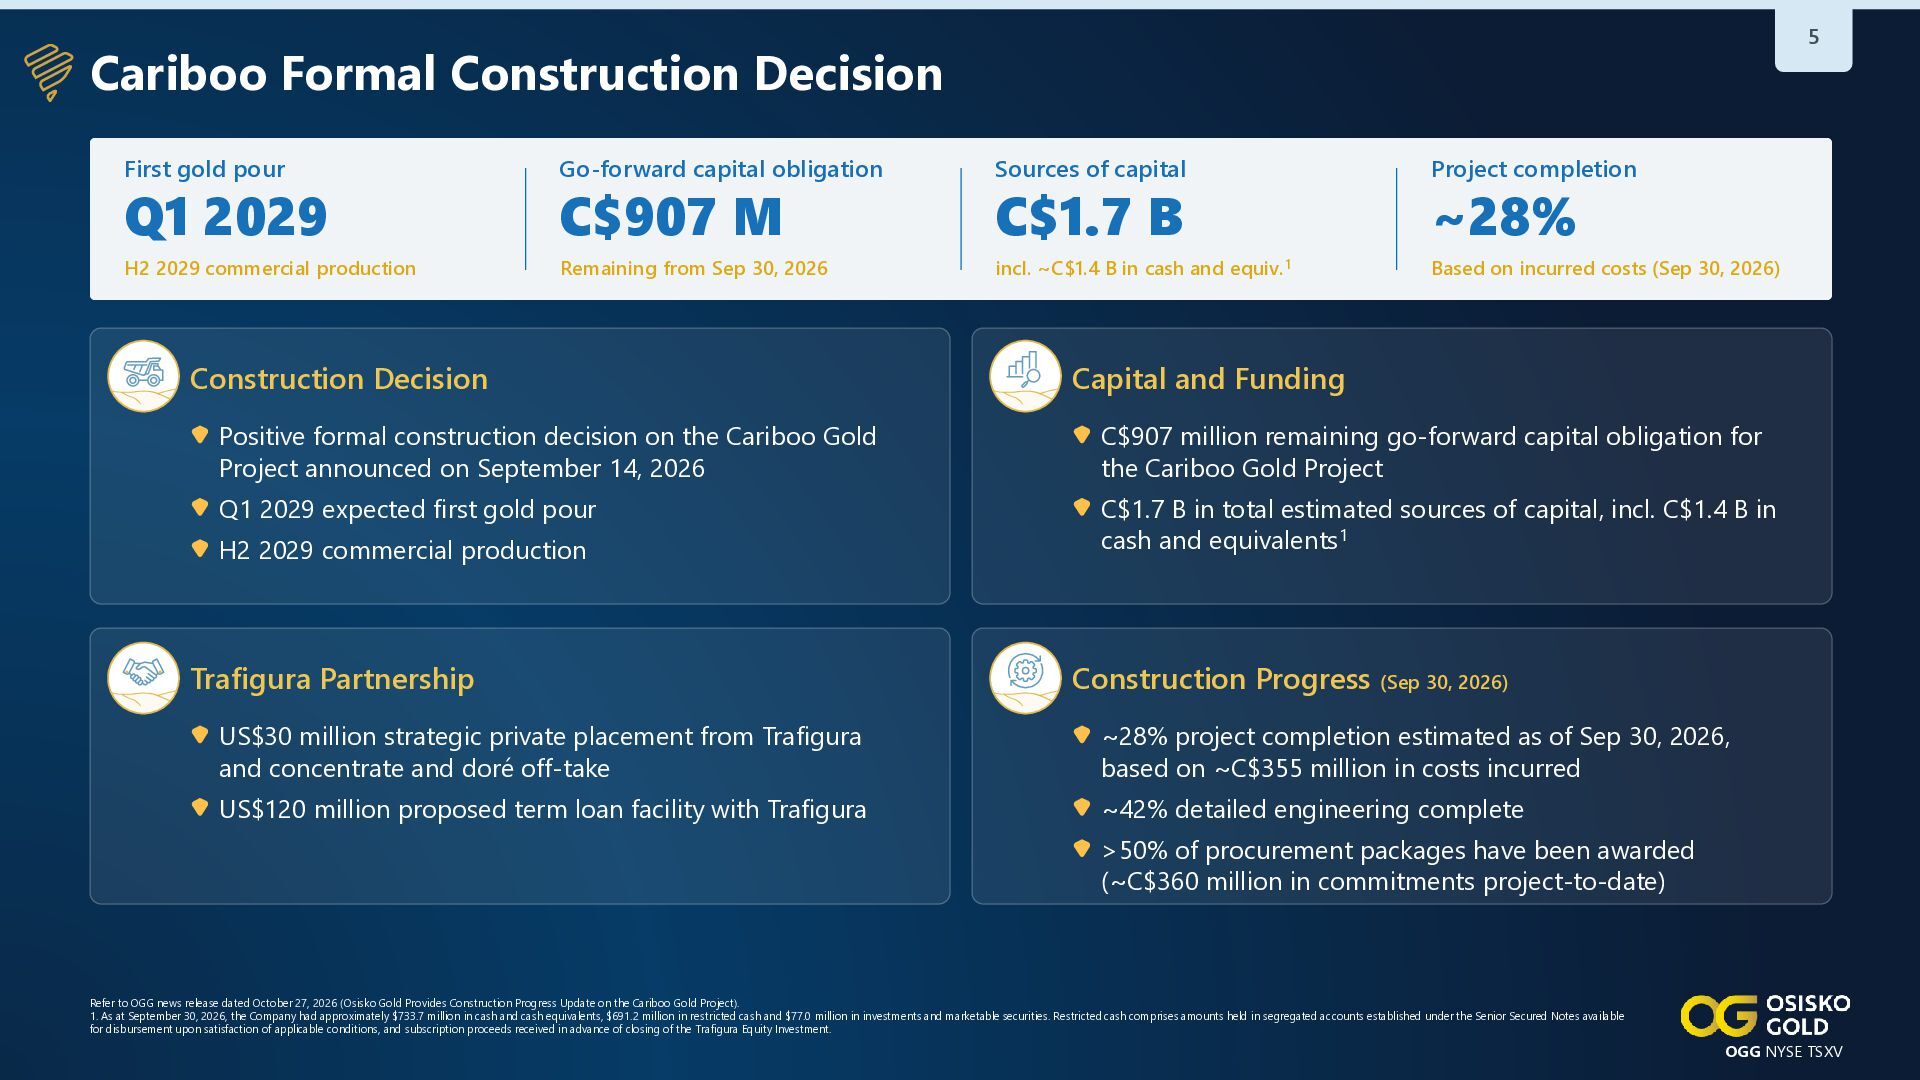
5 Cariboo Formal Construction Decision First gold pour Go-forward capital
obligation Sources of capital Project completion H2 2029 commercial production Remaining from Sep 30, 2026 incl. ~C$1.4 B in cash and equiv.1 Based on incurred costs (Sep 30, 2026) Q1 2029 1 C$907 M Construction Decision C$1.7 B 2 Capital and Funding Positive formal construction decision on the Cariboo Gold Project announced on September 14, 2026 C$907 million remaining go-forward capital obligation for the Cariboo Gold Project Q1 2029 expected first gold pour C$1.7 B in total estimated sources of capital, incl. C$1.4 B in cash and equivalents1 H2 2029 commercial production 3 ~28% Trafigura Partnership 4 Construction Progress (Sep 30, 2026) US$30 million strategic private placement from Trafigura and concentrate and doré off-take ~28% project completion estimated as of Sep 30, 2026, based on ~C$355 million in costs incurred US$120 million proposed term loan facility with Trafigura ~42% detailed engineering complete >50% of procurement packages have been awarded (~C$360 million in commitments project-to-date) Refer to OGG news release dated October 27, 2026 (Osisko Gold Provides Construction Progress Update on the Cariboo Gold Project). 1. As at September 30, 2026, the Company had approximately $733.7 million in cash and cash equivalents, $691.2 million in restricted cash and $77.0 million in investments and marketable securities. Restricted cash comprises amounts held in segregated accounts established under the Senior Secured Notes available for disbursement upon satisfaction of applicable conditions, and subscription proceeds received in advance of closing of the Trafigura Equity Investment. OGG NYSE TSXV -
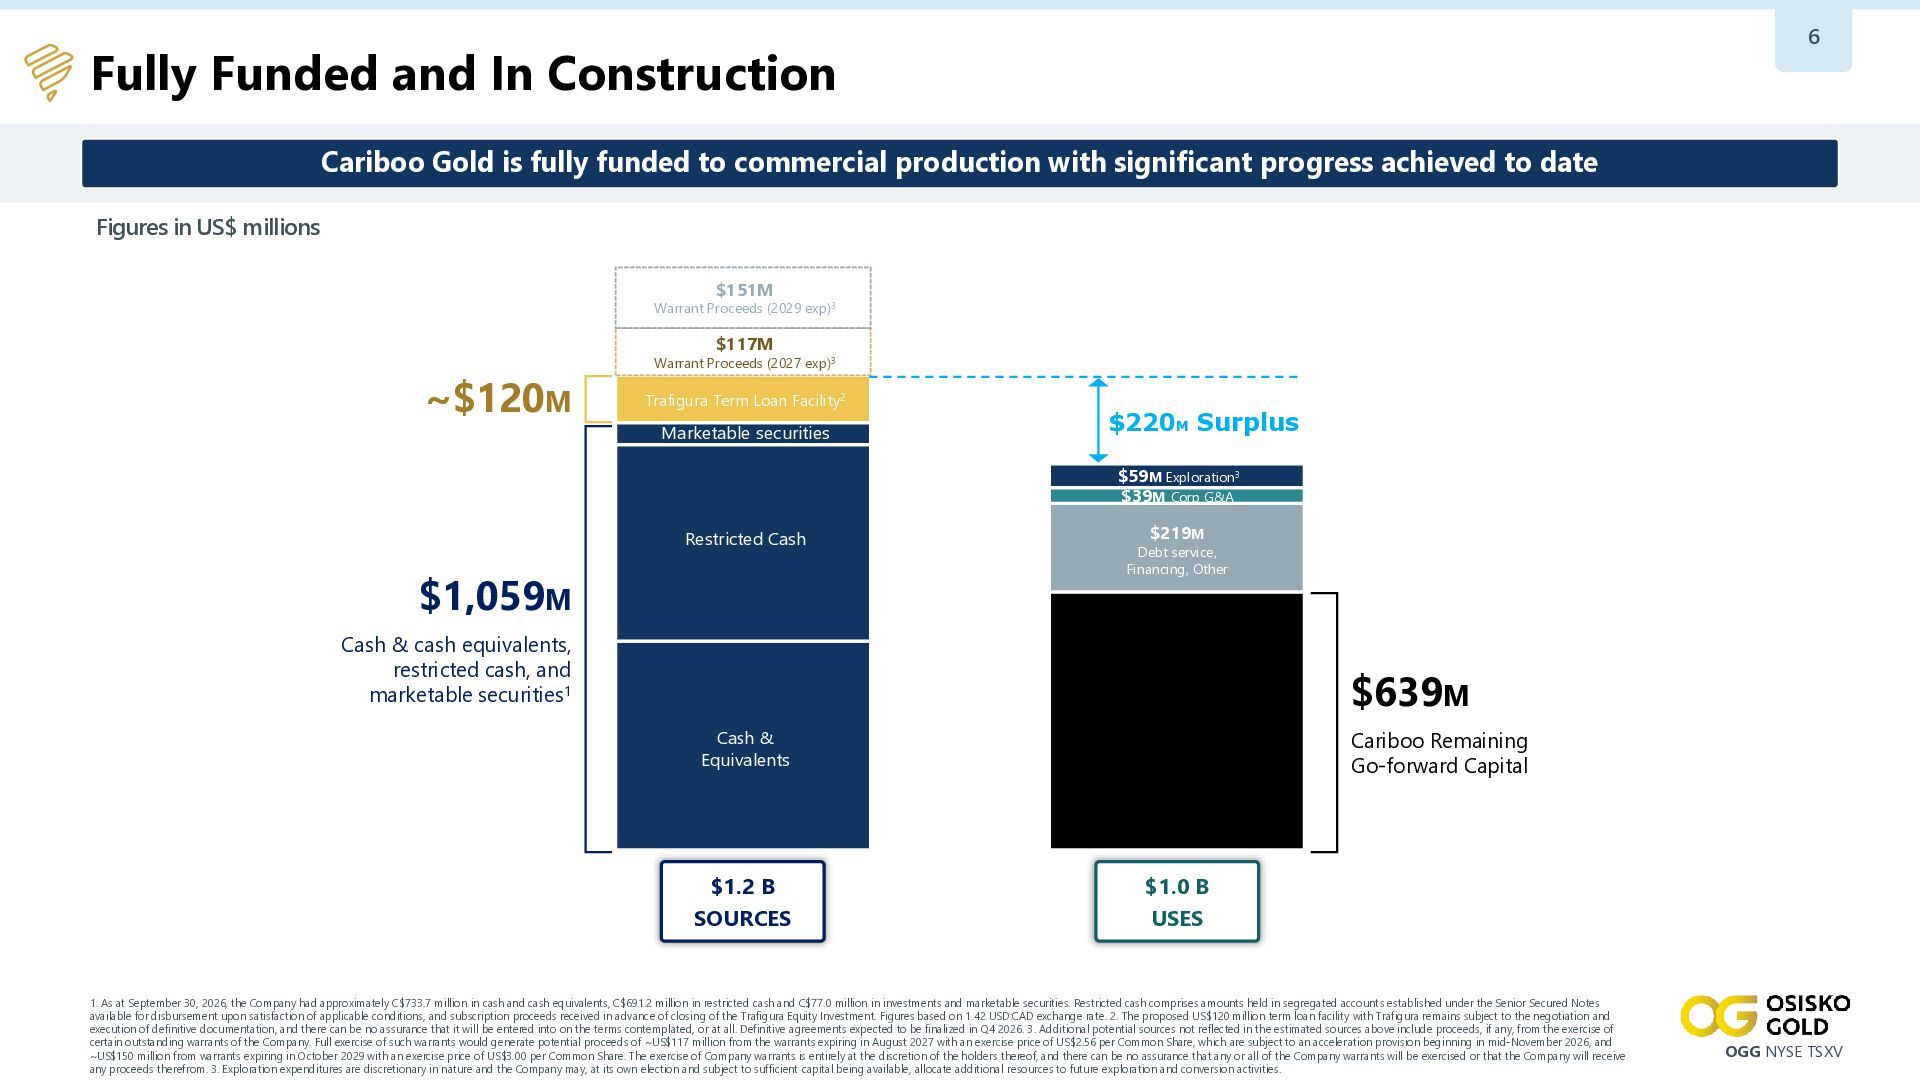
6 Fully Funded and In Construction Cariboo Gold is fully
funded to commercial production with significant progress achieved to date Figures in US$ millions $151M Warrant Proceeds (2029 exp)3 $117M ~$120M Warrant Proceeds (2027 exp)3 Trafigura Term Loan Facility2 Marketable securities $220M Surplus $59M Exploration3 $39M Corp G&A Restricted Cash $1,059M $219M Debt service, Financing, Other Cash & cash equivalents, restricted cash, and marketable securities1 $639M Cash & Equivalents Sources $1.2 B SOURCES Cariboo Remaining Go-forward Capital UsesB $1.0 USES 1. As at September 30, 2026, the Company had approximately C$733.7 million in cash and cash equivalents, C$691.2 million in restricted cash and C$77.0 million in investments and marketable securities. Restricted cash comprises amounts held in segregated accounts established under the Senior Secured Notes available for disbursement upon satisfaction of applicable conditions, and subscription proceeds received in advance of closing of the Trafigura Equity Investment. Figures based on 1.42 USD:CAD exchange rate. 2. The proposed US$120 million term loan facility with Trafigura remains subject to the negotiation and execution of definitive documentation, and there can be no assurance that it will be entered into on the terms contemplated, or at all. Definitive agreements expected to be finalized in Q4 2026. 3. Additional potential sources not reflected in the estimated sources above include proceeds, if any, from the exercise of certain outstanding warrants of the Company. Full exercise of such warrants would generate potential proceeds of ~US$117 million from the warrants expiring in August 2027 with an exercise price of US$2.56 per Common Share, which are subject to an acceleration provision beginning in mid-November 2026, and ~US$150 million from warrants expiring in October 2029 with an exercise price of US$3.00 per Common Share. The exercise of Company warrants is entirely at the discretion of the holders thereof, and there can be no assurance that any or all of the Company warrants will be exercised or that the Company will receive any proceeds therefrom. 3. Exploration expenditures are discretionary in nature and the Company may, at its own election and subject to sufficient capital being available, allocate additional resources to future exploration and conversion activities. OGG NYSE TSXV -
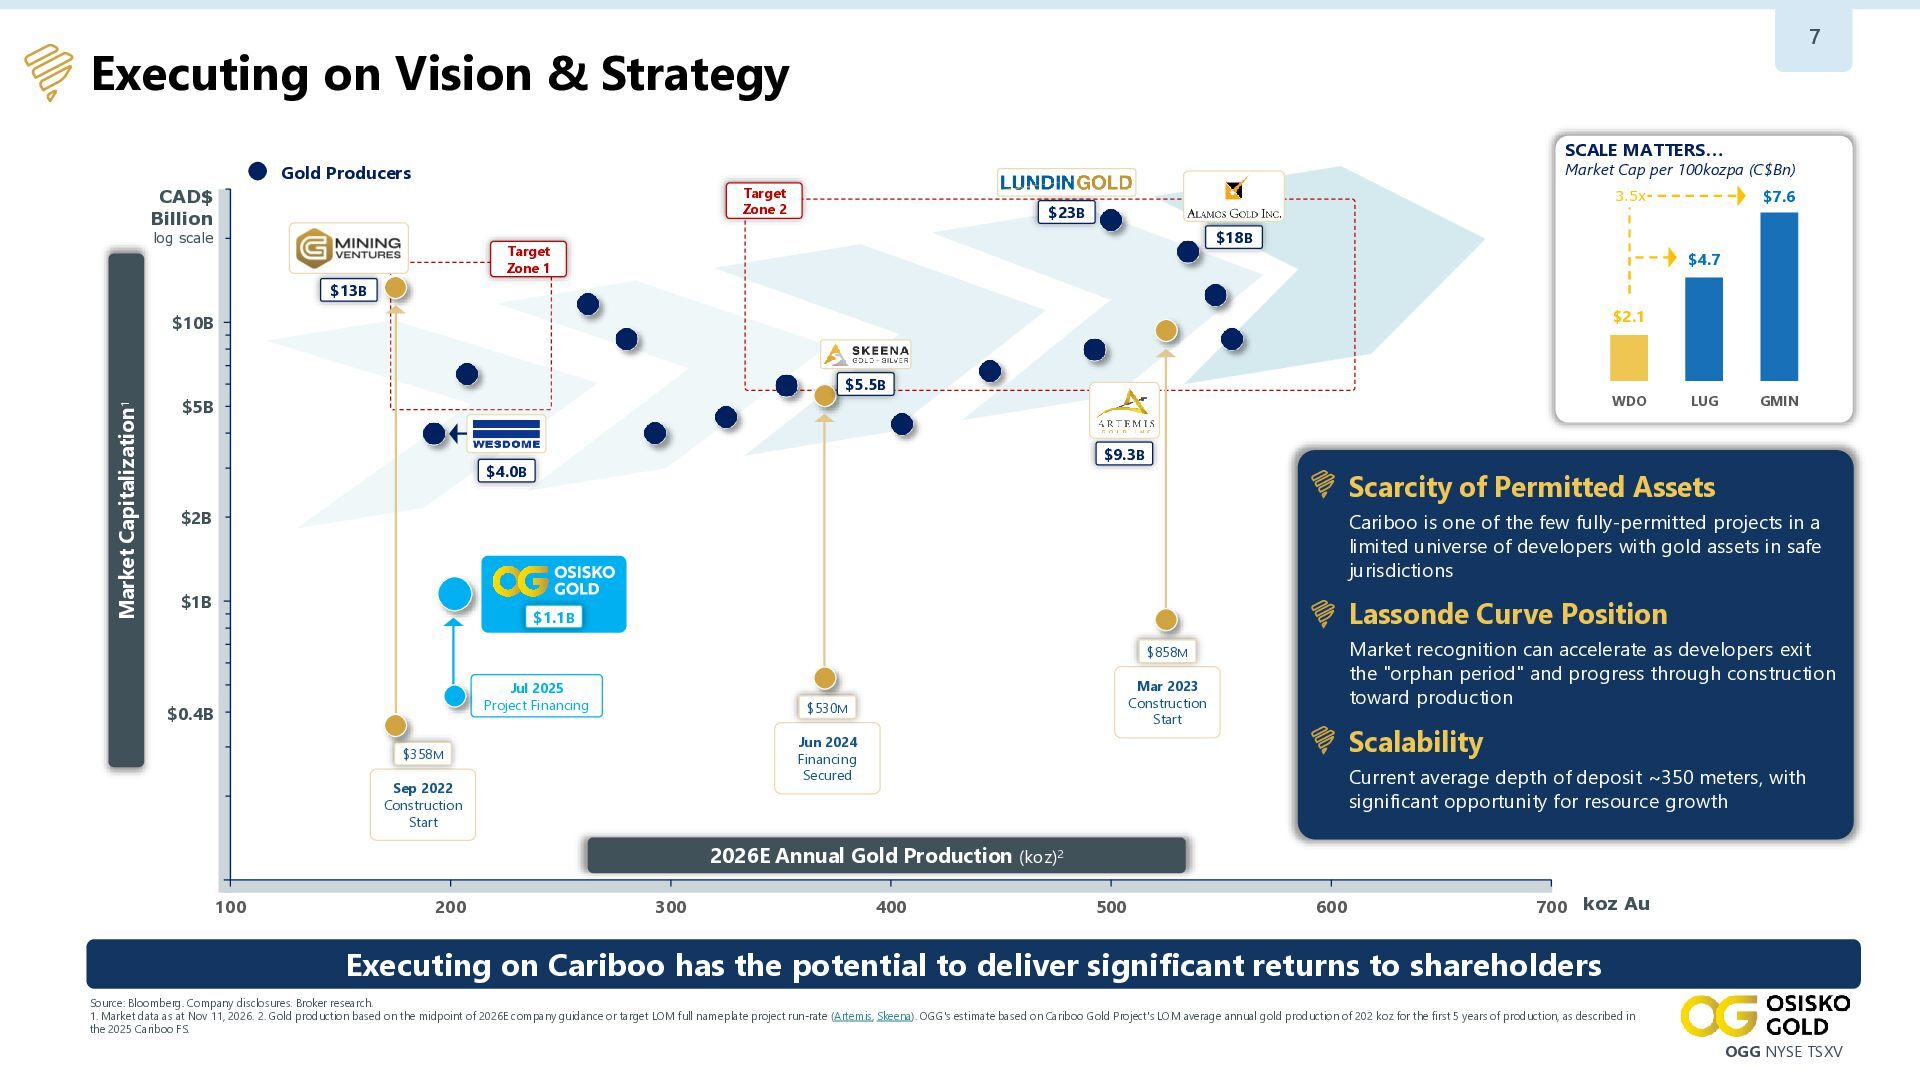
7 Executing on Vision & Strategy SCALE MATTERS… Market Cap
per 100kozpa (C$Bn) Gold Producers Target Zone 2 CAD$ Billion log scale $7.6 3.5x $23B $18B Target Zone 1 $4.7 $13B $2.1 $10B Market Capitalization1 $5.5B WDO $5B LUG GMIN $9.3B $4.0B Scarcity of Permitted Assets $2B Cariboo is one of the few fully-permitted projects in a limited universe of developers with gold assets in safe jurisdictions $1B Lassonde Curve Position $1.1B Market recognition can accelerate as developers exit the "orphan period" and progress through construction toward production $858M Jul 2025 Project Financing $0.4B Mar 2023 Construction Start $530M Scalability Jun 2024 Financing Secured $358M Sep 2022 Construction Start Current average depth of deposit ~350 meters, with significant opportunity for resource growth 2026E Annual Gold Production (koz)2 100 200 300 400 500 600 700 koz Au Executing on Cariboo has the potential to deliver significant returns to shareholders Source: Bloomberg. Company disclosures. Broker research. 1. Market data as at Nov 11, 2026. 2. Gold production based on the midpoint of 2026E company guidance or target LOM full nameplate project run-rate (Artemis, Skeena). OGG's estimate based on Cariboo Gold Project's LOM average annual gold production of 202 koz for the first 5 years of production, as described in the 2025 Cariboo FS. OGG NYSE TSXV -
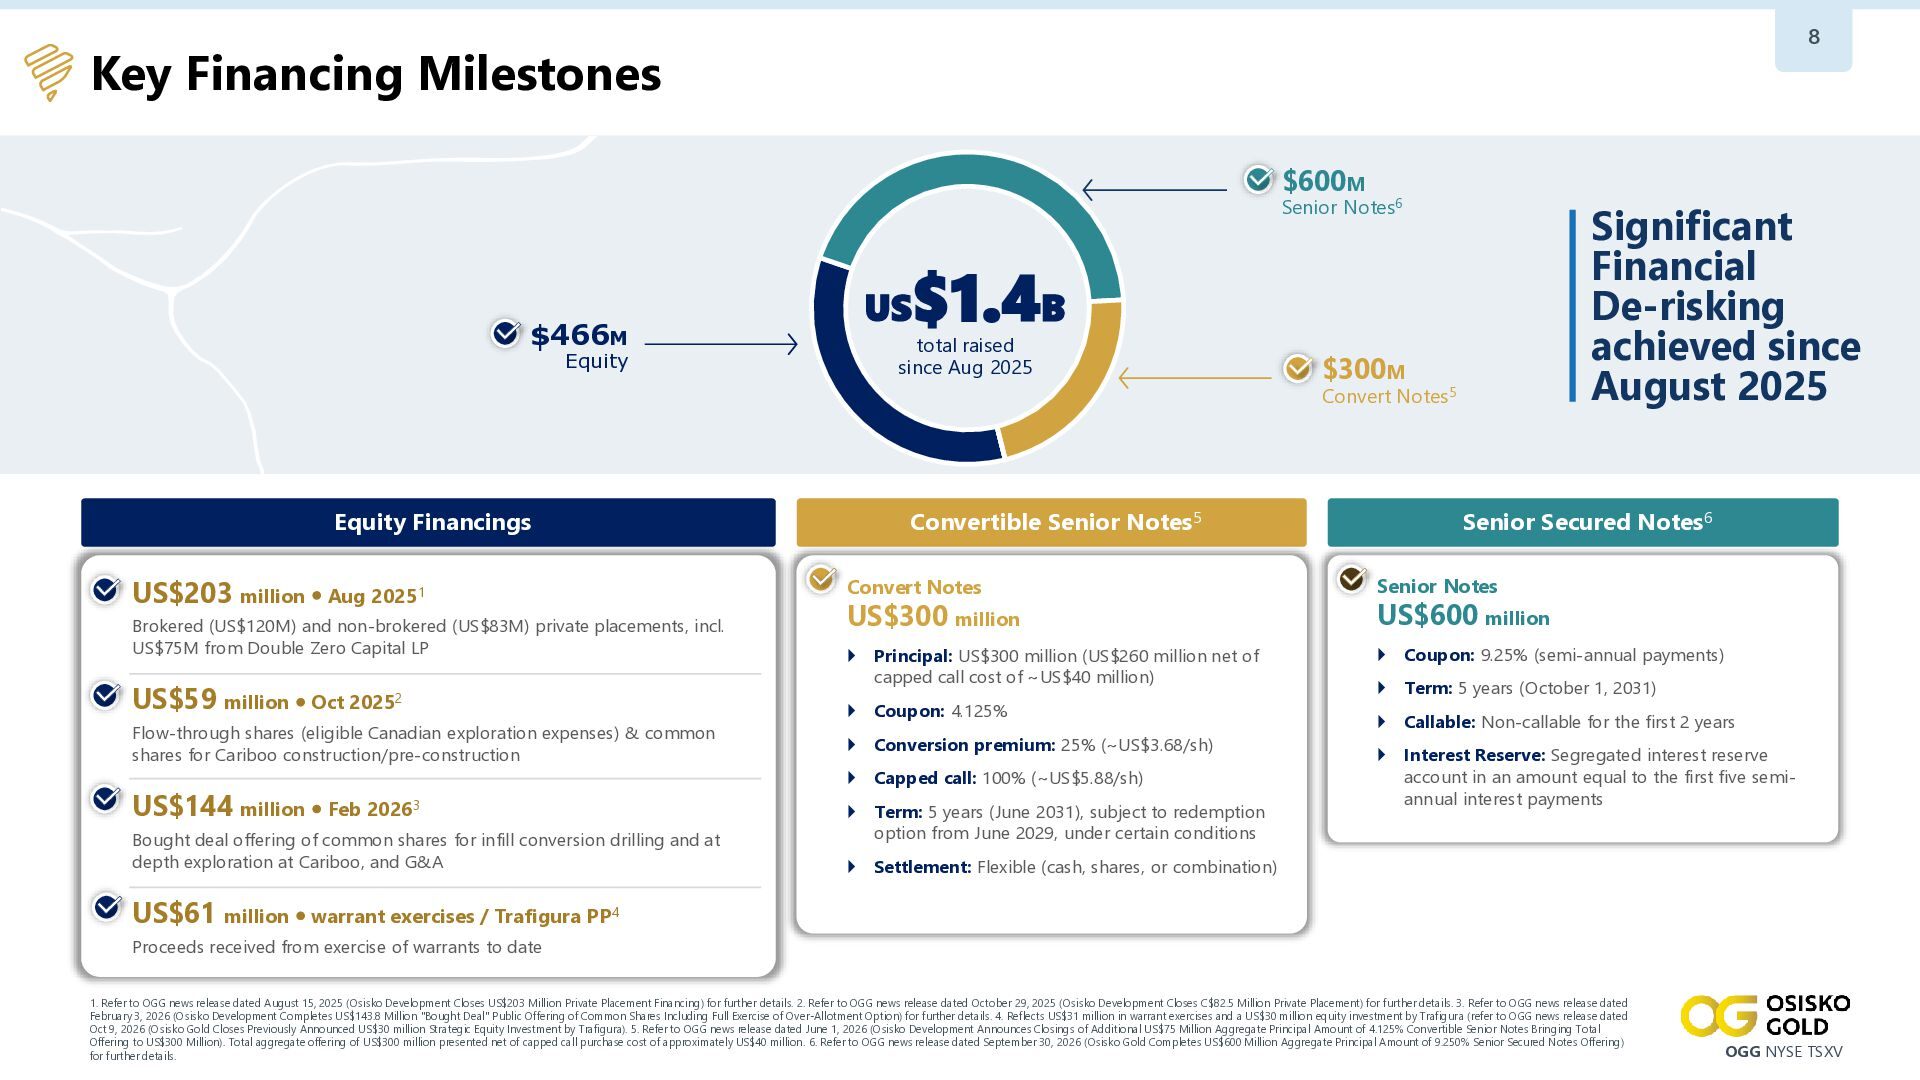
8 Key Financing Milestones $600M Senior Notes6 $466M Equity US
Significant Financial De-risking achieved since August 2025 $1.4B total raised since Aug 2025 $300M Convert Notes5 Equity Financings US$203 million Aug 20251 Brokered (US$120M) and non-brokered (US$83M) private placements, incl. US$75M from Double Zero Capital LP US$59 million Oct 20252 Flow-through shares (eligible Canadian exploration expenses) & common shares for Cariboo construction/pre-construction US$144 million Feb 20263 Bought deal offering of common shares for infill conversion drilling and at depth exploration at Cariboo, and G&A Convertible Senior Notes5 Senior Secured Notes6 Convert Notes Senior Notes Principal: US$300 million (US$260 million net of capped call cost of ~US$40 million) Coupon: 9.25% (semi-annual payments) US$300 million Coupon: 4.125% Conversion premium: 25% (~US$3.68/sh) Capped call: 100% (~US$5.88/sh) Term: 5 years (June 2031), subject to redemption option from June 2029, under certain conditions US$600 million Term: 5 years (October 1, 2031) Callable: Non-callable for the first 2 years Interest Reserve: Segregated interest reserve account in an amount equal to the first five semiannual interest payments Settlement: Flexible (cash, shares, or combination) US$61 million warrant exercises / Trafigura PP4 Proceeds received from exercise of warrants to date 1. Refer to OGG news release dated August 15, 2025 (Osisko Development Closes US$203 Million Private Placement Financing) for further details. 2. Refer to OGG news release dated October 29, 2025 (Osisko Development Closes C$82.5 Million Private Placement) for further details. 3. Refer to OGG news release dated February 3, 2026 (Osisko Development Completes US$143.8 Million "Bought Deal" Public Offering of Common Shares Including Full Exercise of Over-Allotment Option) for further details. 4. Reflects US$31 million in warrant exercises and a US$30 million equity investment by Trafigura (refer to OGG news release dated Oct 9, 2026 (Osisko Gold Closes Previously Announced US$30 million Strategic Equity Investment by Trafigura). 5. Refer to OGG news release dated June 1, 2026 (Osisko Development Announces Closings of Additional US$75 Million Aggregate Principal Amount of 4.125% Convertible Senior Notes Bringing Total Offering to US$300 Million). Total aggregate offering of US$300 million presented net of capped call purchase cost of approximately US$40 million. 6. Refer to OGG news release dated September 30, 2026 (Osisko Gold Completes US$600 Million Aggregate Principal Amount of 9.250% Senior Secured Notes Offering) for further details. OGG NYSE TSXV -
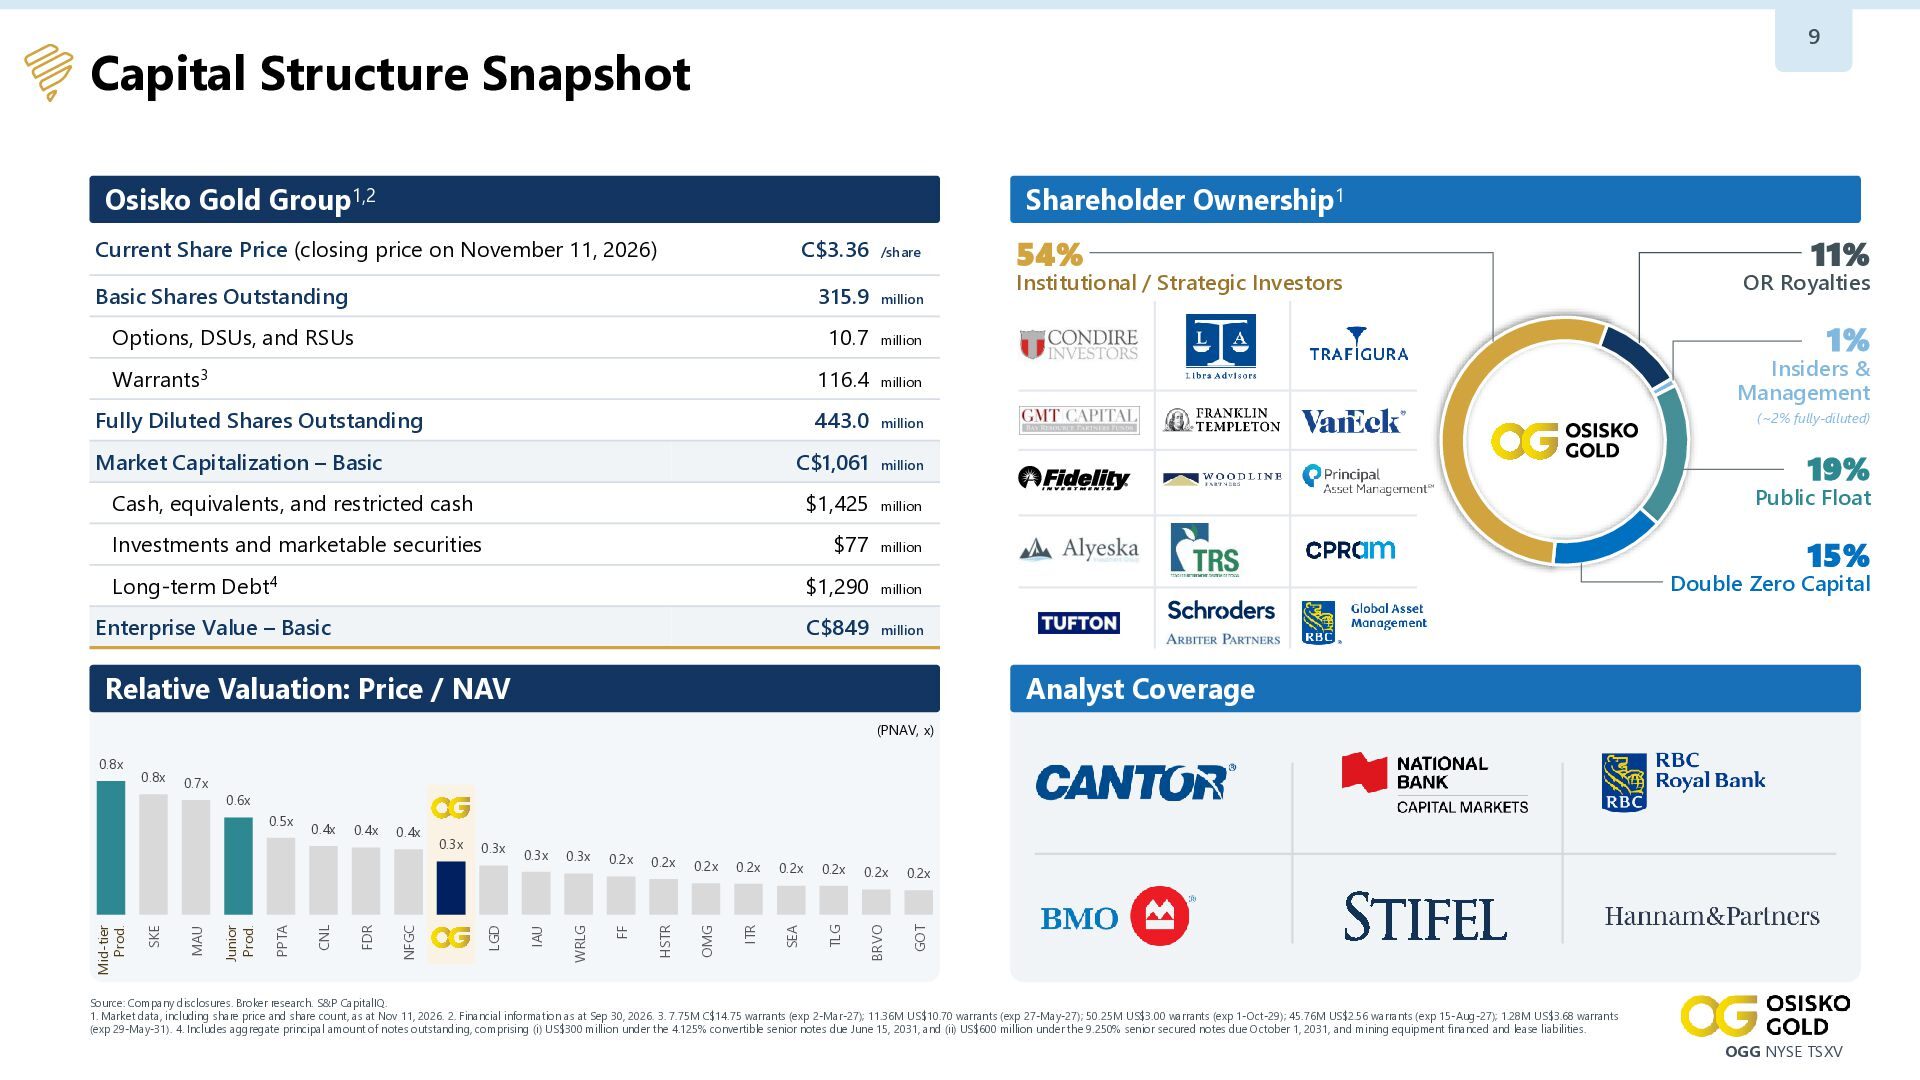
9 Capital Structure Snapshot Osisko Gold Group1,2 Shareholder Ownership1 Current
Share Price (closing price on November 11, 2026) C$3.36 /share Basic Shares Outstanding 315.9 million Options, DSUs, and RSUs 10.7 million Warrants3 54% Institutional / Strategic Investors 1% Insiders & Management 116.4 million Fully Diluted Shares Outstanding 443.0 million Market Capitalization – Basic (~2% fully-diluted) 19% C$1,061 million Cash, equivalents, and restricted cash $1,425 million Investments and marketable securities $77 million Long-term Debt4 Public Float 15% Double Zero Capital $1,290 million Enterprise Value – Basic 11% OR Royalties C$849 million Relative Valuation: Price / NAV Analyst Coverage (PNAV, x) 0.3x 0.2x 0.2x 0.2x 0.2x 0.2x 0.2x 0.2x 0.2x SEA TLG BRVO GOT 0.3x ITR 0.3x OMG 0.3x HSTR 0.4x FF 0.4x IAU 0.4x LGD PPTA Junior Prod. MAU SKE Mid-tier Prod. 0.5x WRLG 0.6x NFGC 0.7x FDR 0.8x CNL 0.8x Source: Company disclosures. Broker research. S&P CapitalIQ. 1. Market data, including share price and share count, as at Nov 11, 2026. 2. Financial information as at Sep 30, 2026. 3. 7.75M C$14.75 warrants (exp 2-Mar-27); 11.36M US$10.70 warrants (exp 27-May-27); 50.25M US$3.00 warrants (exp 1-Oct-29); 45.76M US$2.56 warrants (exp 15-Aug-27); 1.28M US$3.68 warrants (exp 29-May-31). 4. Includes aggregate principal amount of notes outstanding, comprising (i) US$300 million under the 4.125% convertible senior notes due June 15, 2031, and (ii) US$600 million under the 9.250% senior secured notes due October 1, 2031, and mining equipment financed and lease liabilities. OGG NYSE TSXV -
10 Cariboo Gold Project British Columbia, Canada 100% Ownership WATCH
VIDEO VIRTUAL TOUR VIRTUAL TOUR OGG NYSE TSXV | osiskogold.ca WATCH VIDEO -
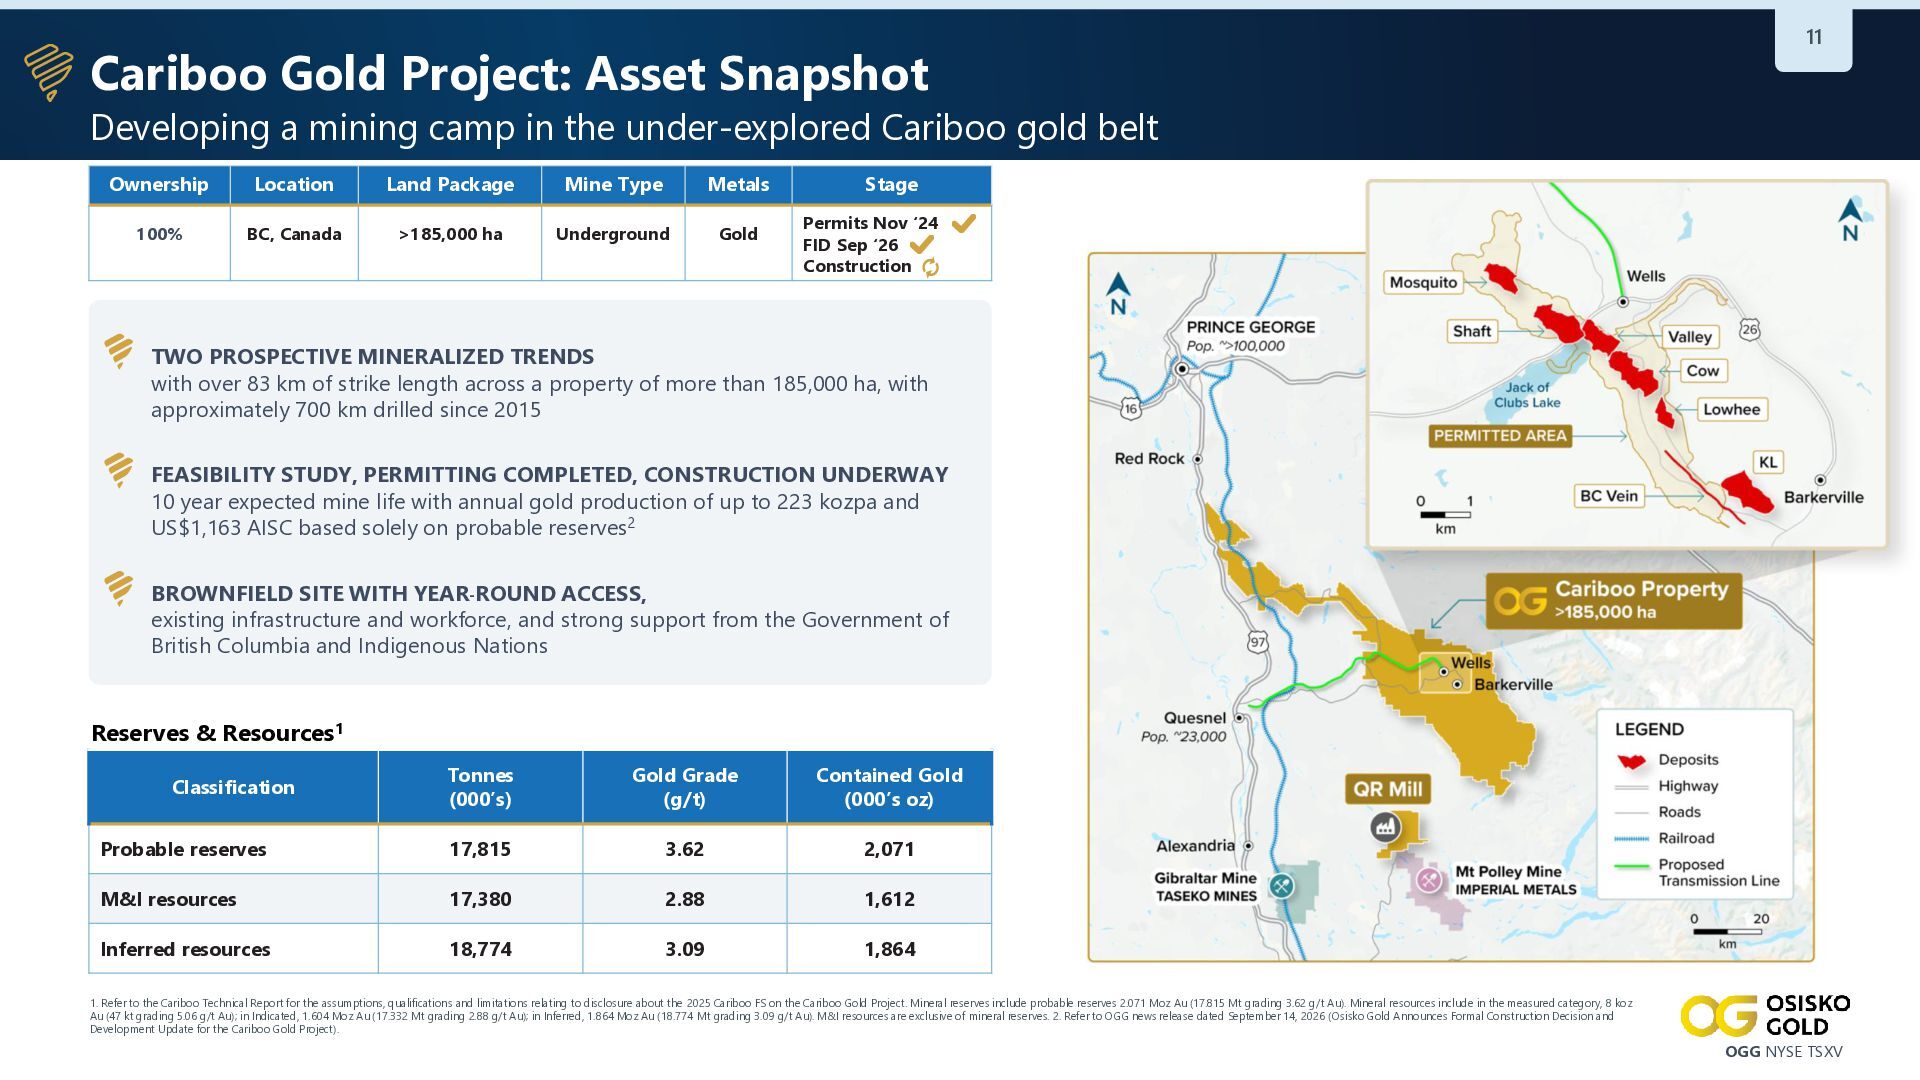
Cariboo Gold Project: Asset Snapshot 11 Developing a mining camp
in the under-explored Cariboo gold belt Ownership Location Land Package Mine Type Metals 100% BC, Canada >185,000 ha Underground Gold Stage Permits Nov ‘24 FID Sep ‘26 Construction TWO PROSPECTIVE MINERALIZED TRENDS with over 83 km of strike length across a property of more than 185,000 ha, with approximately 700 km drilled since 2015 FEASIBILITY STUDY, PERMITTING COMPLETED, CONSTRUCTION UNDERWAY 10 year expected mine life with annual gold production of up to 223 kozpa and US$1,163 AISC based solely on probable reserves2 BROWNFIELD SITE WITH YEAR-ROUND ACCESS, existing infrastructure and workforce, and strong support from the Government of British Columbia and Indigenous Nations Reserves & Resources1 Tonnes (000’s) Gold Grade (g/t) Contained Gold (000’s oz) Probable reserves 17,815 3.62 2,071 M&I resources 17,380 2.88 1,612 Inferred resources 18,774 3.09 1,864 Classification 1. Refer to the Cariboo Technical Report for the assumptions, qualifications and limitations relating to disclosure about the 2025 Cariboo FS on the Cariboo Gold Project. Mineral reserves include probable reserves 2.071 Moz Au (17.815 Mt grading 3.62 g/t Au). Mineral resources include in the measured category, 8 koz Au (47 kt grading 5.06 g/t Au); in Indicated, 1.604 Moz Au (17.332 Mt grading 2.88 g/t Au); in Inferred, 1.864 Moz Au (18.774 Mt grading 3.09 g/t Au). M&I resources are exclusive of mineral reserves. 2. Refer to OGG news release dated September 14, 2026 (Osisko Gold Announces Formal Construction Decision and Development Update for the Cariboo Gold Project). OGG NYSE TSXV -
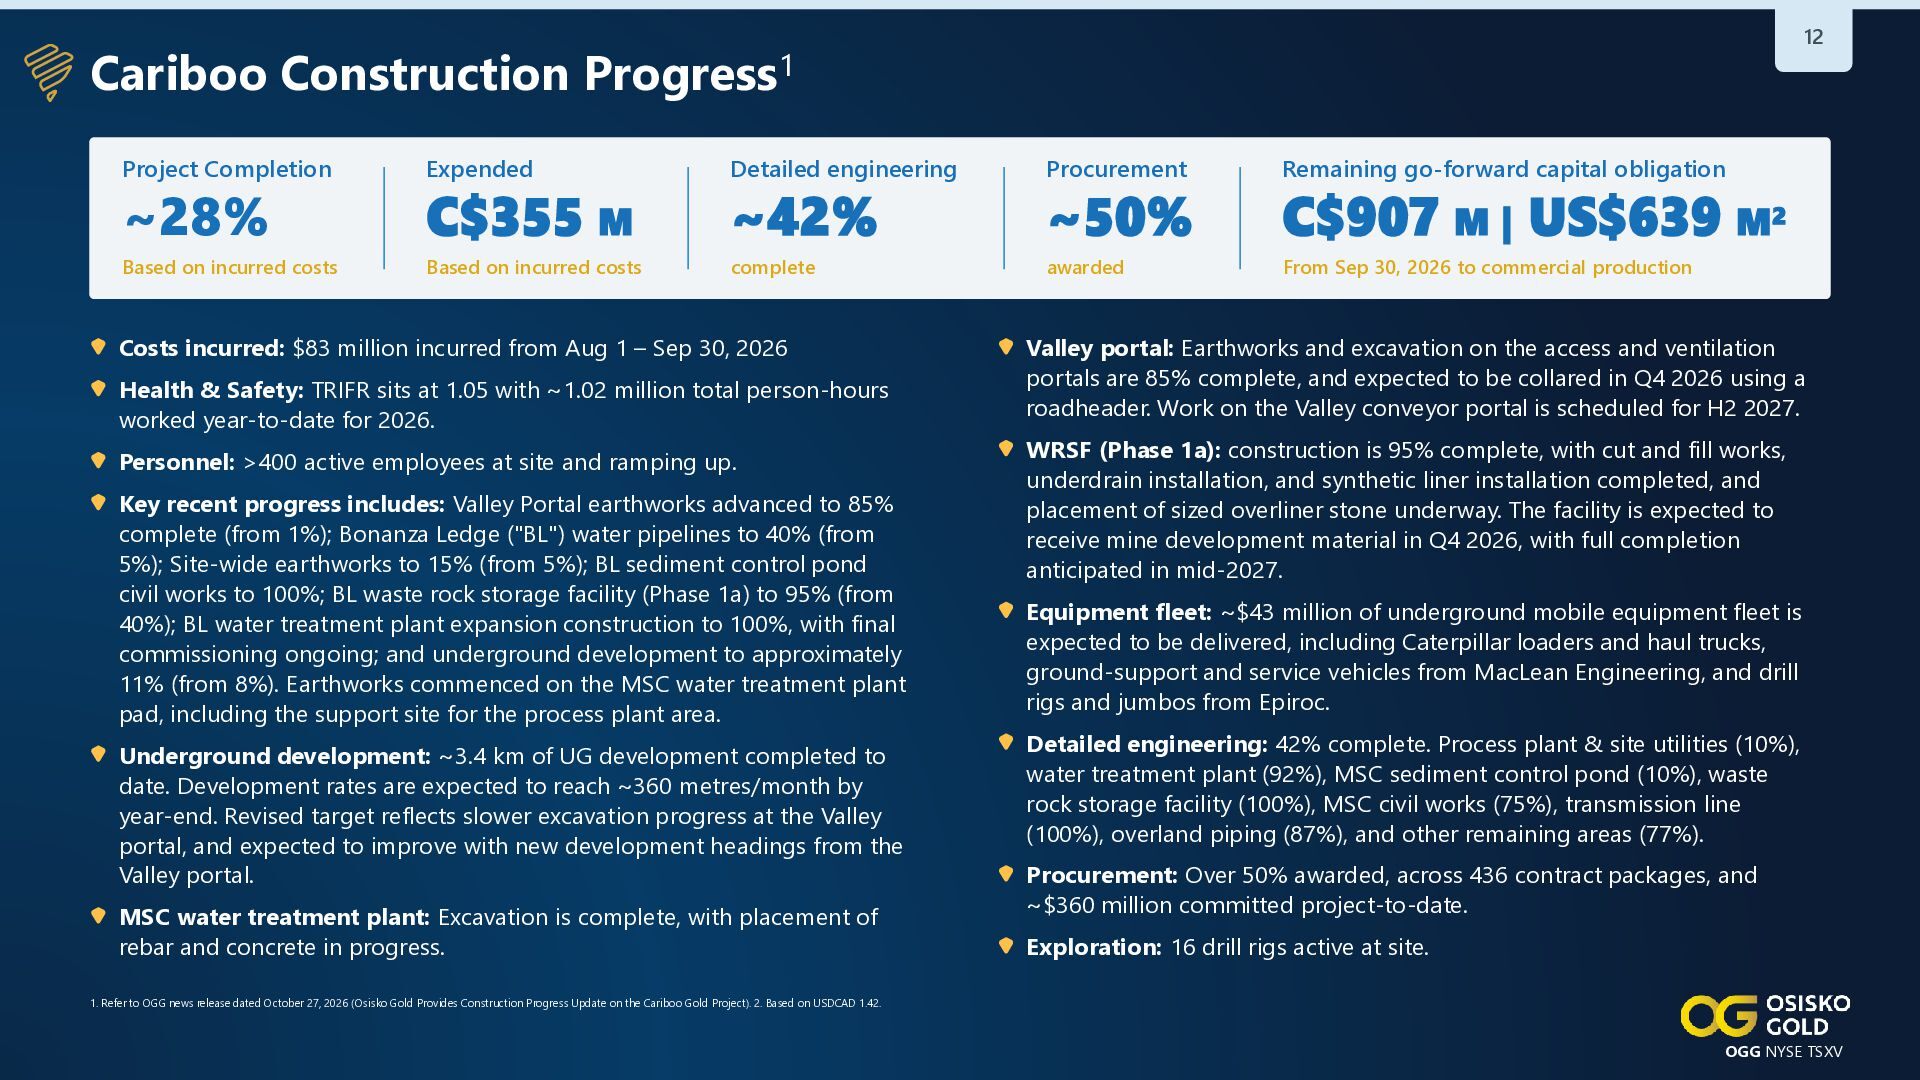
12 Cariboo Construction Progress1 Project Completion Expended Detailed engineering Procurement
Remaining go-forward capital obligation Based on incurred costs Based on incurred costs complete awarded From Sep 30, 2026 to commercial production ~28% C$355 M ~42% Costs incurred: $83 million incurred from Aug 1 – Sep 30, 2026 Health & Safety: TRIFR sits at 1.05 with ~1.02 million total person-hours worked year-to-date for 2026. Personnel: >400 active employees at site and ramping up. Key recent progress includes: Valley Portal earthworks advanced to 85% complete (from 1%); Bonanza Ledge ("BL") water pipelines to 40% (from 5%); Site-wide earthworks to 15% (from 5%); BL sediment control pond civil works to 100%; BL waste rock storage facility (Phase 1a) to 95% (from 40%); BL water treatment plant expansion construction to 100%, with final commissioning ongoing; and underground development to approximately 11% (from 8%). Earthworks commenced on the MSC water treatment plant pad, including the support site for the process plant area. Underground development: ~3.4 km of UG development completed to date. Development rates are expected to reach ~360 metres/month by year-end. Revised target reflects slower excavation progress at the Valley portal, and expected to improve with new development headings from the Valley portal. MSC water treatment plant: Excavation is complete, with placement of rebar and concrete in progress. ~50% C$907 M | US$639 M2 Valley portal: Earthworks and excavation on the access and ventilation portals are 85% complete, and expected to be collared in Q4 2026 using a roadheader. Work on the Valley conveyor portal is scheduled for H2 2027. WRSF (Phase 1a): construction is 95% complete, with cut and fill works, underdrain installation, and synthetic liner installation completed, and placement of sized overliner stone underway. The facility is expected to receive mine development material in Q4 2026, with full completion anticipated in mid-2027. Equipment fleet: ~$43 million of underground mobile equipment fleet is expected to be delivered, including Caterpillar loaders and haul trucks, ground-support and service vehicles from MacLean Engineering, and drill rigs and jumbos from Epiroc. Detailed engineering: 42% complete. Process plant & site utilities (10%), water treatment plant (92%), MSC sediment control pond (10%), waste rock storage facility (100%), MSC civil works (75%), transmission line (100%), overland piping (87%), and other remaining areas (77%). Procurement: Over 50% awarded, across 436 contract packages, and ~$360 million committed project-to-date. Exploration: 16 drill rigs active at site. 1. Refer to OGG news release dated October 27, 2026 (Osisko Gold Provides Construction Progress Update on the Cariboo Gold Project). 2. Based on USDCAD 1.42. OGG NYSE TSXV -
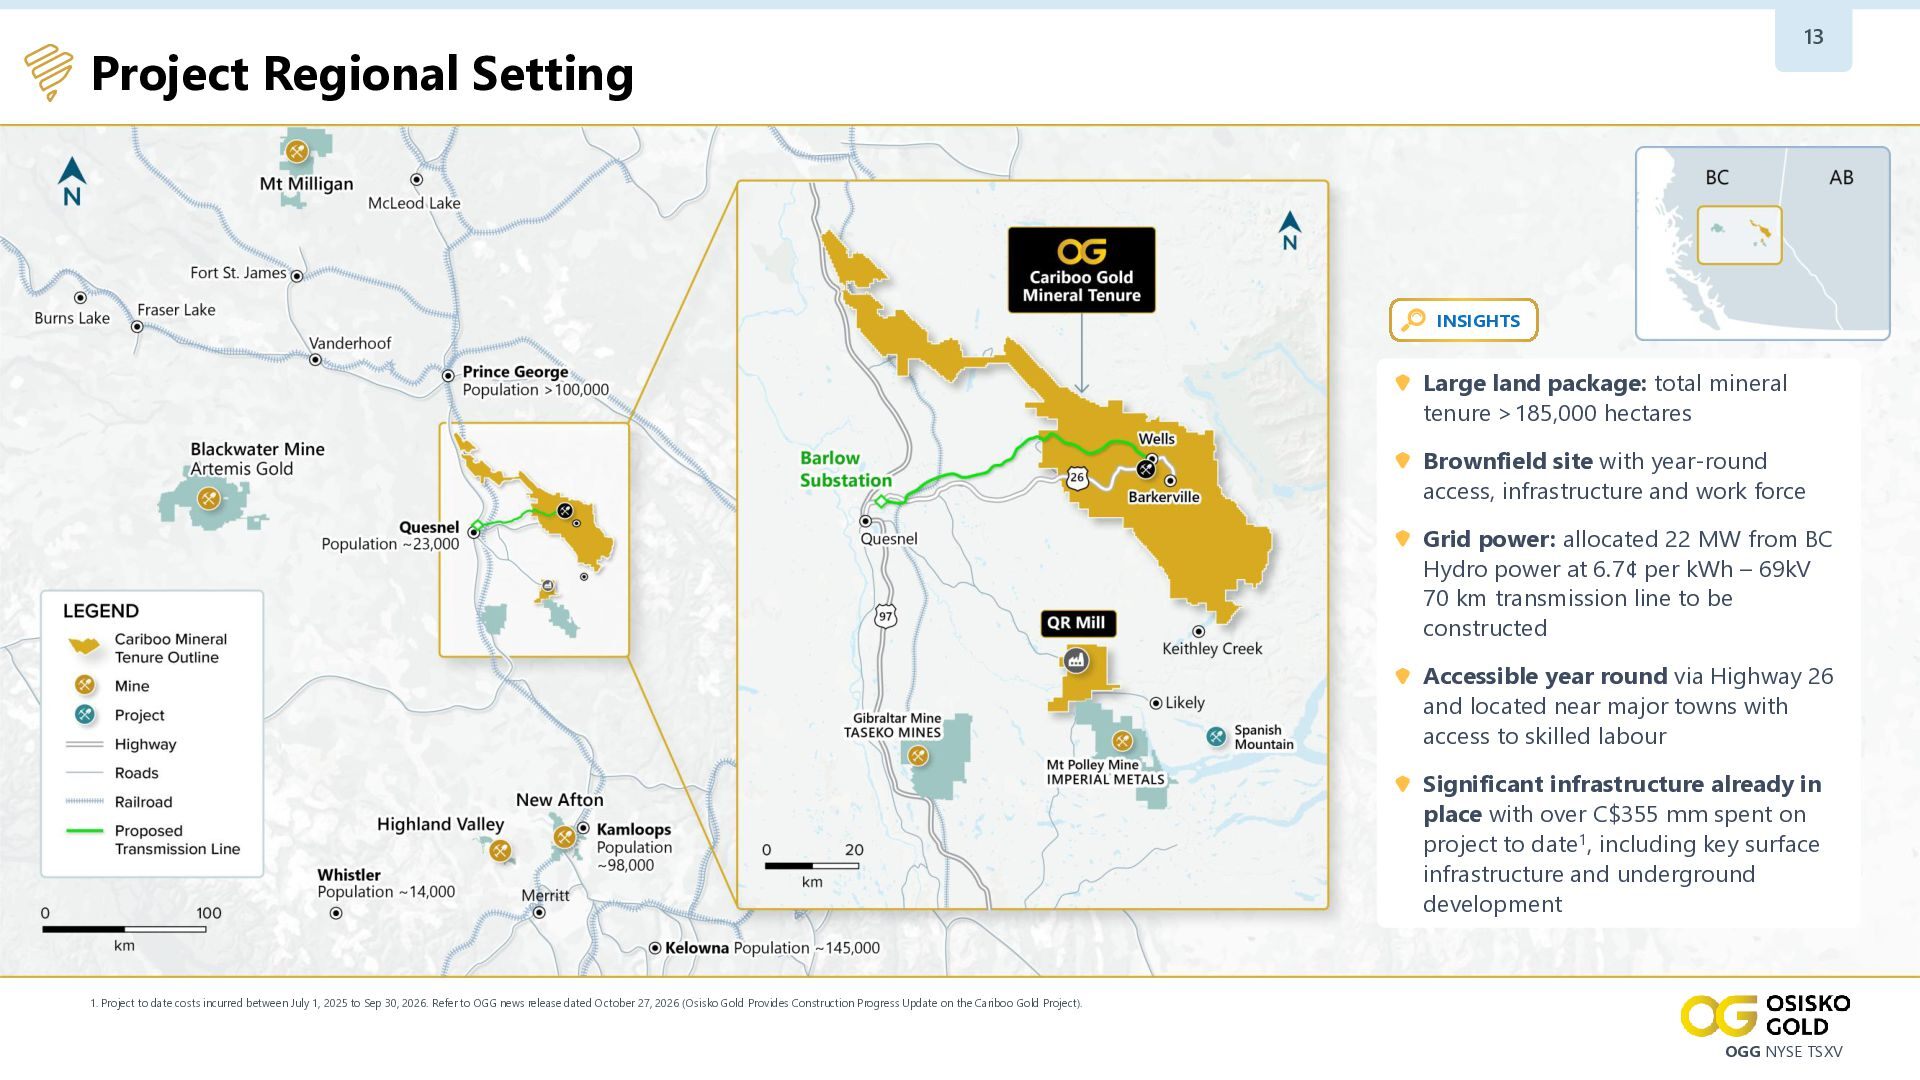
13 Project Regional Setting INSIGHTS Large land package: total mineral
tenure >185,000 hectares Brownfield site with year-round access, infrastructure and work force Grid power: allocated 22 MW from BC Hydro power at 6.7¢ per kWh – 69kV 70 km transmission line to be constructed Accessible year round via Highway 26 and located near major towns with access to skilled labour Significant infrastructure already in place with over C$355 mm spent on project to date1, including key surface infrastructure and underground development 1. Project to date costs incurred between July 1, 2025 to Sep 30, 2026. Refer to OGG news release dated October 27, 2026 (Osisko Gold Provides Construction Progress Update on the Cariboo Gold Project). OGG NYSE TSXV -
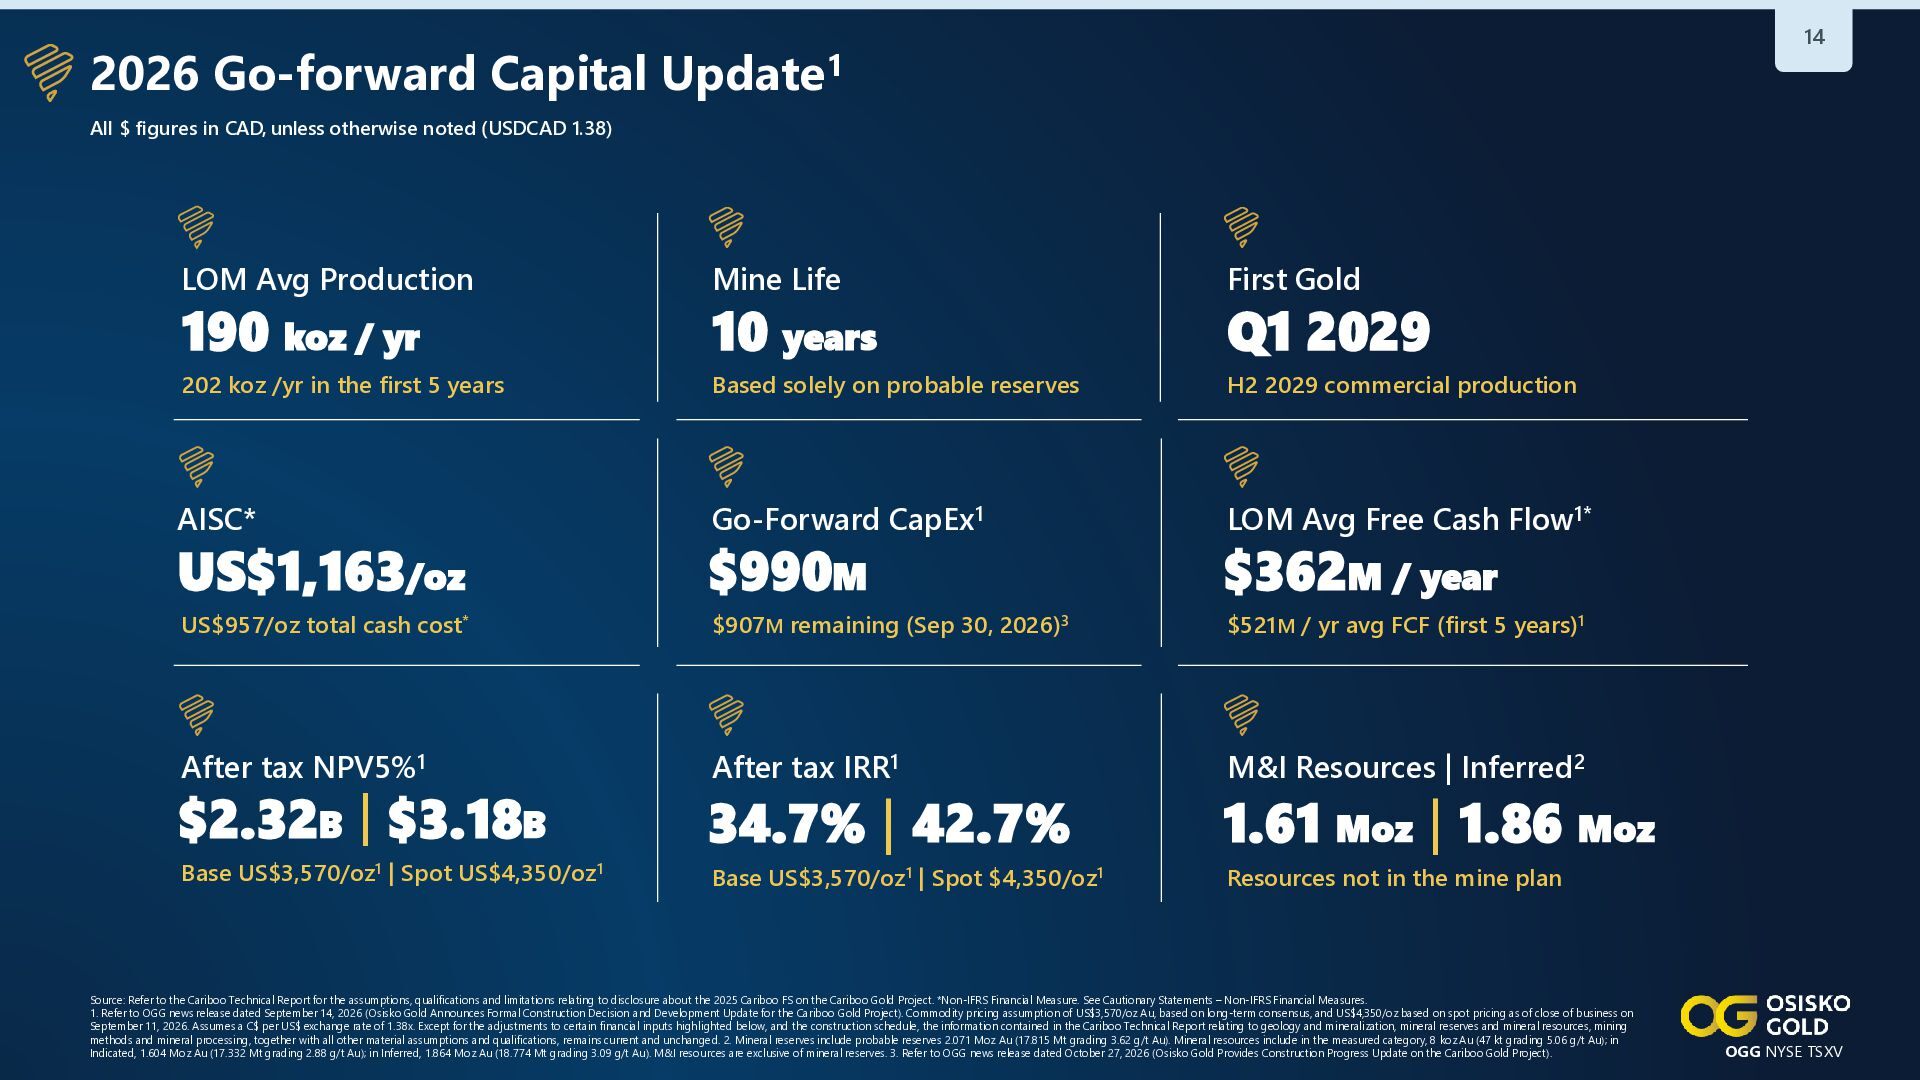
14 2026 Go-forward Capital Update1 All $ figures in CAD,
unless otherwise noted (USDCAD 1.38) LOM Avg Production Mine Life First Gold 202 koz /yr in the first 5 years Based solely on probable reserves H2 2029 commercial production AISC* Go-Forward CapEx1 LOM Avg Free Cash Flow1* 190 koz / yr 10 years Q1 2029 US$1,163/oz $990M $362M / year US$957/oz total cash cost* $907M remaining (Sep 30, 2026)3 $521M / yr avg FCF (first 5 years)1 After tax NPV5%1 After tax IRR1 M&I Resources | Inferred2 $2.32B | $3.18B 34.7% | 42.7% 1.61 Moz | 1.86 Moz Base US$3,570/oz1 | Spot US$4,350/oz1 Base US$3,570/oz1 | Spot $4,350/oz1 Resources not in the mine plan Source: Refer to the Cariboo Technical Report for the assumptions, qualifications and limitations relating to disclosure about the 2025 Cariboo FS on the Cariboo Gold Project. *Non-IFRS Financial Measure. See Cautionary Statements – Non-IFRS Financial Measures. 1. Refer to OGG news release dated September 14, 2026 (Osisko Gold Announces Formal Construction Decision and Development Update for the Cariboo Gold Project). Commodity pricing assumption of US$3,570/oz Au, based on long-term consensus, and US$4,350/oz based on spot pricing as of close of business on September 11, 2026. Assumes a C$ per US$ exchange rate of 1.38x. Except for the adjustments to certain financial inputs highlighted below, and the construction schedule, the information contained in the Cariboo Technical Report relating to geology and mineralization, mineral reserves and mineral resources, mining methods and mineral processing, together with all other material assumptions and qualifications, remains current and unchanged. 2. Mineral reserves include probable reserves 2.071 Moz Au (17.815 Mt grading 3.62 g/t Au). Mineral resources include in the measured category, 8 koz Au (47 kt grading 5.06 g/t Au); in Indicated, 1.604 Moz Au (17.332 Mt grading 2.88 g/t Au); in Inferred, 1.864 Moz Au (18.774 Mt grading 3.09 g/t Au). M&I resources are exclusive of mineral reserves. 3. Refer to OGG news release dated October 27, 2026 (Osisko Gold Provides Construction Progress Update on the Cariboo Gold Project). OGG NYSE TSXV -
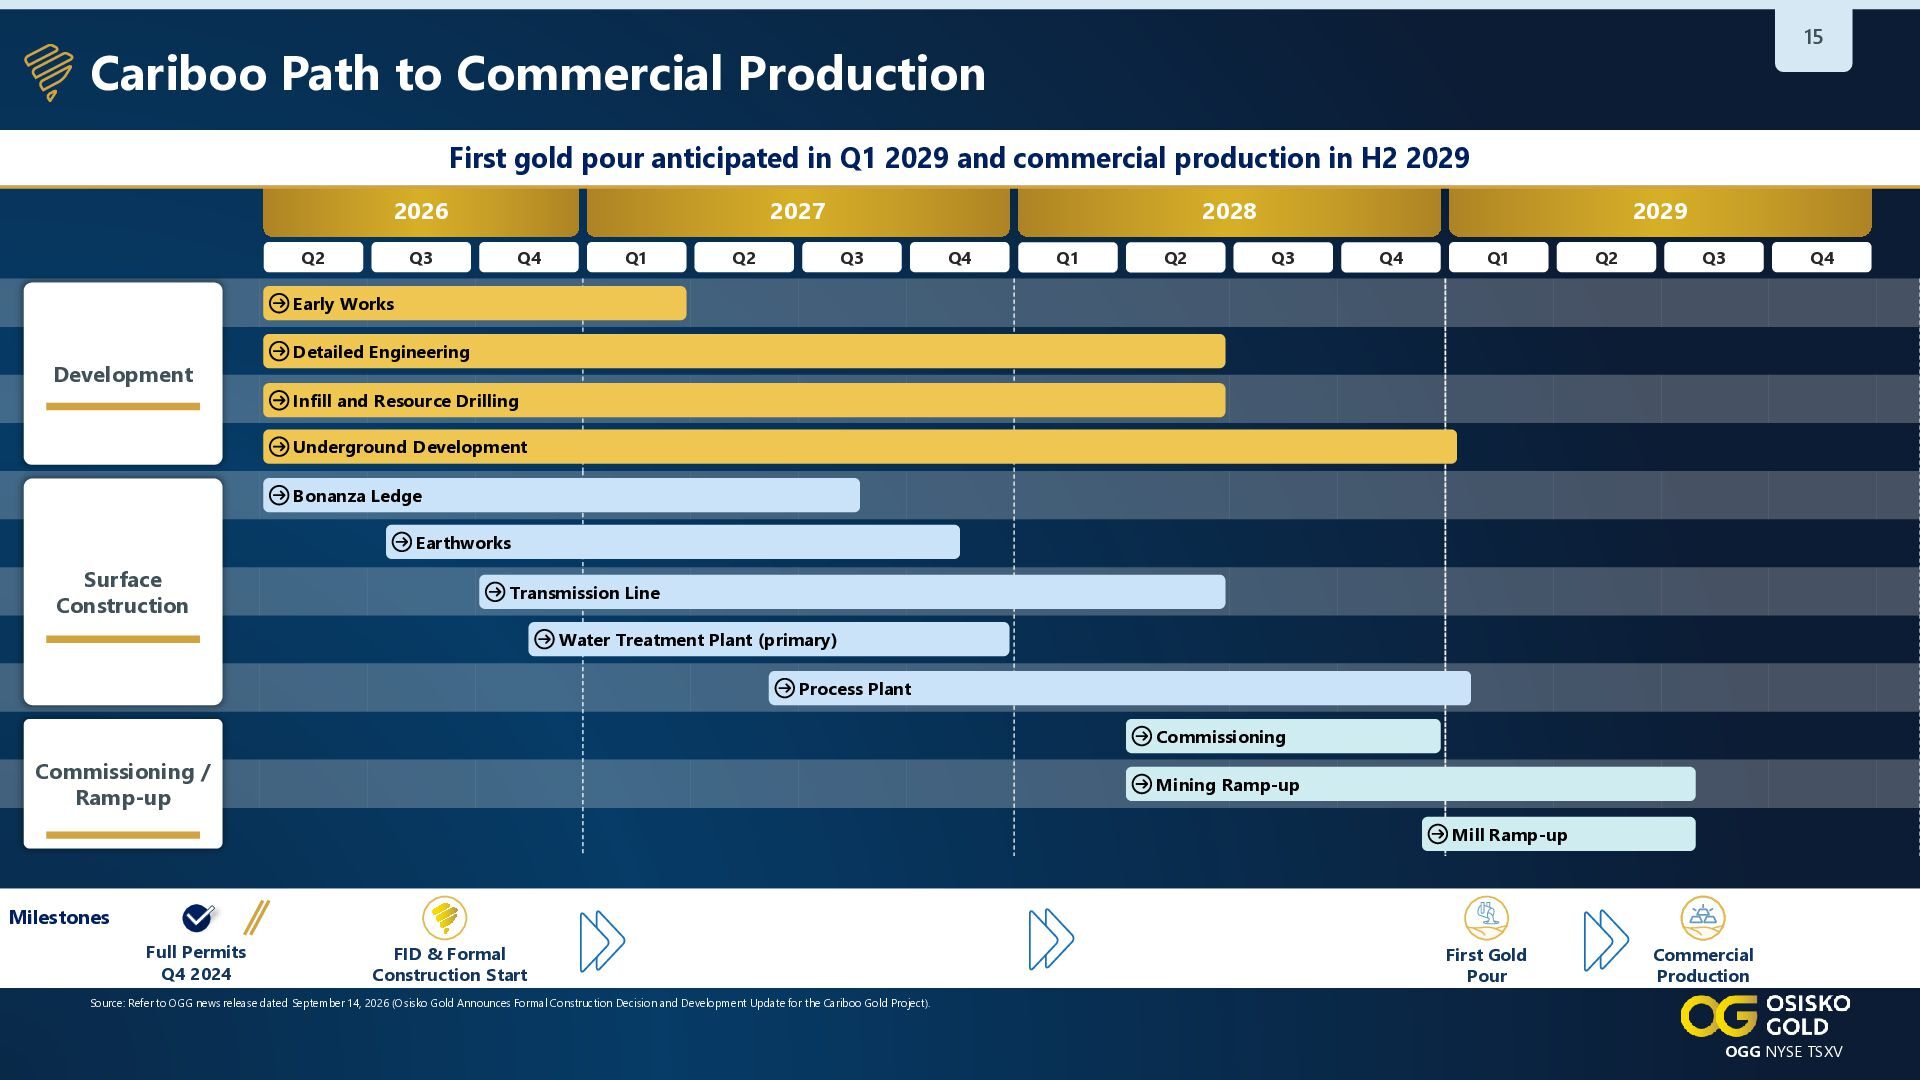
15 Cariboo Path to Commercial Production First gold pour anticipated
in Q1 2029 and commercial production in H2 2029 2026 Q2 2027 Q3 Q4 Q1 Q2 2029 2028 Q3 Q4 Q1 Q2 Q3 Q4 Q1 Q2 Q3 Q4 Early Works Development Detailed Engineering Infill and Resource Drilling Underground Development Bonanza Ledge Earthworks Surface Construction Transmission Line Water Treatment Plant (primary) Process Plant Commissioning Commissioning / Ramp-up Mining Ramp-up Mill Ramp-up Milestones Full Permits Q4 2024 FID & Formal Construction Start First Gold Pour Commercial Production Source: Refer to OGG news release dated September 14, 2026 (Osisko Gold Announces Formal Construction Decision and Development Update for the Cariboo Gold Project). OGG NYSE TSXV -
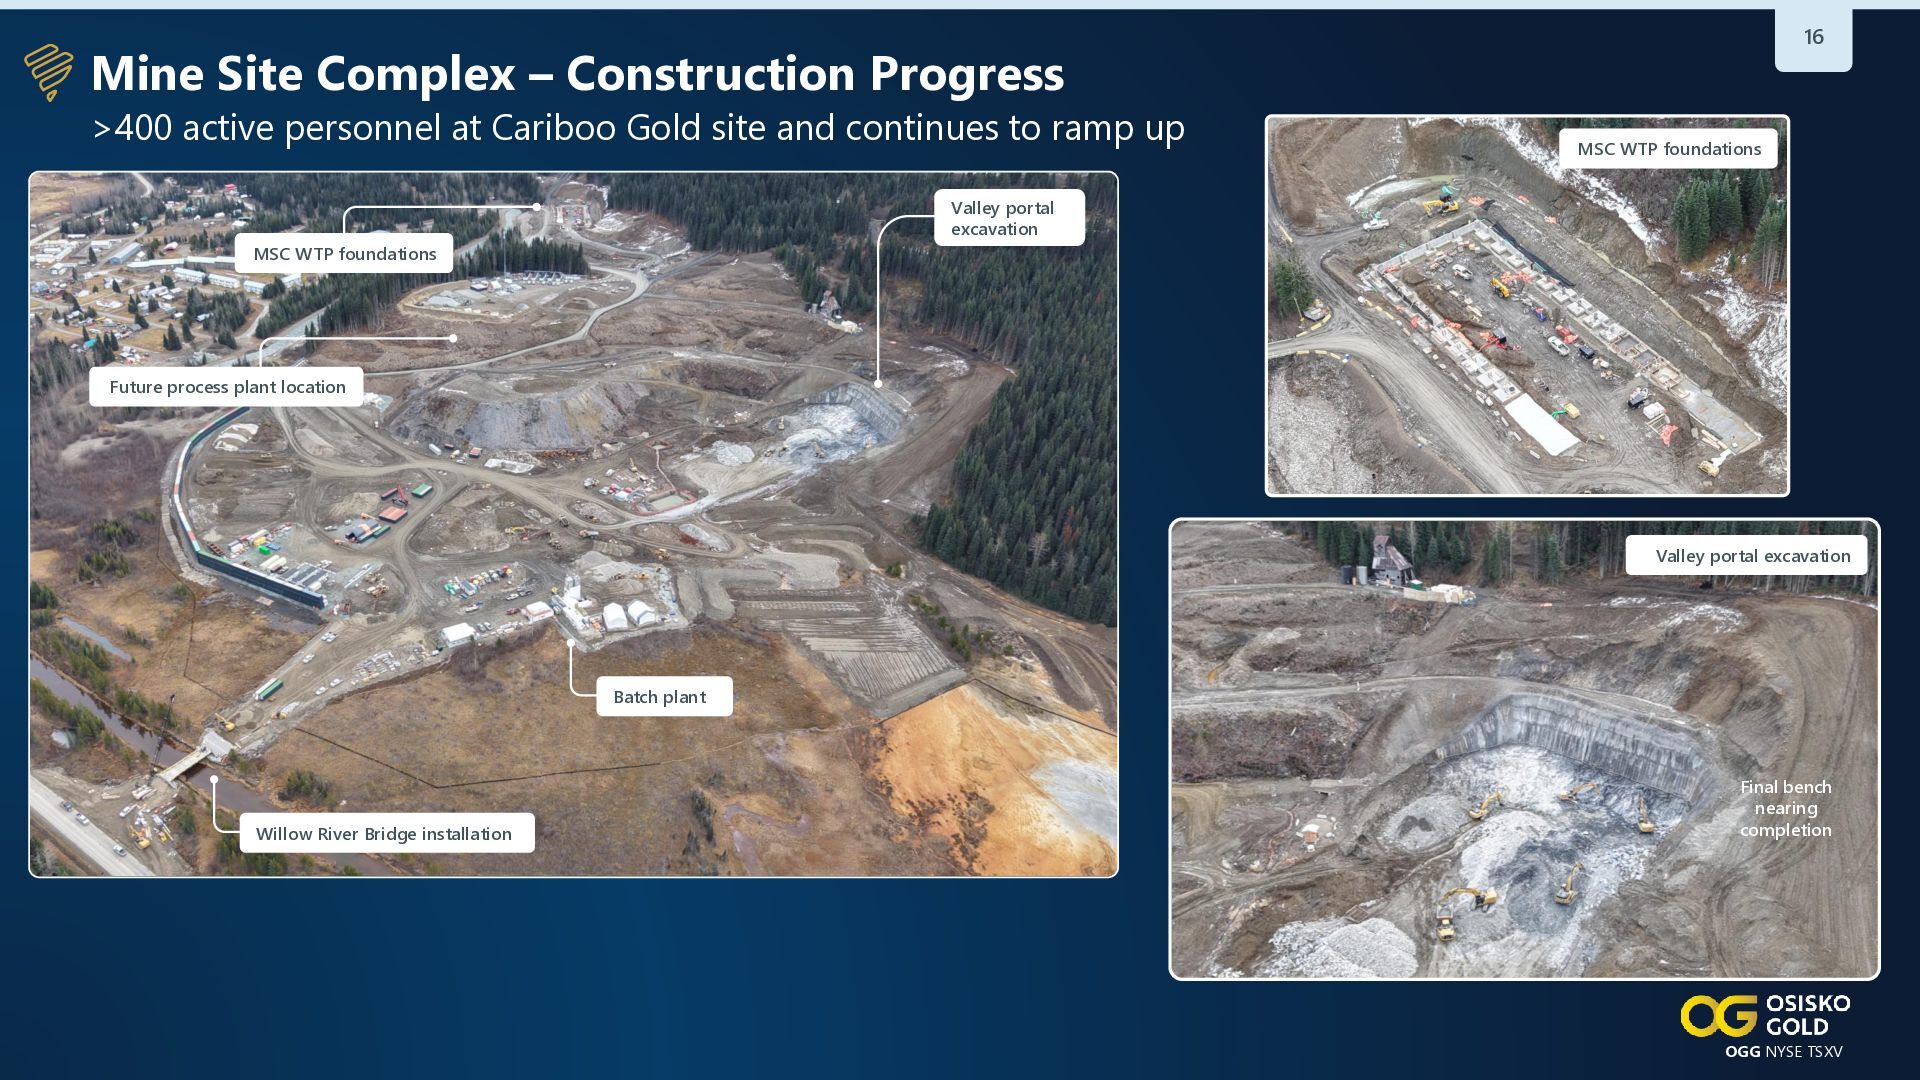
16 Mine Site Complex – Construction Progress >400 active personnel
at Cariboo Gold site and continues to ramp up MSC WTP foundations Valley portal excavation MSC WTP foundations Future process plant location Valley portal excavation Batch plant Willow River Bridge installation Final bench nearing completion OGG NYSE TSXV -
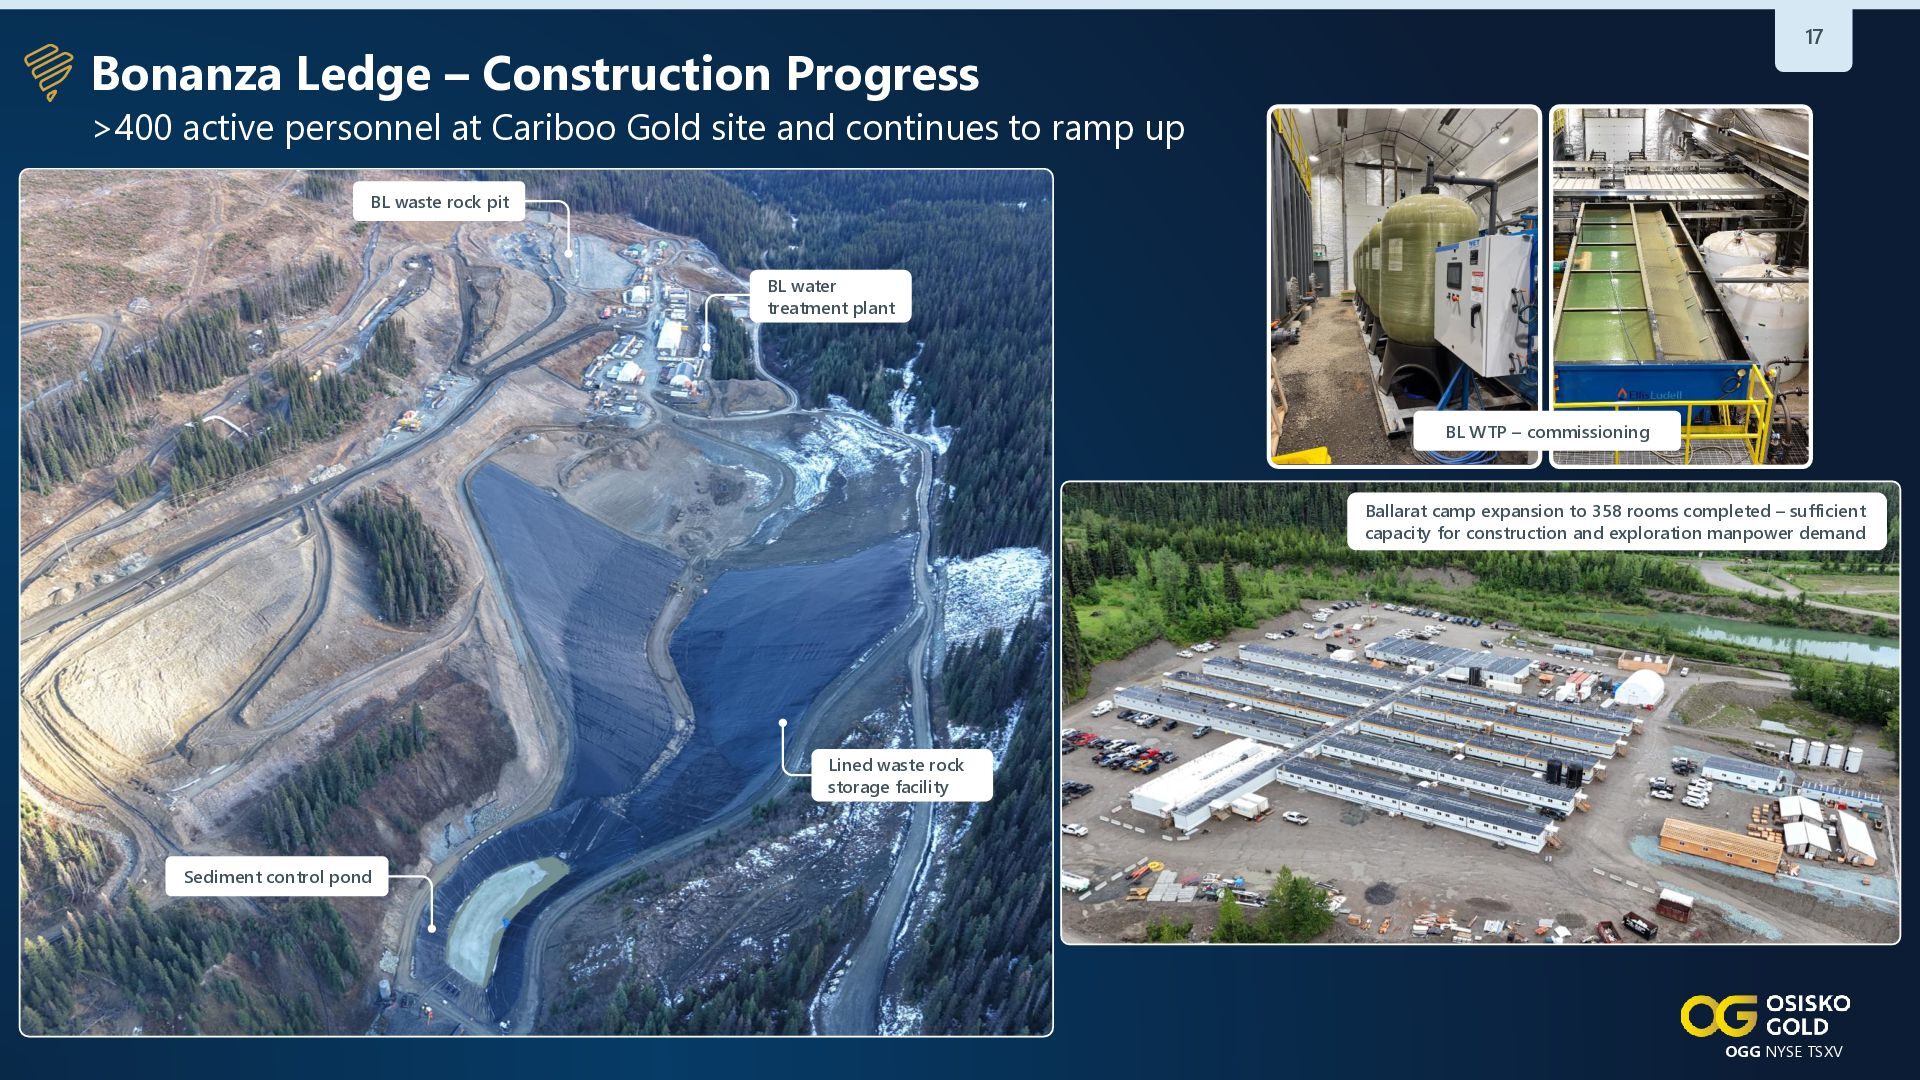
17 Bonanza Ledge – Construction Progress >400 active personnel at
Cariboo Gold site and continues to ramp up BL waste rock pit BL water treatment plant BL WTP – commissioning Ballarat camp expansion to 358 rooms completed – sufficient capacity for construction and exploration manpower demand Lined waste rock storage facility Sediment control pond OGG NYSE TSXV -
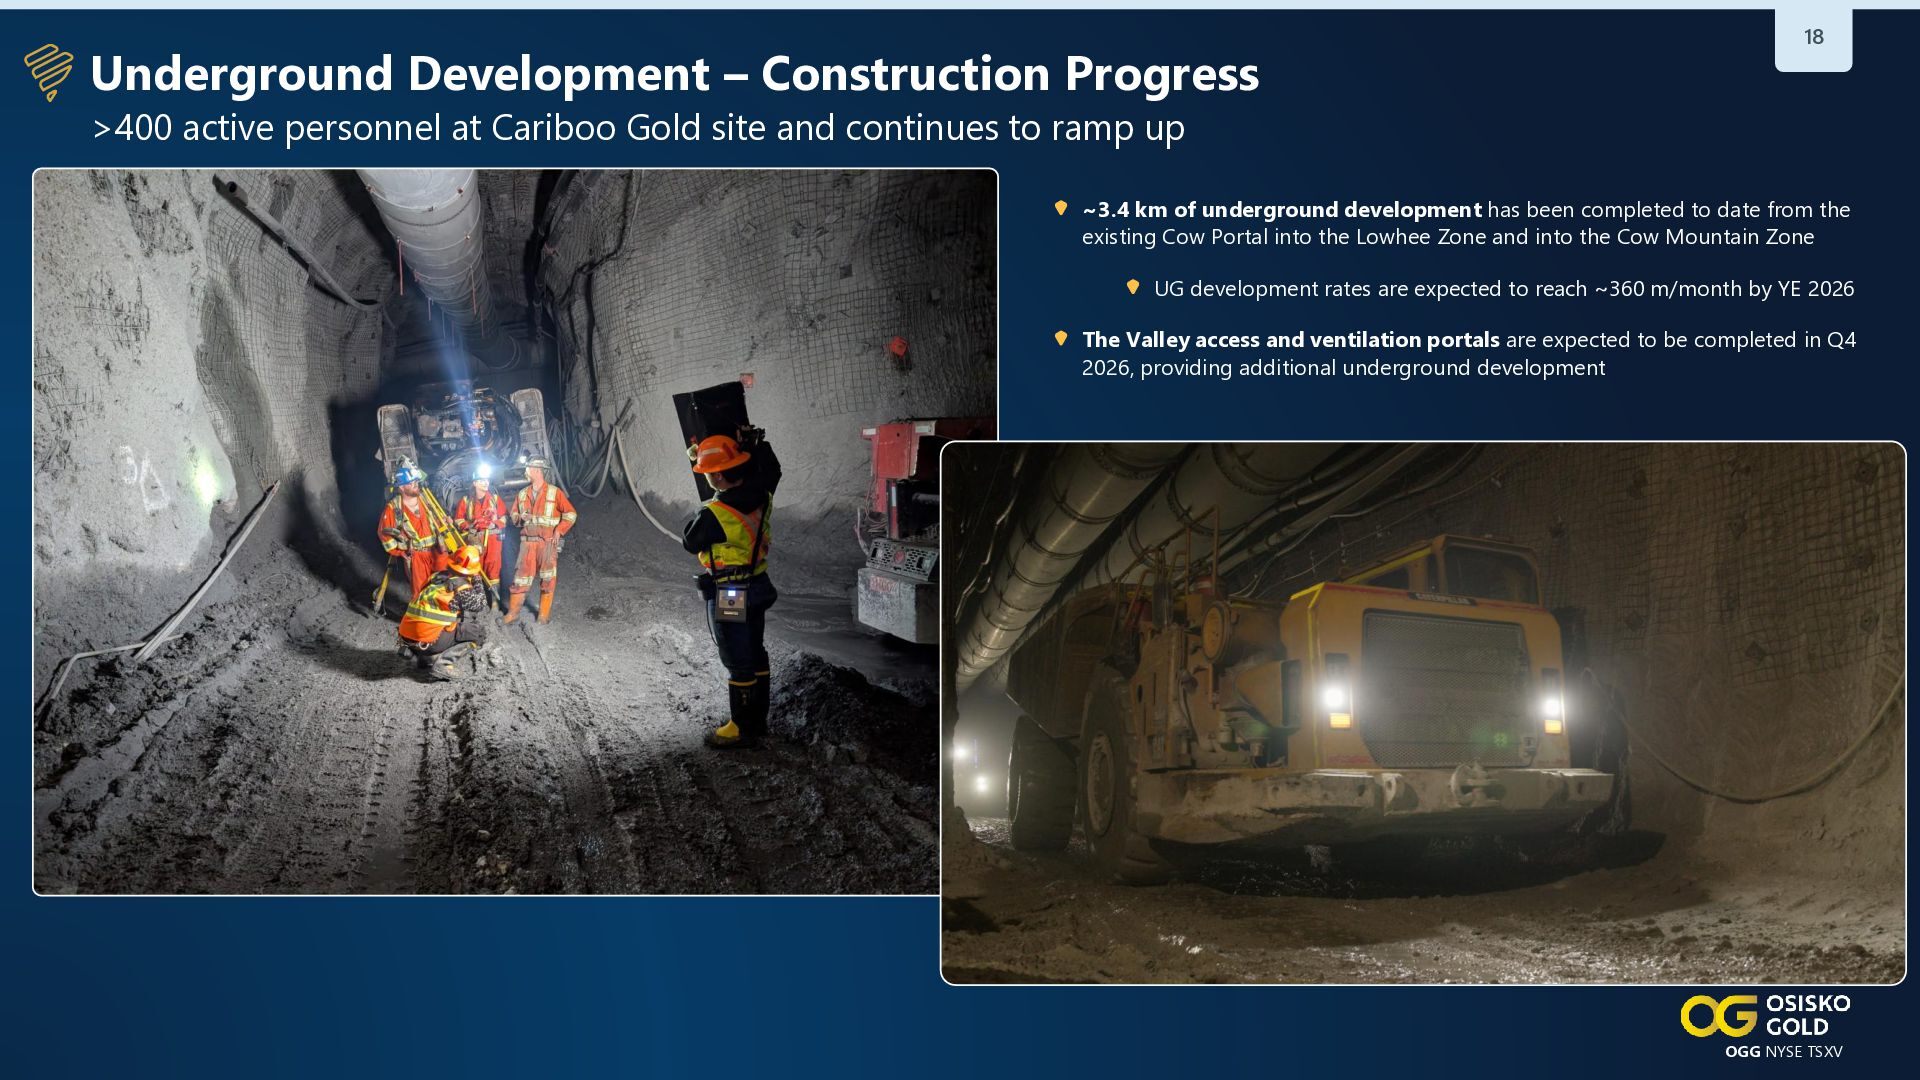
Underground Development – Construction Progress 18 >400 active personnel at
Cariboo Gold site and continues to ramp up ~3.4 km of underground development has been completed to date from the existing Cow Portal into the Lowhee Zone and into the Cow Mountain Zone UG development rates are expected to reach ~360 m/month by YE 2026 The Valley access and ventilation portals are expected to be completed in Q4 2026, providing additional underground development OGG NYSE TSXV -
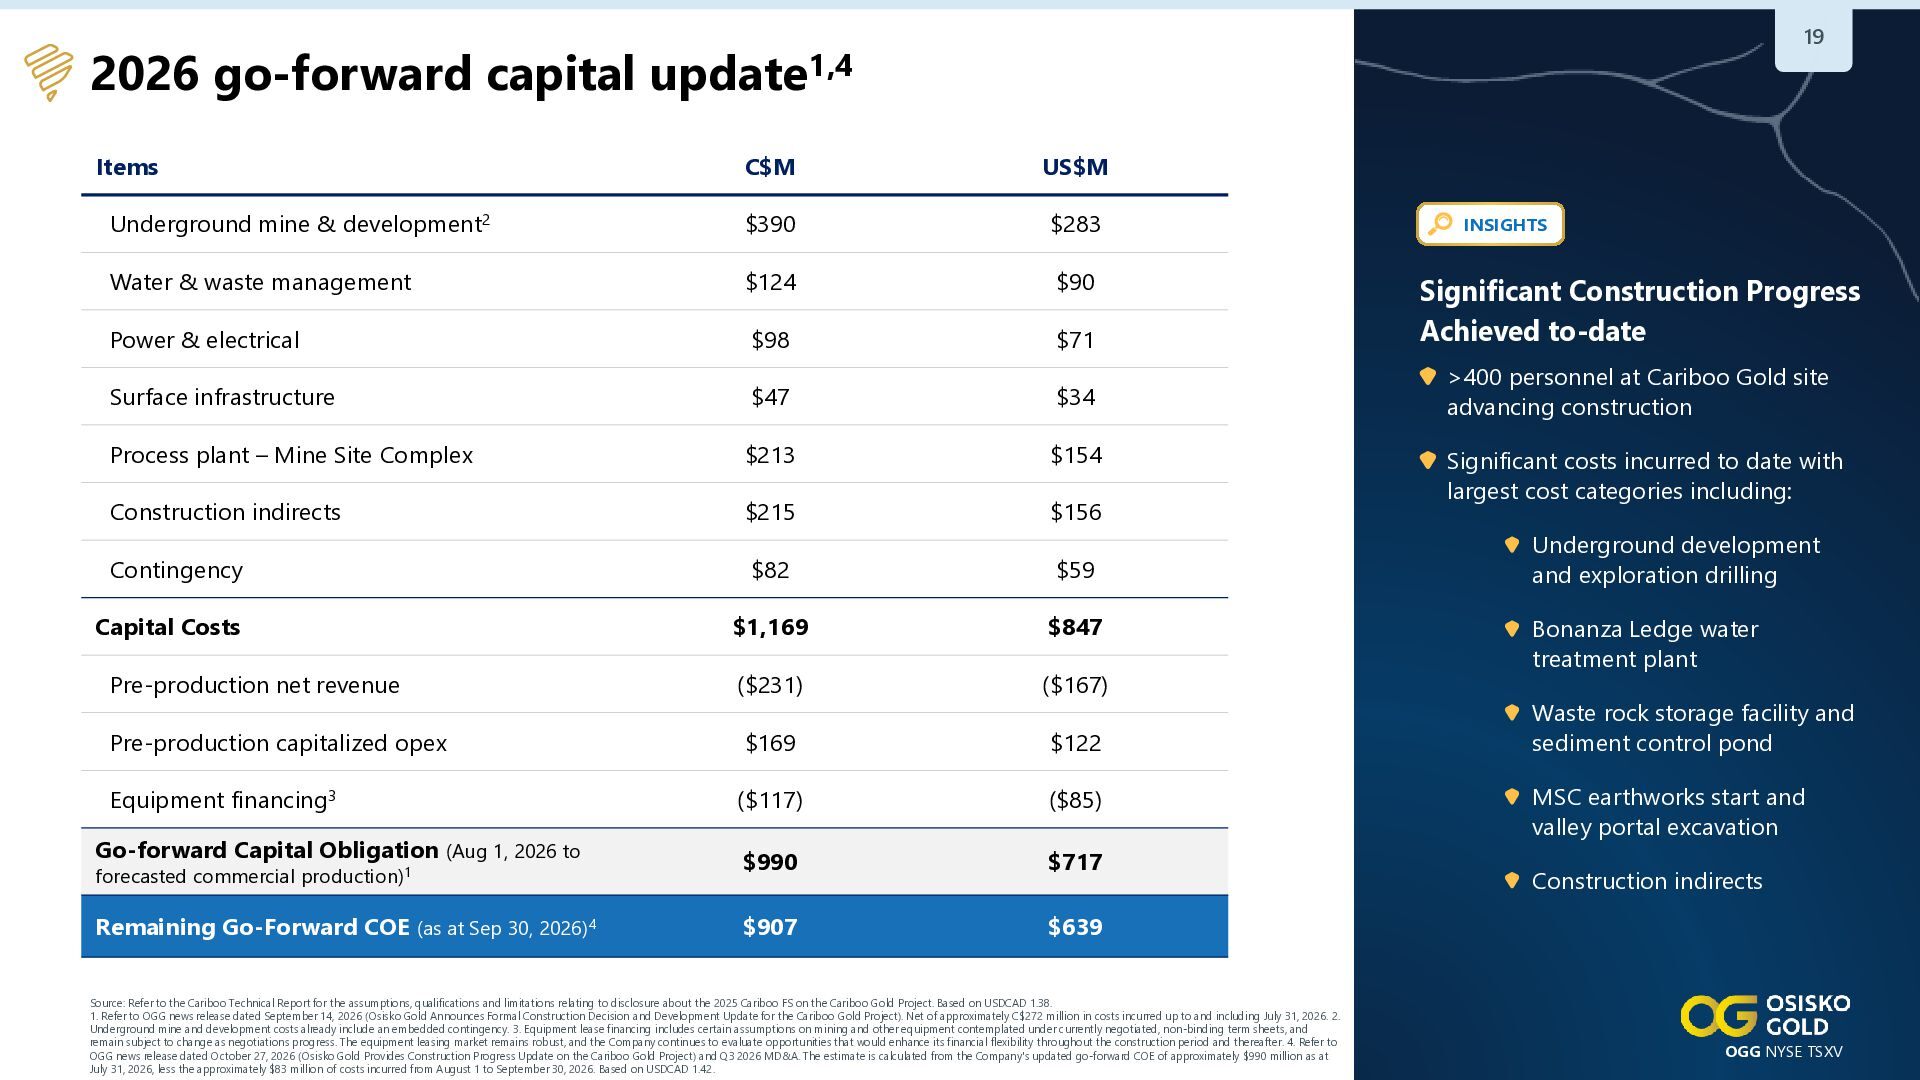
19 2026 go-forward capital update1,4 Items C$M US$M Underground mine
& development2 $390 $283 Water & waste management $124 $90 Power & electrical $98 $71 Significant Construction Progress Achieved to-date Surface infrastructure $47 $34 >400 personnel at Cariboo Gold site advancing construction Process plant – Mine Site Complex $213 $154 Construction indirects $215 $156 Contingency $82 $59 Capital Costs $1,169 $847 Pre-production net revenue ($231) ($167) Pre-production capitalized opex $169 $122 Equipment financing3 ($117) ($85) Go-forward Capital Obligation (Aug 1, 2026 to $990 $717 Remaining Go-Forward COE (as at Sep 30, 2026)4 $907 $639 forecasted commercial production)1 Source: Refer to the Cariboo Technical Report for the assumptions, qualifications and limitations relating to disclosure about the 2025 Cariboo FS on the Cariboo Gold Project. Based on USDCAD 1.38. 1. Refer to OGG news release dated September 14, 2026 (Osisko Gold Announces Formal Construction Decision and Development Update for the Cariboo Gold Project). Net of approximately C$272 million in costs incurred up to and including July 31, 2026. 2. Underground mine and development costs already include an embedded contingency. 3. Equipment lease financing includes certain assumptions on mining and other equipment contemplated under currently negotiated, non-binding term sheets, and remain subject to change as negotiations progress. The equipment leasing market remains robust, and the Company continues to evaluate opportunities that would enhance its financial flexibility throughout the construction period and thereafter. 4. Refer to OGG news release dated October 27, 2026 (Osisko Gold Provides Construction Progress Update on the Cariboo Gold Project) and Q3 2026 MD&A. The estimate is calculated from the Company's updated go-forward COE of approximately $990 million as at July 31, 2026, less the approximately $83 million of costs incurred from August 1 to September 30, 2026. Based on USDCAD 1.42. INSIGHTS Significant costs incurred to date with largest cost categories including: Underground development and exploration drilling Bonanza Ledge water treatment plant Waste rock storage facility and sediment control pond MSC earthworks start and valley portal excavation Construction indirects OGG NYSE TSXV -
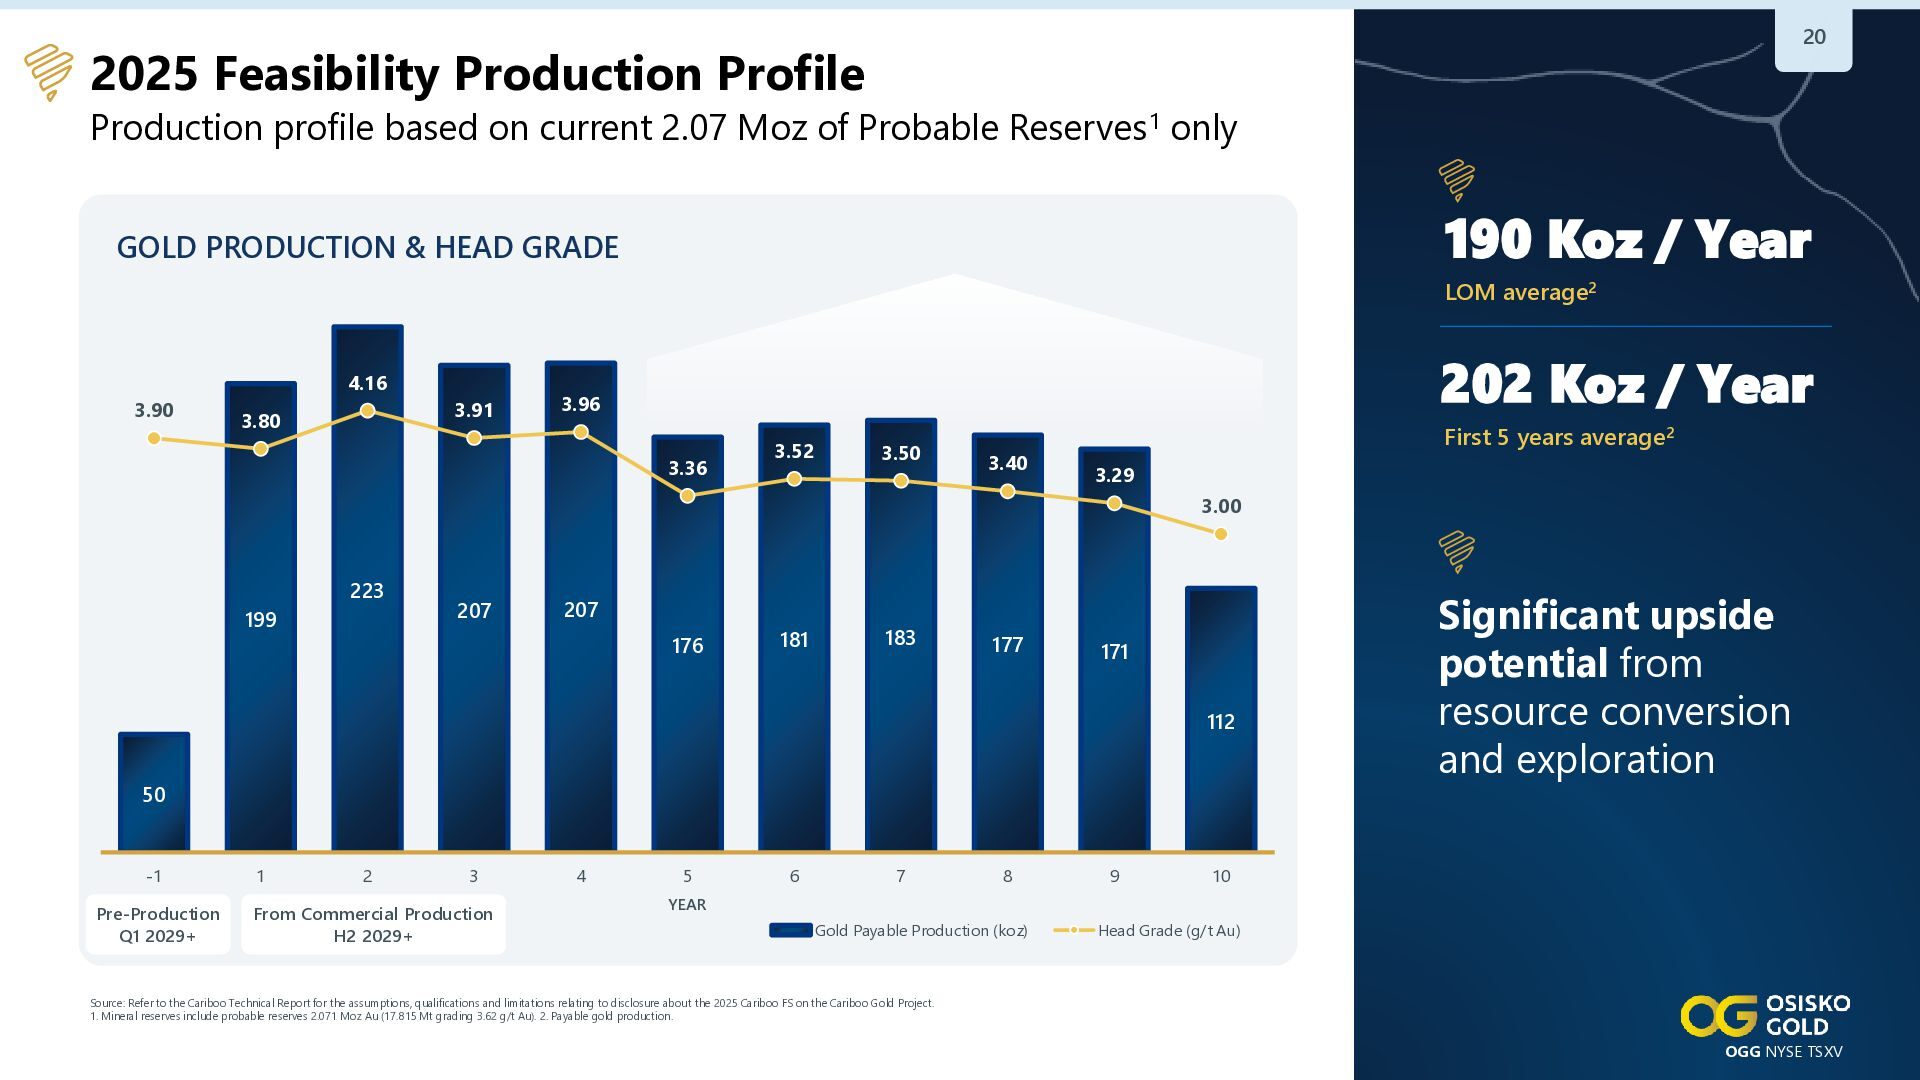
20 2025 Feasibility Production Profile Production profile based on current
2.07 Moz of Probable Reserves1 only 190 Koz / Year GOLD PRODUCTION & HEAD GRADE LOM average2 4.16 3.90 3.91 3.80 202 Koz / Year 3.96 3.36 3.52 3.50 3.40 First 5 years average2 3.29 3.00 223 199 207 207 176 181 183 177 171 112 50 -1 Pre-Production Q1 2029+ 1 2 3 From Commercial Production H2 2029+ 4 5 6 7 8 9 Significant upside potential from resource conversion and exploration 10 YEAR Gold Payable Production (koz) Head Grade (g/t Au) Source: Refer to the Cariboo Technical Report for the assumptions, qualifications and limitations relating to disclosure about the 2025 Cariboo FS on the Cariboo Gold Project. 1. Mineral reserves include probable reserves 2.071 Moz Au (17.815 Mt grading 3.62 g/t Au). 2. Payable gold production. OGG NYSE TSXV -
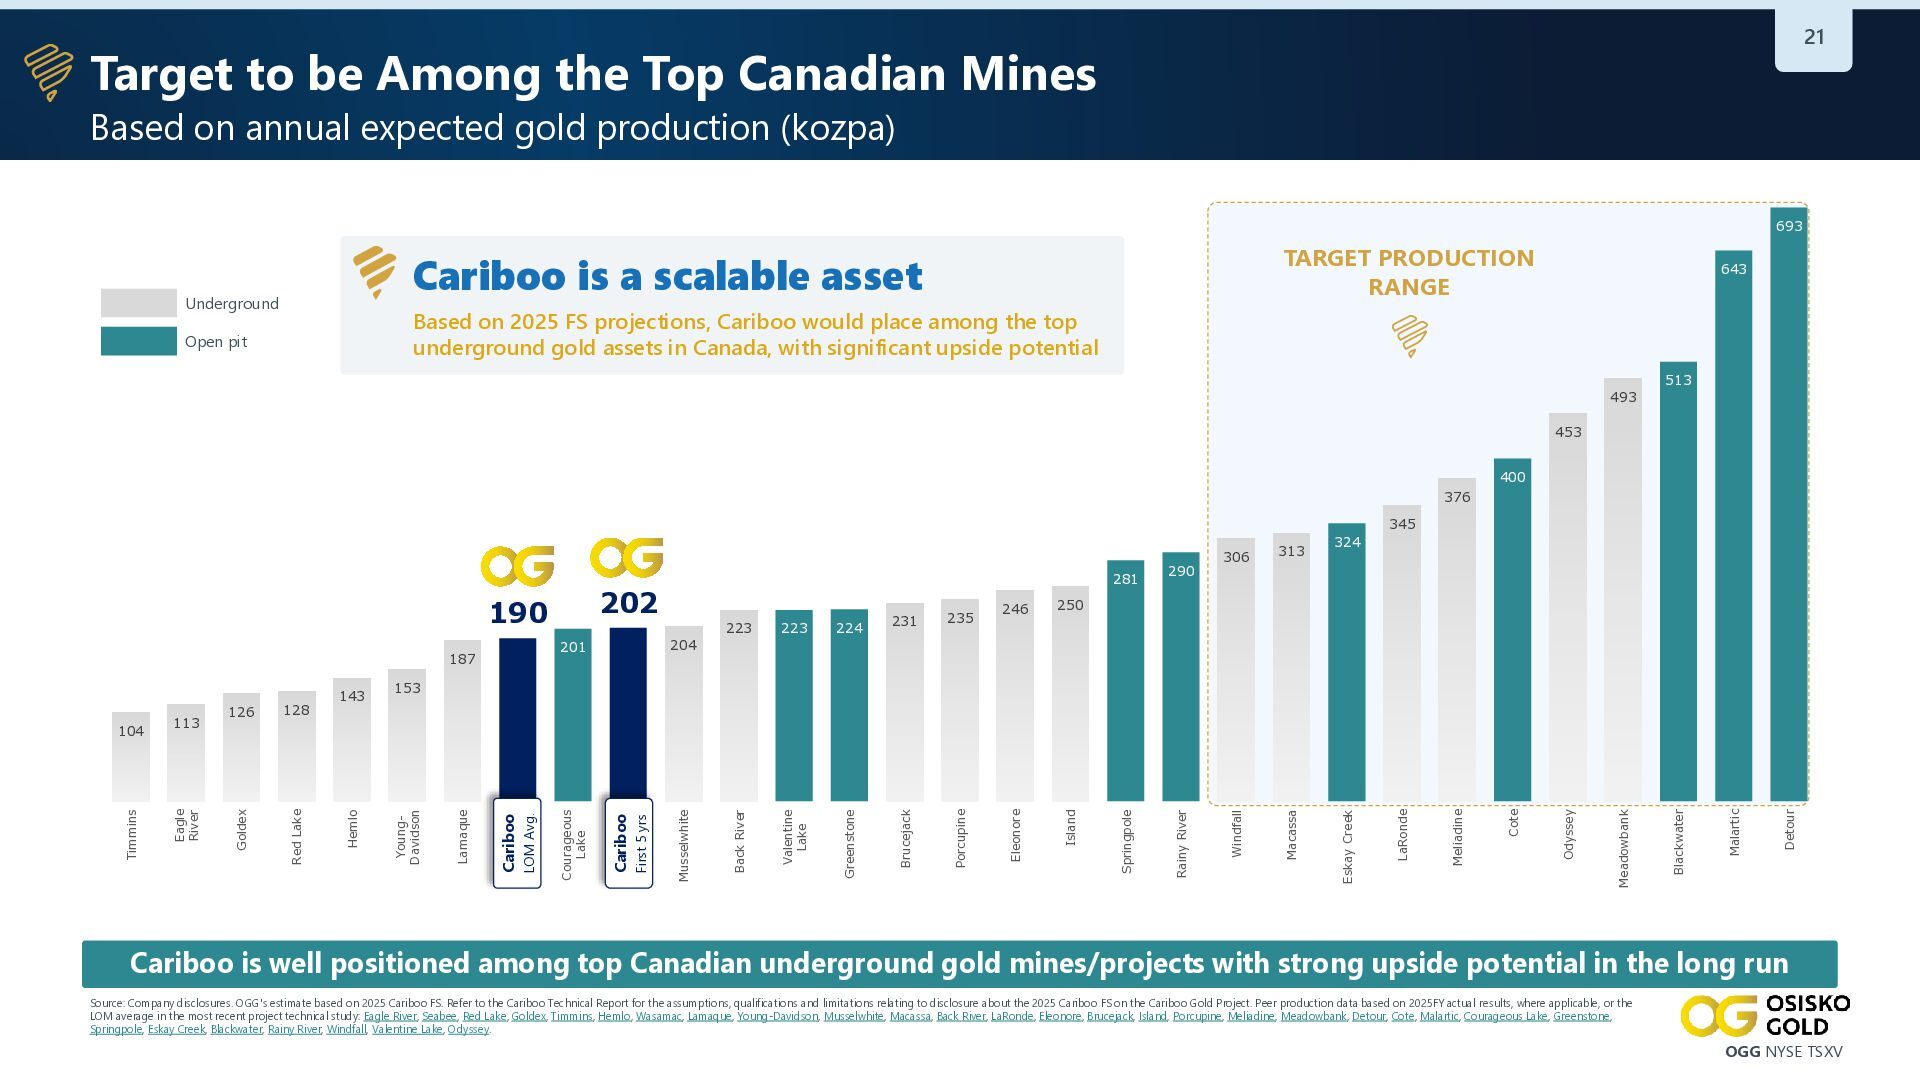
21 Target to be Among the Top Canadian Mines Based
on annual expected gold production (kozpa) 693 TARGET PRODUCTION RANGE Cariboo is a scalable asset Underground 643 Based on 2025 FS projections, Cariboo would place among the top underground gold assets in Canada, with significant upside potential Open pit 493 513 453 400 376 250 306 Macassa 246 Island Greenstone 235 Eleonore Valentine Lake 231 Porcupine 224 Brucejack 223 290 324 Detour Malartic Blackwater Meadowbank Odyssey Cote Meliadine LaRonde Eskay Creek Rainy River Springpole Musselwhite First 5 yrs Cariboo Cariboo Courageous Lake Cariboo Cariboo LOM Avg. Lamaque 153 YoungDavidson Red Lake 143 Hemlo 128 Goldex 113 Eagle River Timmins 104 126 204 201 223 Back River 202 190 187 281 Windfall 345 313 Cariboo is well positioned among top Canadian underground gold mines/projects with strong upside potential in the long run Source: Company disclosures. OGG's estimate based on 2025 Cariboo FS. Refer to the Cariboo Technical Report for the assumptions, qualifications and limitations relating to disclosure about the 2025 Cariboo FS on the Cariboo Gold Project. Peer production data based on 2025FY actual results, where applicable, or the LOM average in the most recent project technical study: Eagle River, Seabee, Red Lake, Goldex, Timmins, Hemlo, Wasamac, Lamaque, Young-Davidson, Musselwhite, Macassa, Back River, LaRonde, Eleonore, Brucejack, Island, Porcupine, Meliadine, Meadowbank, Detour, Cote, Malartic, Courageous Lake, Greenstone, Springpole, Eskay Creek, Blackwater, Rainy River, Windfall, Valentine Lake, Odyssey. OGG NYSE TSXV -
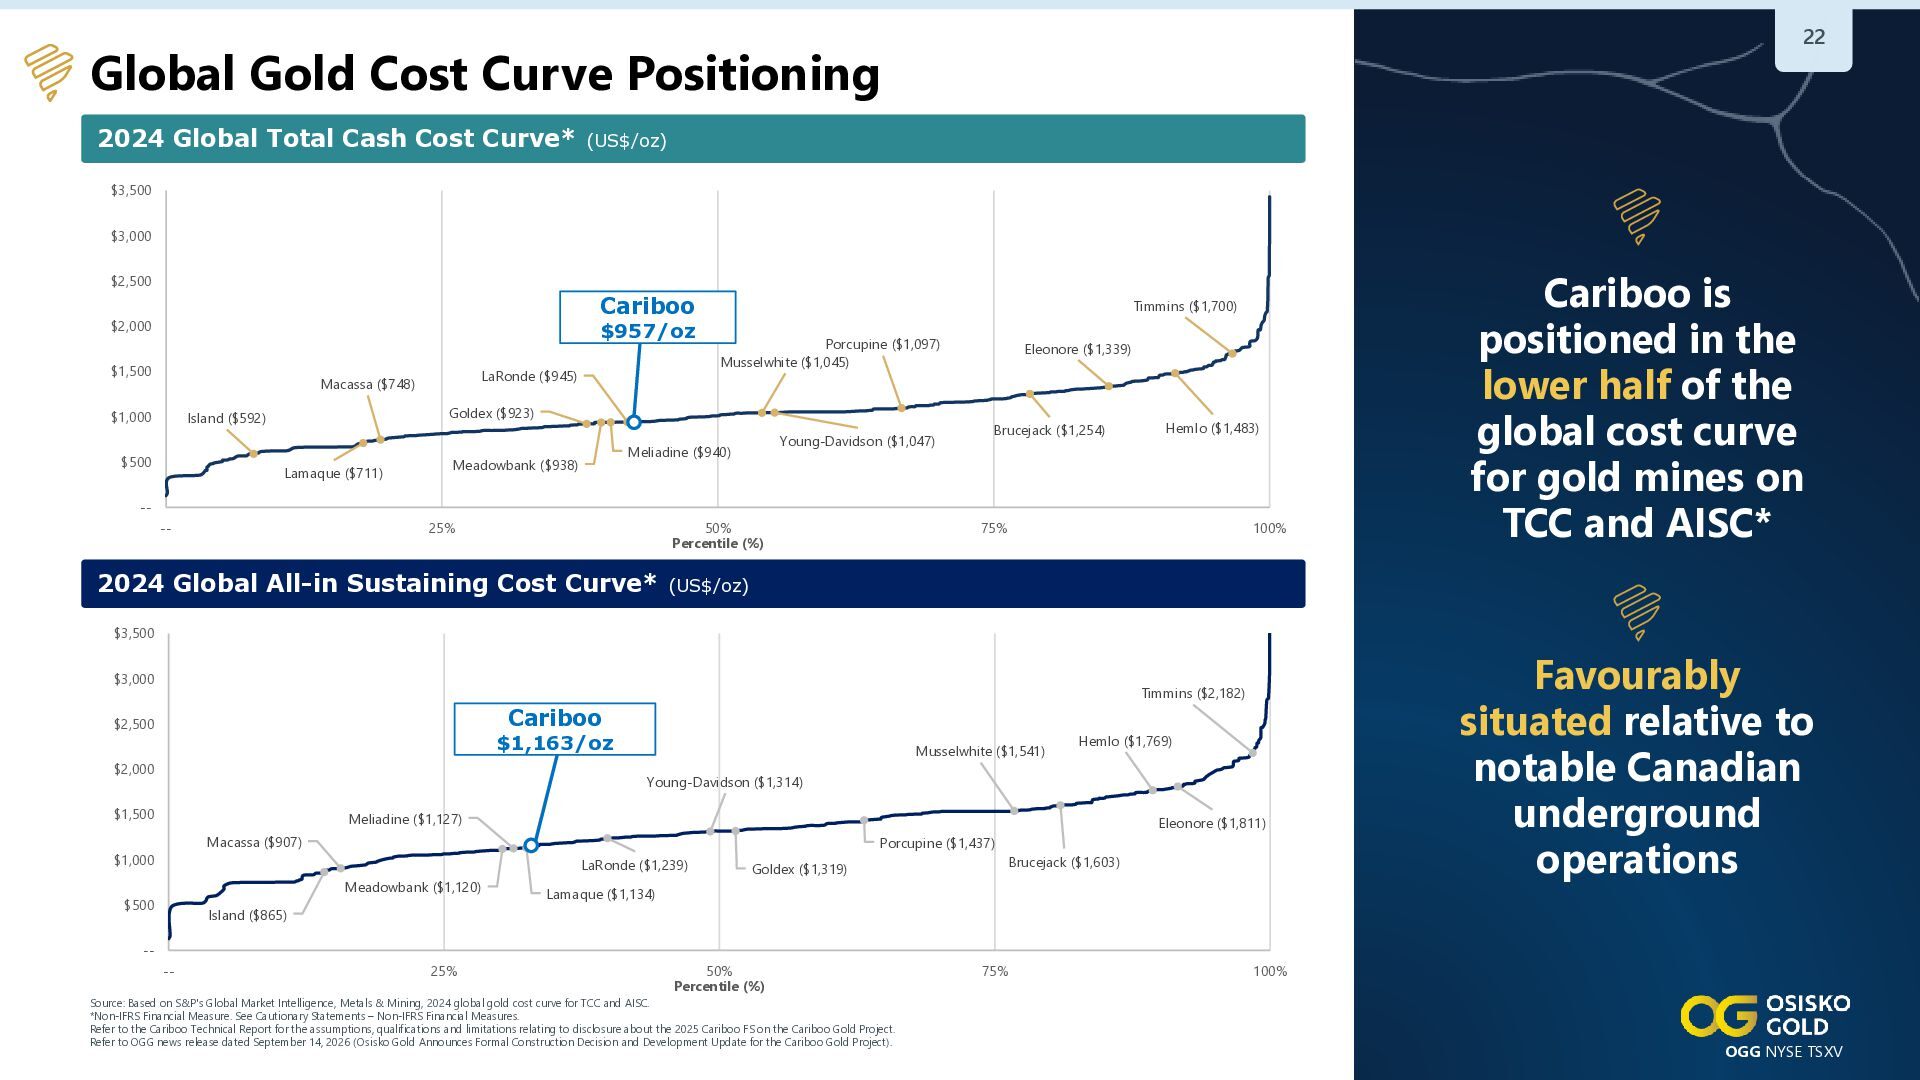
22 Global Gold Cost Curve Positioning 2024 Global Total Cash
Cost Curve* (US$/oz) $3,500 $3,000 $2,500 Cariboo Cariboo ($947) $2,000 $957/oz $1,500 LaRonde ($945) Macassa ($748) $1,000 Porcupine ($1,097) Musselwhite ($1,045) Goldex ($923) Island ($592) $500 Timmins ($1,700) Lamaque ($711) Young-Davidson ($1,047) Meliadine ($940) Meadowbank ($938) Eleonore ($1,339) Brucejack ($1,254) Hemlo ($1,483) --- 25% 50% Percentile (%) 75% 100% Cariboo is positioned in the lower half of the global cost curve for gold mines on TCC and AISC* 2024 Global All-in Sustaining Cost Curve* (US$/oz) $3,500 $3,000 Timmins ($2,182) Cariboo Cariboo ($1,157) $2,500 $1,163/oz $2,000 Musselwhite ($1,541) Hemlo ($1,769) Young-Davidson ($1,314) $1,500 Meliadine ($1,127) Eleonore ($1,811) Macassa ($907) $1,000 Porcupine ($1,437) LaRonde ($1,239) Meadowbank ($1,120) $500 Brucejack ($1,603) Goldex ($1,319) Favourably situated relative to notable Canadian underground operations Lamaque ($1,134) Island ($865) --- 25% 50% Percentile (%) Source: Based on S&P's Global Market Intelligence, Metals & Mining, 2024 global gold cost curve for TCC and AISC. *Non-IFRS Financial Measure. See Cautionary Statements – Non-IFRS Financial Measures. Refer to the Cariboo Technical Report for the assumptions, qualifications and limitations relating to disclosure about the 2025 Cariboo FS on the Cariboo Gold Project. Refer to OGG news release dated September 14, 2026 (Osisko Gold Announces Formal Construction Decision and Development Update for the Cariboo Gold Project). 75% 100% OGG NYSE TSXV -
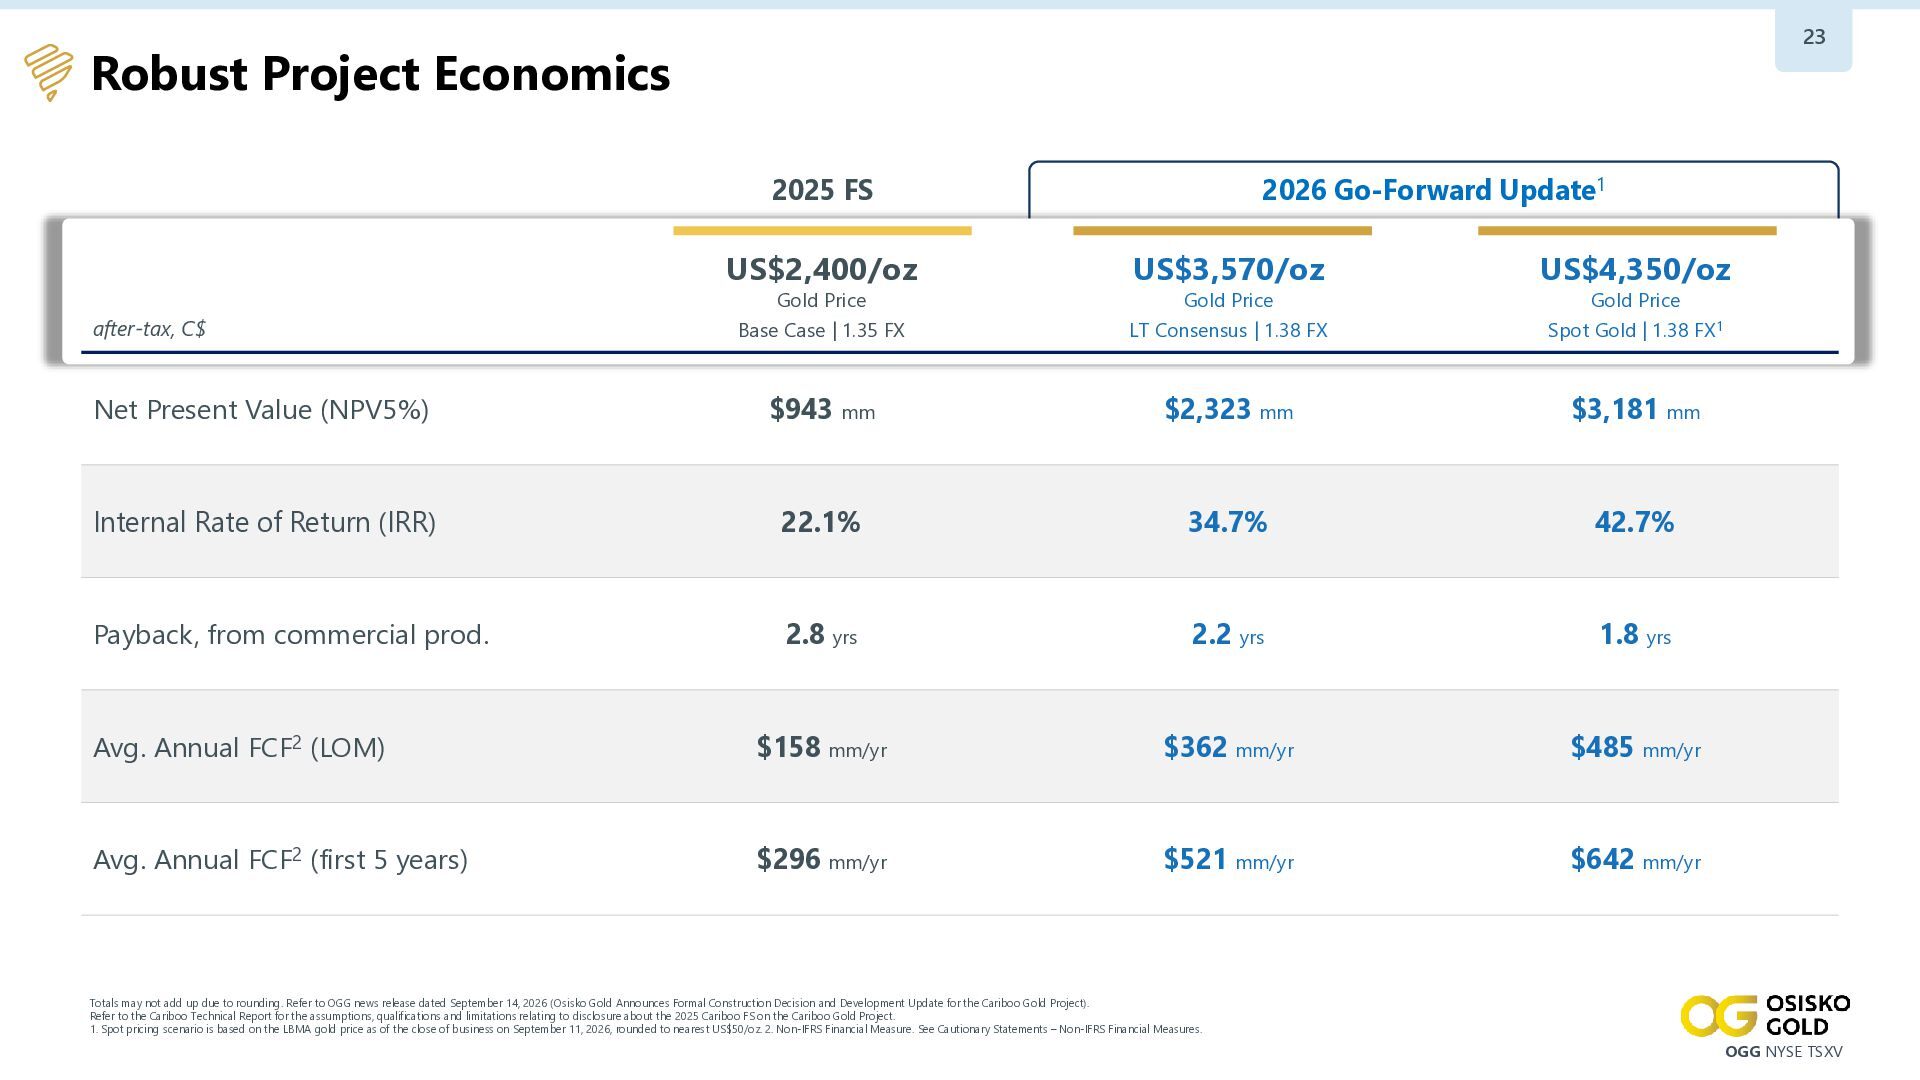
23 Robust Project Economics 2025 FS 2026 Go-Forward Update1 US$2,400/oz
US$3,570/oz US$4,350/oz Base Case | 1.35 FX LT Consensus | 1.38 FX Spot Gold | 1.38 FX1 Net Present Value (NPV5%) $943 mm $2,323 mm $3,181 mm Internal Rate of Return (IRR) 22.1% 34.7% 42.7% Payback, from commercial prod. 2.8 yrs 2.2 yrs 1.8 yrs Avg. Annual FCF2 (LOM) $158 mm/yr $362 mm/yr $485 mm/yr Avg. Annual FCF2 (first 5 years) $296 mm/yr $521 mm/yr $642 mm/yr Gold Price after-tax, C$ Gold Price Gold Price Totals may not add up due to rounding. Refer to OGG news release dated September 14, 2026 (Osisko Gold Announces Formal Construction Decision and Development Update for the Cariboo Gold Project). Refer to the Cariboo Technical Report for the assumptions, qualifications and limitations relating to disclosure about the 2025 Cariboo FS on the Cariboo Gold Project. 1. Spot pricing scenario is based on the LBMA gold price as of the close of business on September 11, 2026, rounded to nearest US$50/oz. 2. Non-IFRS Financial Measure. See Cautionary Statements – Non-IFRS Financial Measures. OGG NYSE TSXV -
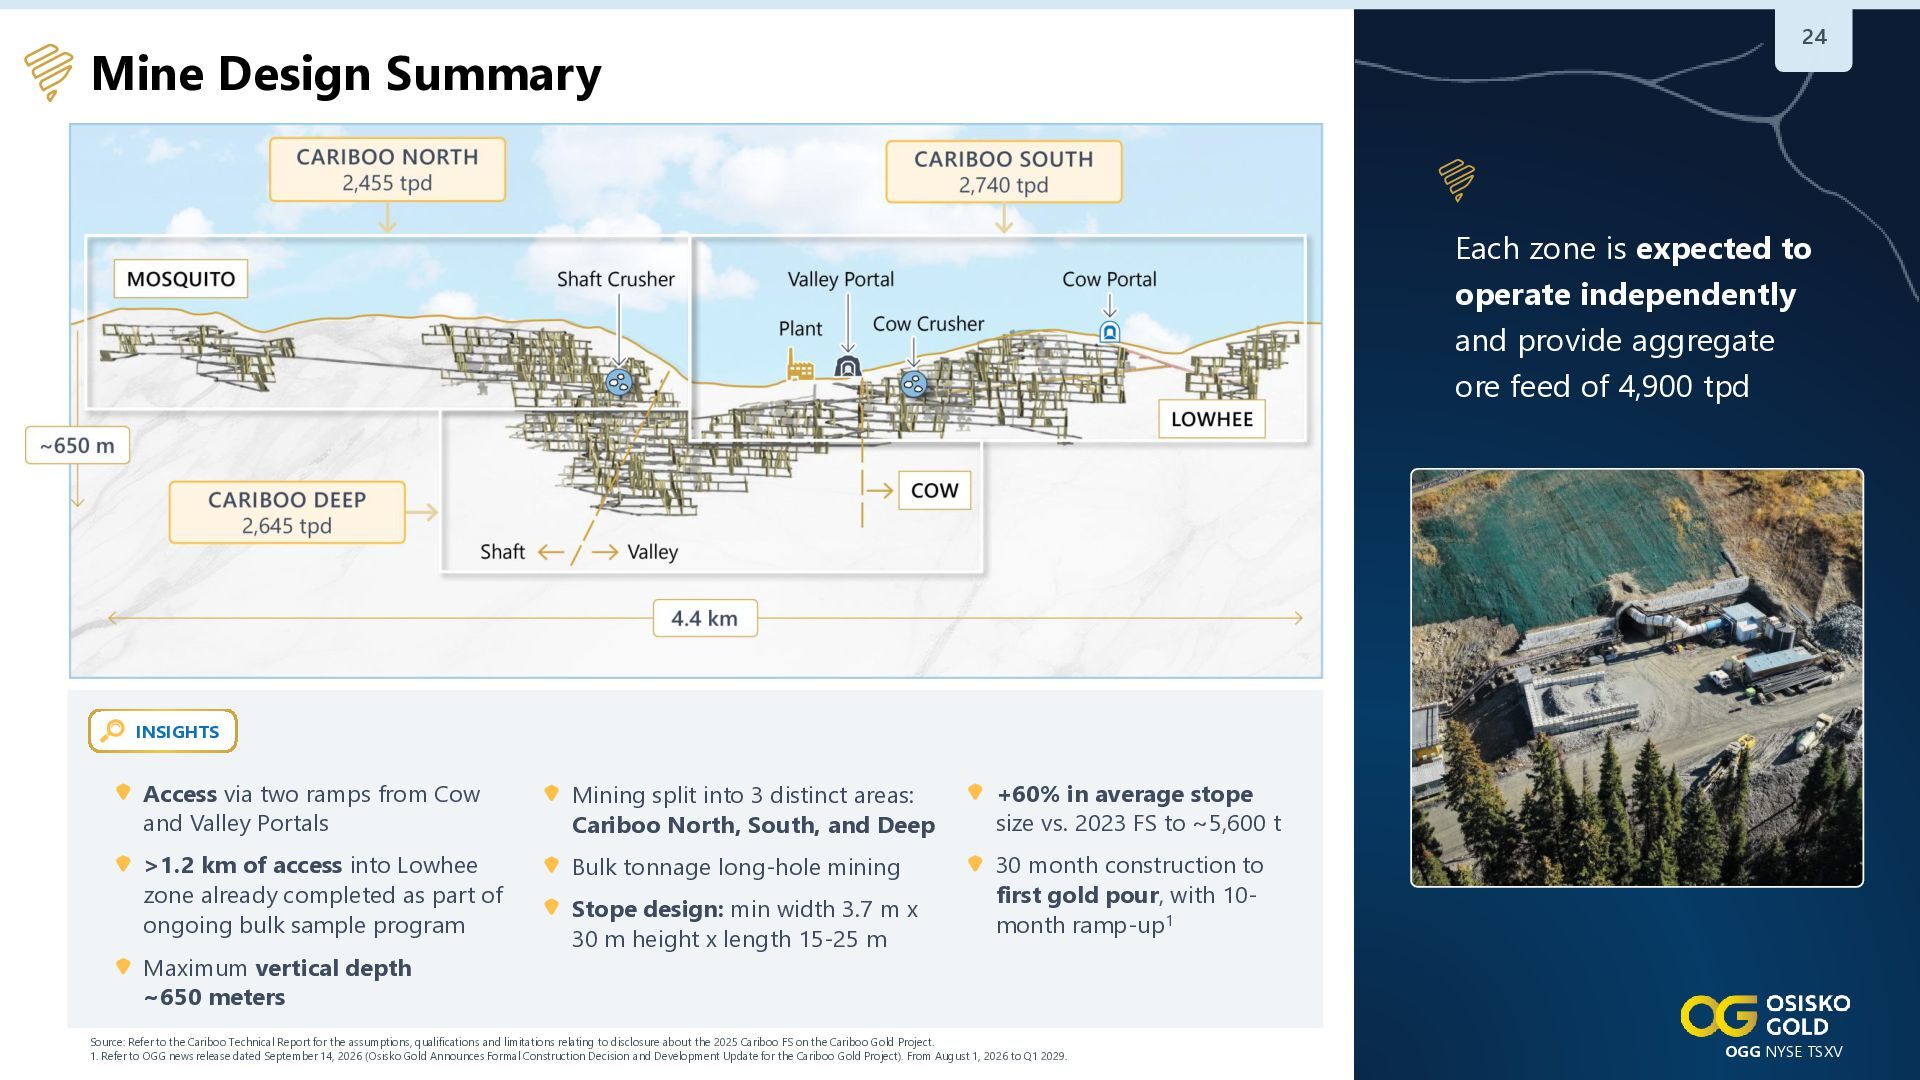
24 Mine Design Summary Each zone is expected to operate
independently and provide aggregate ore feed of 4,900 tpd INSIGHTS Access via two ramps from Cow and Valley Portals Mining split into 3 distinct areas: Cariboo North, South, and Deep +60% in average stope size vs. 2023 FS to ~5,600 t >1.2 km of access into Lowhee zone already completed as part of ongoing bulk sample program Bulk tonnage long-hole mining 30 month construction to first gold pour, with 10month ramp-up1 Maximum vertical depth ~650 meters Stope design: min width 3.7 m x 30 m height x length 15-25 m Source: Refer to the Cariboo Technical Report for the assumptions, qualifications and limitations relating to disclosure about the 2025 Cariboo FS on the Cariboo Gold Project. 1. Refer to OGG news release dated September 14, 2026 (Osisko Gold Announces Formal Construction Decision and Development Update for the Cariboo Gold Project). From August 1, 2026 to Q1 2029. OGG NYSE TSXV -
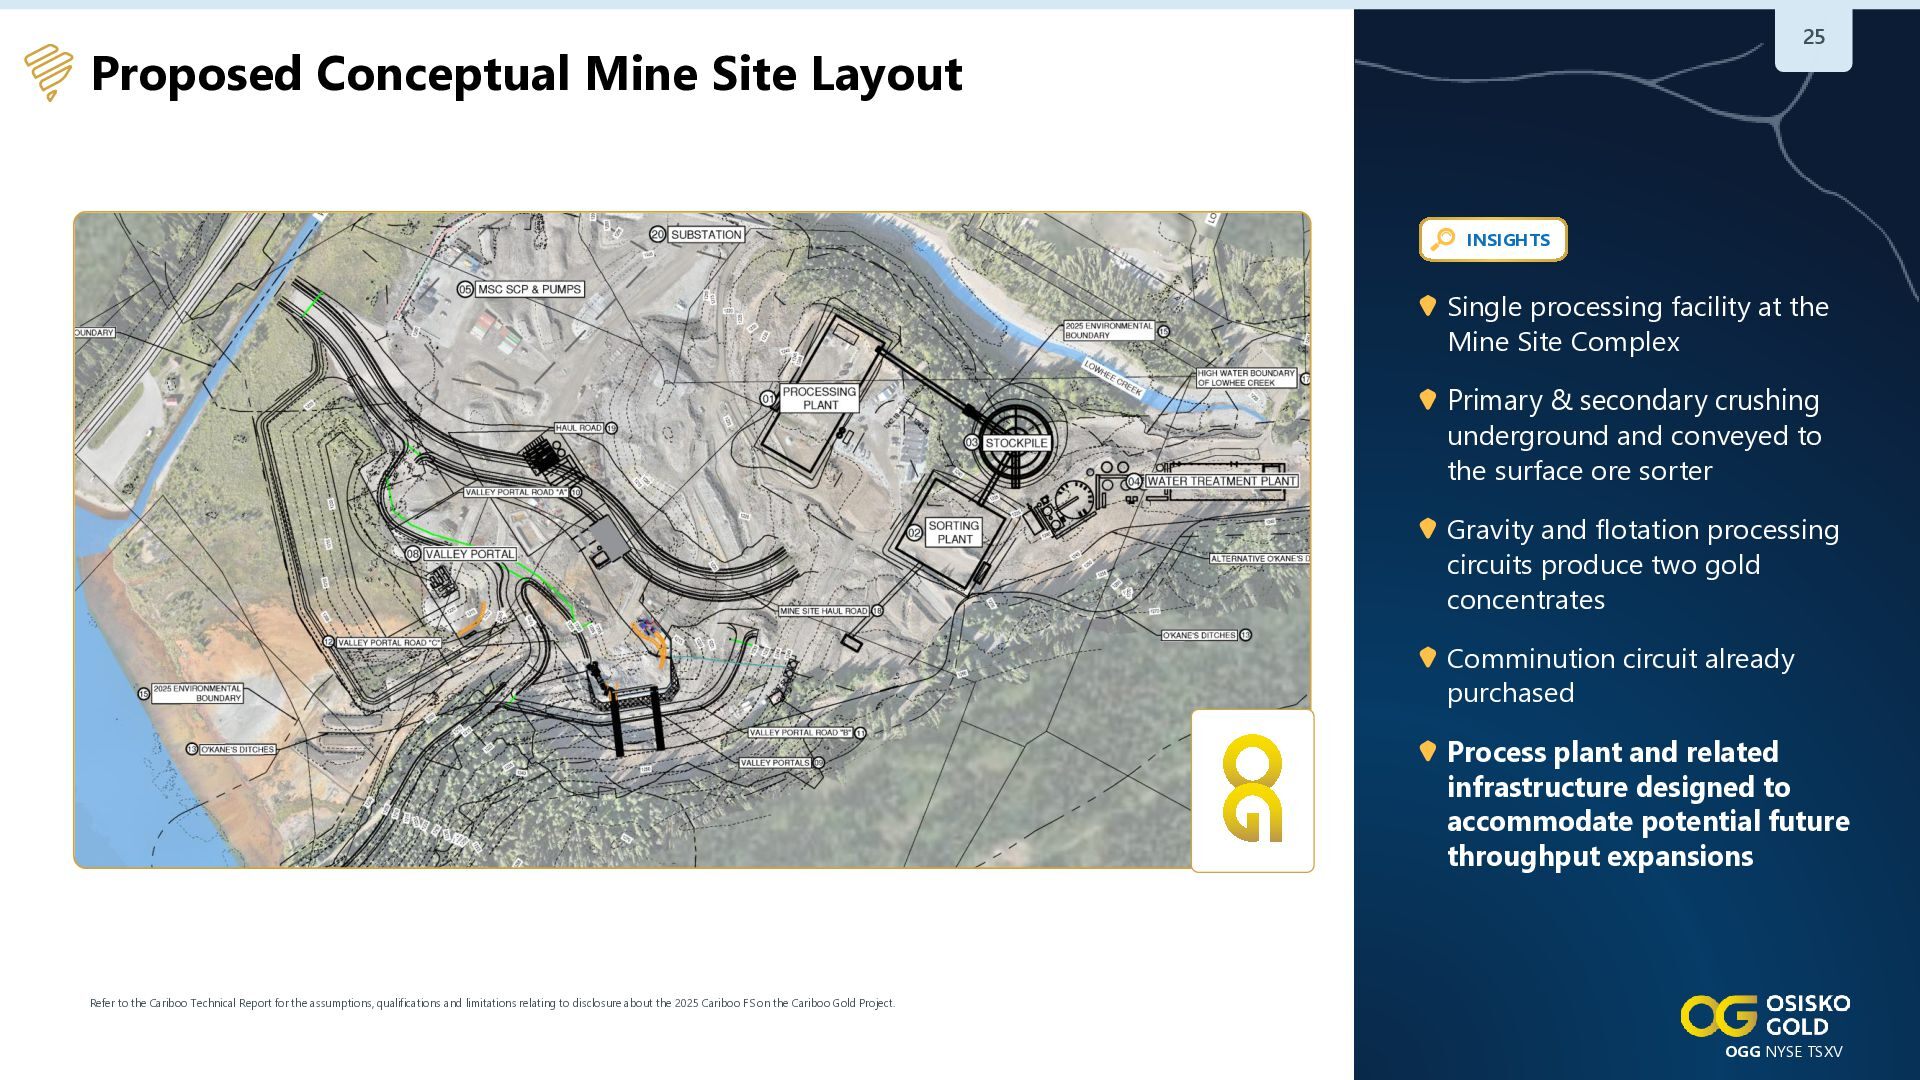
25 Proposed Conceptual Mine Site Layout INSIGHTS Single processing facility
at the Mine Site Complex Primary & secondary crushing underground and conveyed to the surface ore sorter Gravity and flotation processing circuits produce two gold concentrates Comminution circuit already purchased Process plant and related infrastructure designed to accommodate potential future throughput expansions Refer to the Cariboo Technical Report for the assumptions, qualifications and limitations relating to disclosure about the 2025 Cariboo FS on the Cariboo Gold Project. OGG NYSE TSXV -
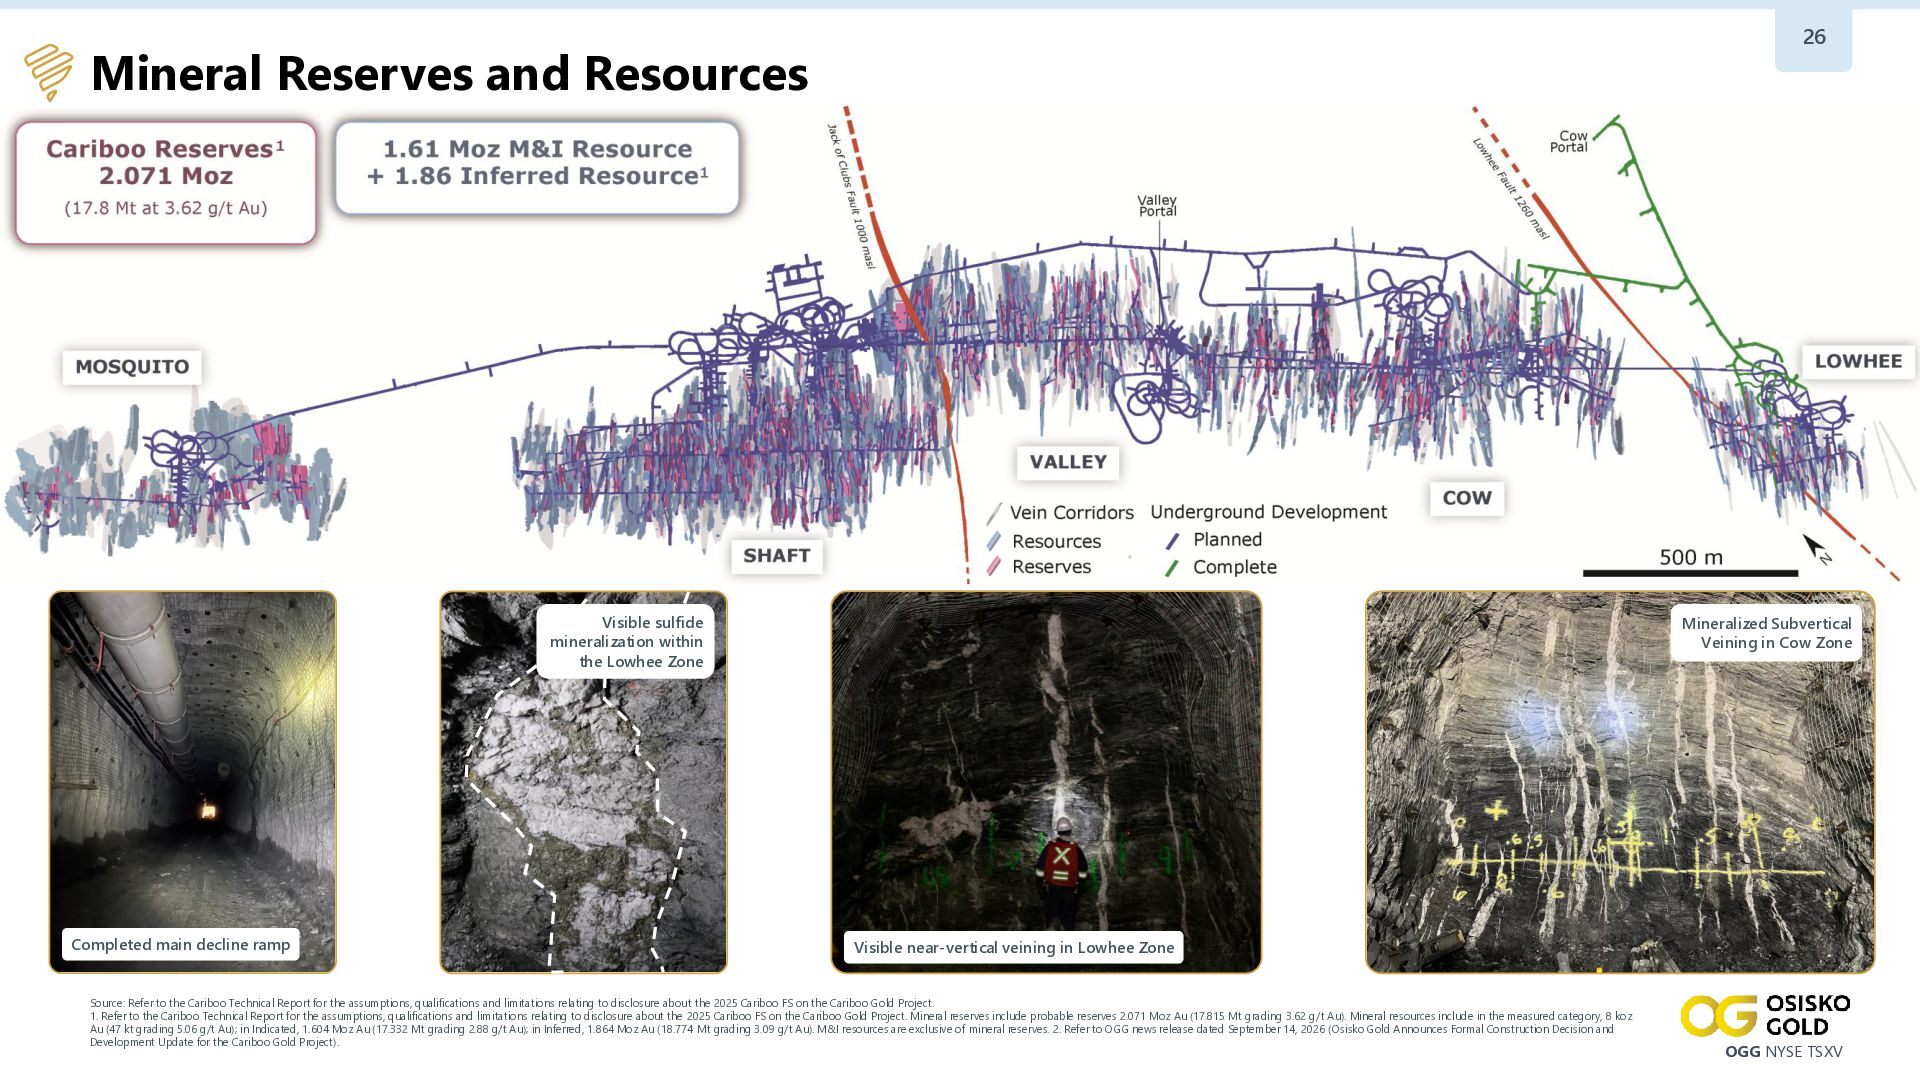
26 Mineral Reserves and Resources Visible sulfide mineralization within the
Lowhee Zone Completed main decline ramp Mineralized Subvertical Veining in Cow Zone Visible near-vertical veining in Lowhee Zone Source: Refer to the Cariboo Technical Report for the assumptions, qualifications and limitations relating to disclosure about the 2025 Cariboo FS on the Cariboo Gold Project. 1. Refer to the Cariboo Technical Report for the assumptions, qualifications and limitations relating to disclosure about the 2025 Cariboo FS on the Cariboo Gold Project. Mineral reserves include probable reserves 2.071 Moz Au (17.815 Mt grading 3.62 g/t Au). Mineral resources include in the measured category, 8 koz Au (47 kt grading 5.06 g/t Au); in Indicated, 1.604 Moz Au (17.332 Mt grading 2.88 g/t Au); in Inferred, 1.864 Moz Au (18.774 Mt grading 3.09 g/t Au). M&I resources are exclusive of mineral reserves. 2. Refer to OGG news release dated September 14, 2026 (Osisko Gold Announces Formal Construction Decision and Development Update for the Cariboo Gold Project). OGG NYSE TSXV -
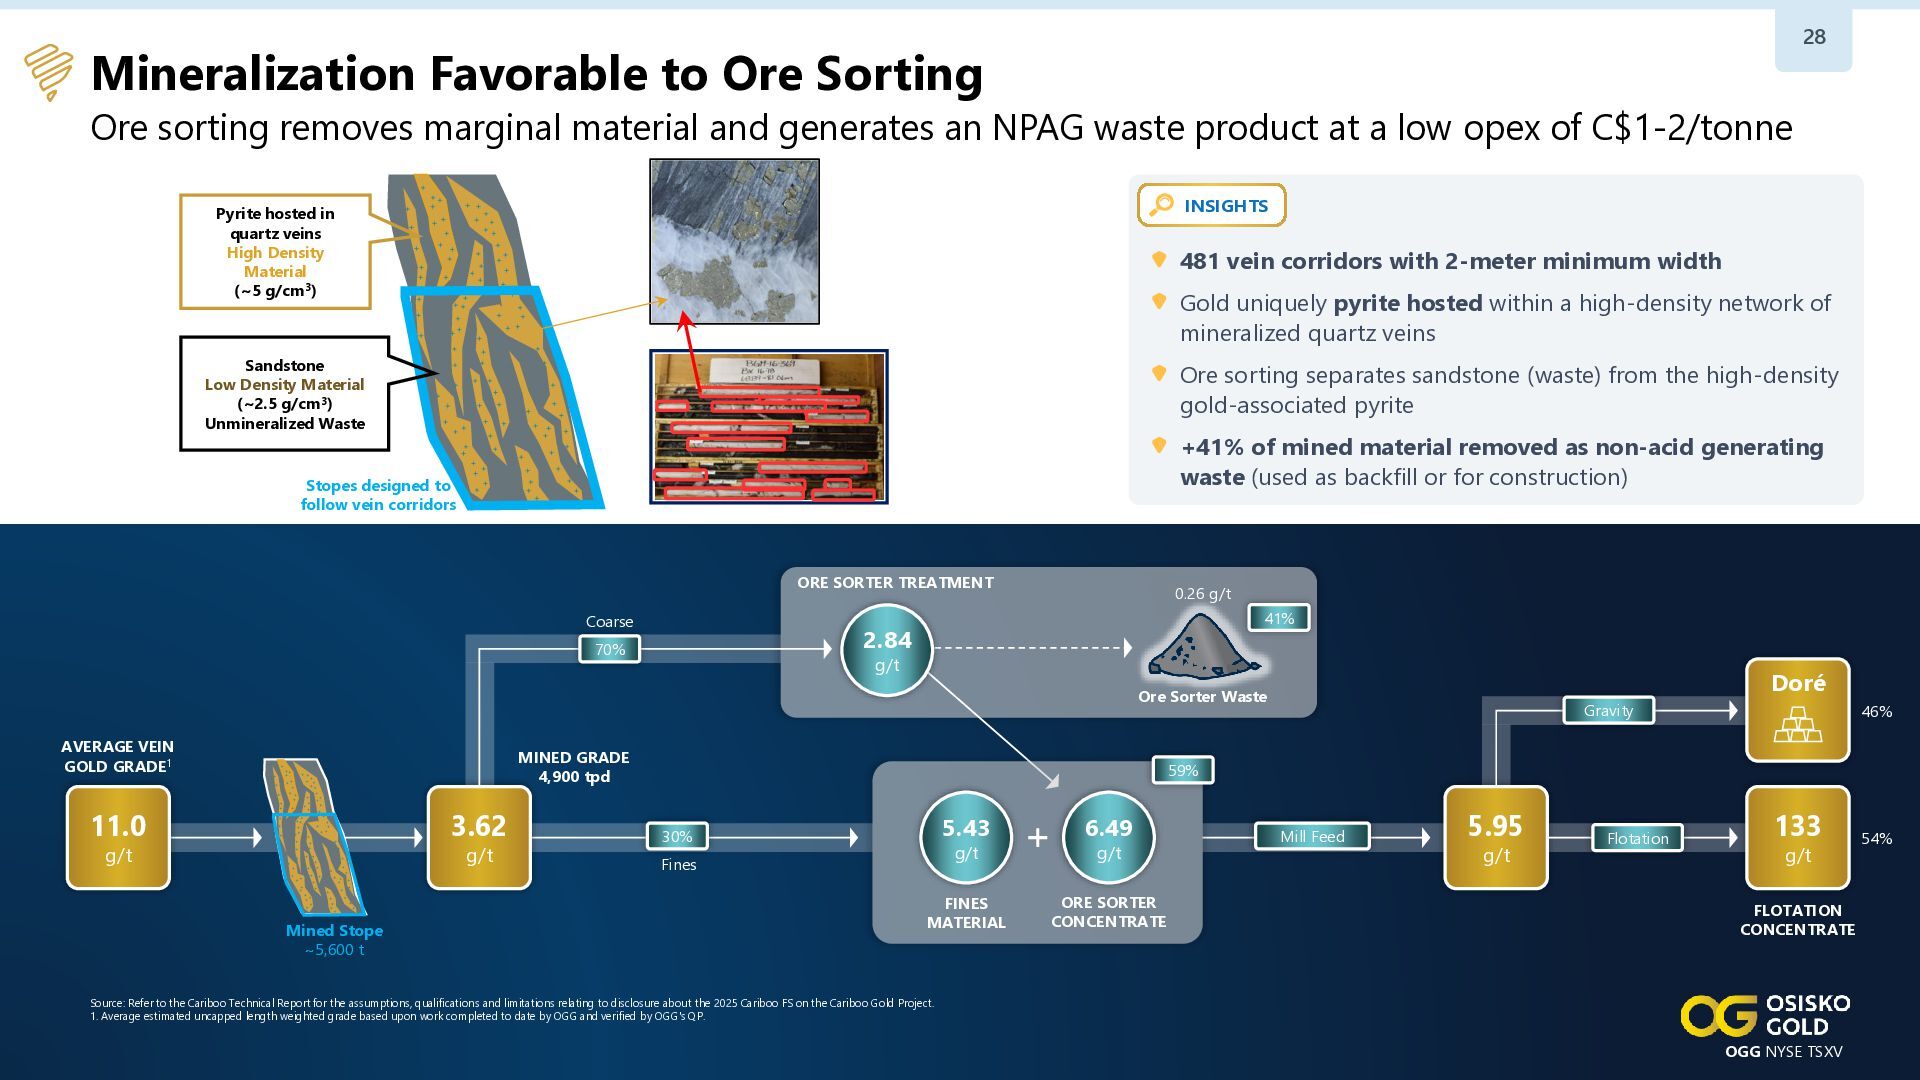
28 Mineralization Favorable to Ore Sorting Ore sorting removes marginal
material and generates an NPAG waste product at a low opex of C$1-2/tonne INSIGHTS Pyrite hosted in quartz veins High Density Material (~5 g/cm3) 481 vein corridors with 2-meter minimum width Gold uniquely pyrite hosted within a high-density network of mineralized quartz veins Sandstone Low Density Material (~2.5 g/cm3) Unmineralized Waste Ore sorting separates sandstone (waste) from the high-density gold-associated pyrite +41% of mined material removed as non-acid generating waste (used as backfill or for construction) Stopes designed to follow vein corridors ORE SORTER TREATMENT Coarse 0.26 g/t 41% 2.84 70% g/t Doré Ore Sorter Waste AVERAGE VEIN GOLD GRADE1 MINED GRADE 4,900 tpd 11.0 3.62 g/t g/t Mined Stope ~5,600 t Gravity 46% 59% 5.43 6.49 FINES MATERIAL ORE SORTER CONCENTRATE 30% g/t Fines g/t Mill Feed 5.95 g/t Flotation 133 g/t FLOTATION CONCENTRATE Source: Refer to the Cariboo Technical Report for the assumptions, qualifications and limitations relating to disclosure about the 2025 Cariboo FS on the Cariboo Gold Project. 1. Average estimated uncapped length weighted grade based upon work completed to date by OGG and verified by OGG's QP. OGG NYSE TSXV 54% -
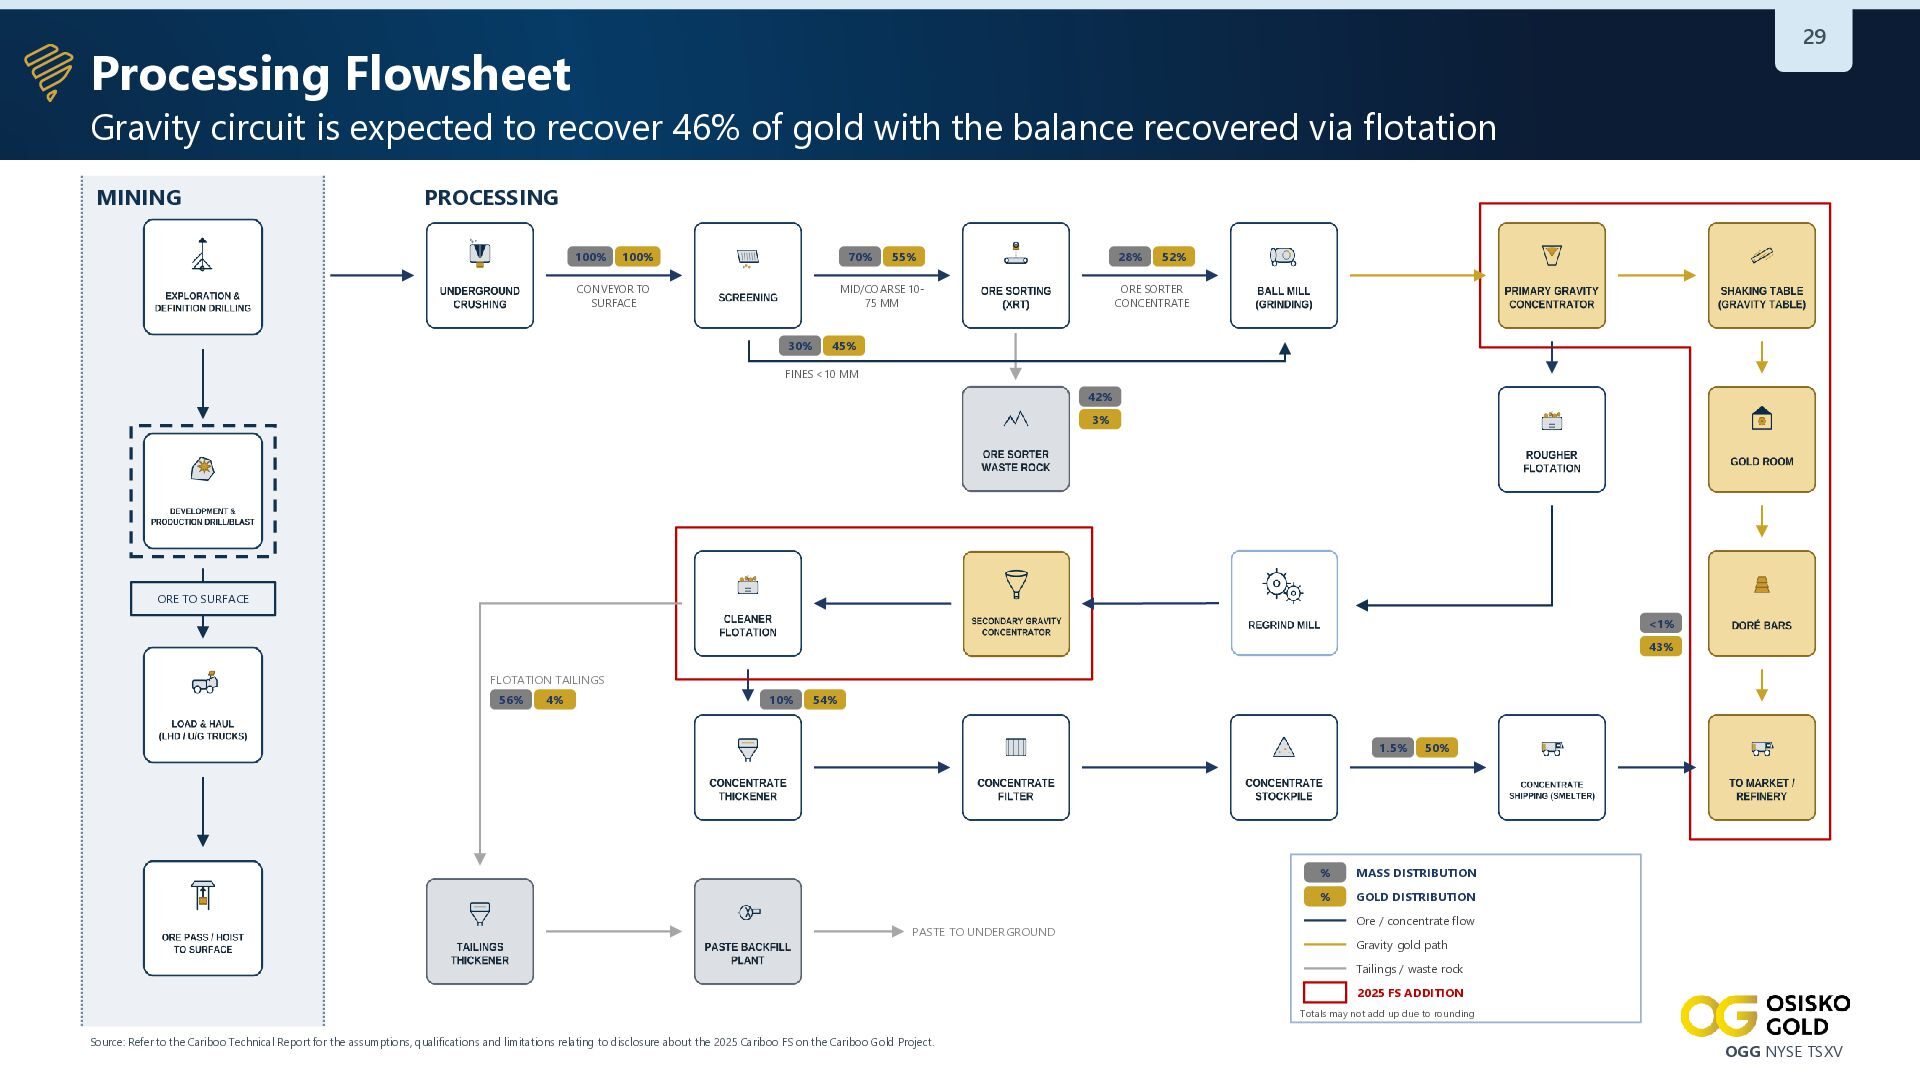
29 Processing Flowsheet Gravity circuit is expected to recover 46%
of gold with the balance recovered via flotation MINING PROCESSING 100% 100% 70% CONVEYOR TO SURFACE 55% 28% MID/COARSE 1075 MM 30% 52% ORE SORTER CONCENTRATE 45% FINES <10 MM 42% 3% ORE TO SURFACE <1% 43% FLOTATION TAILINGS 56% 4% 10% 54% 1.5% PASTE TO UNDERGROUND 50% % MASS DISTRIBUTION % GOLD DISTRIBUTION Ore / concentrate flow Gravity gold path Tailings / waste rock 2025 FS ADDITION Totals may not add up due to rounding Source: Refer to the Cariboo Technical Report for the assumptions, qualifications and limitations relating to disclosure about the 2025 Cariboo FS on the Cariboo Gold Project. OGG NYSE TSXV -
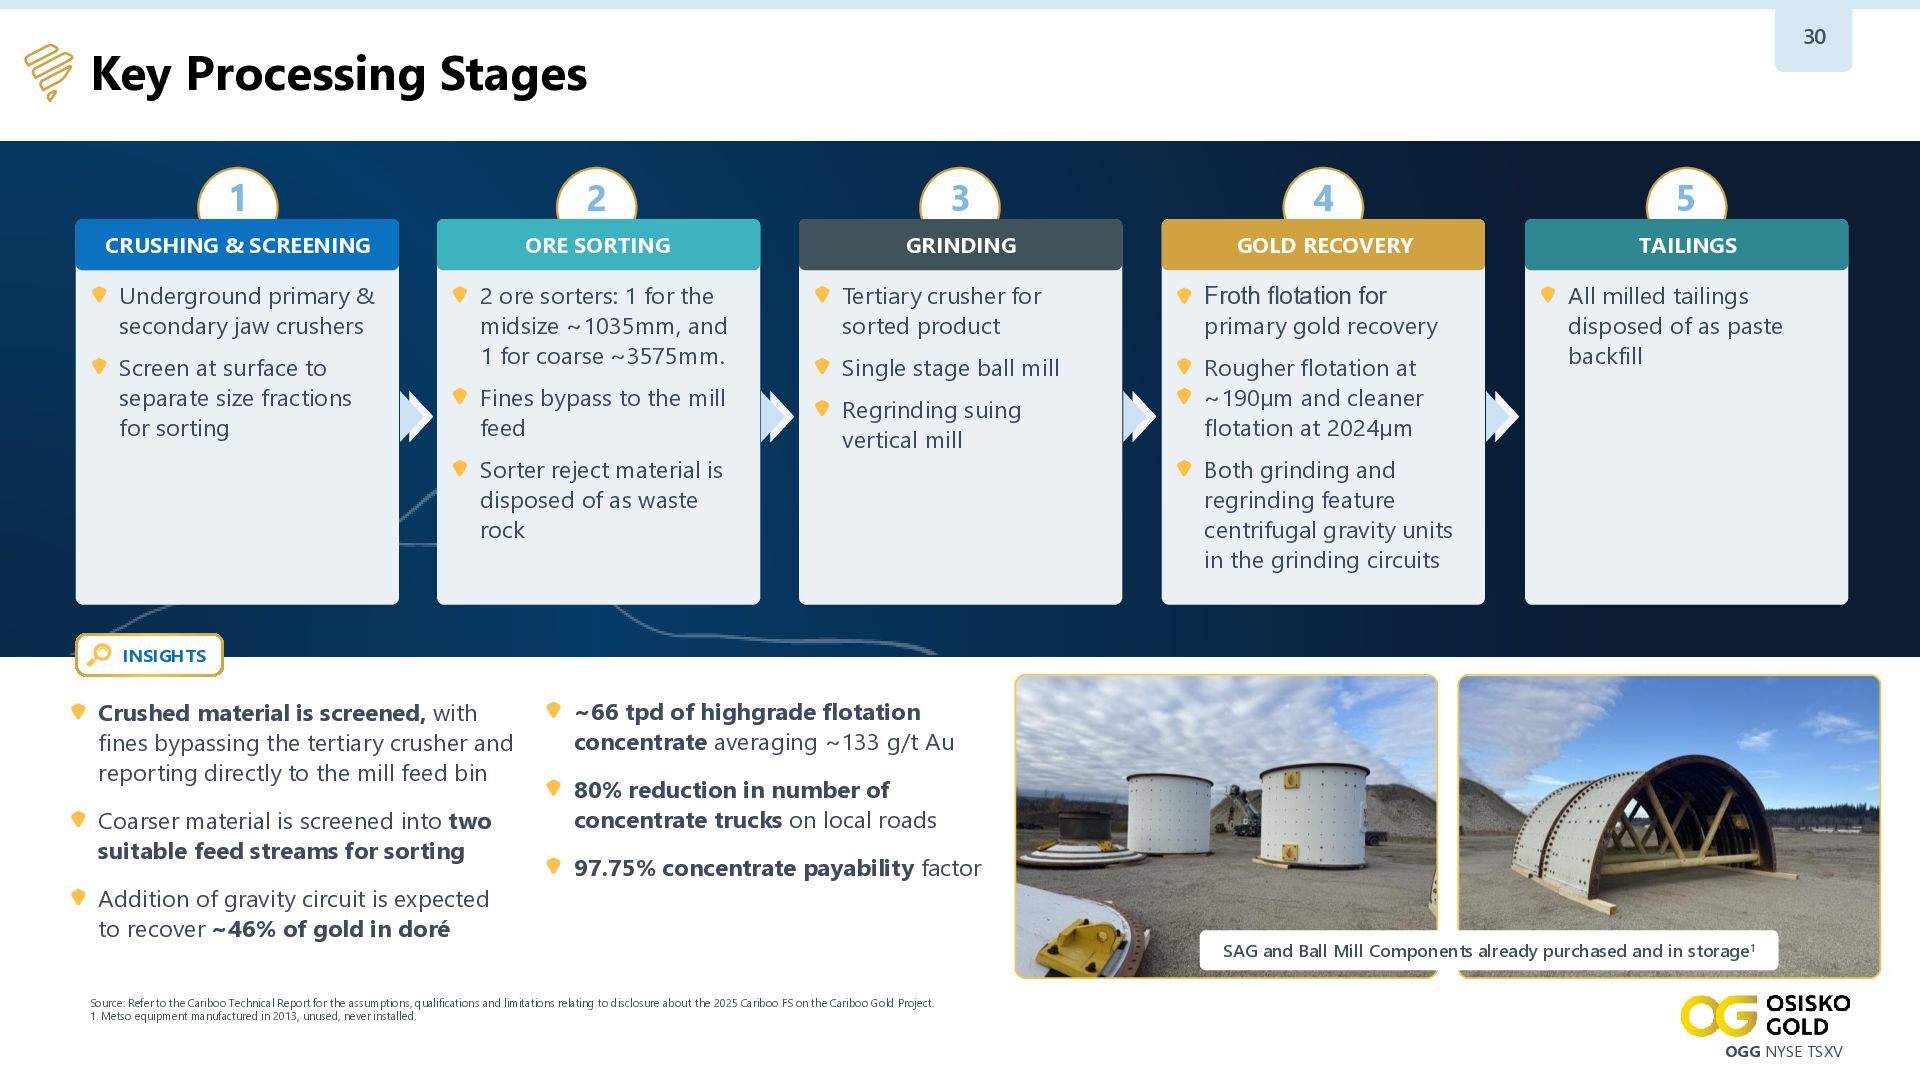
30 Key Processing Stages 1 2 3 4 5 CRUSHING
& SCREENING ORE SORTING GRINDING GOLD RECOVERY TAILINGS Underground primary & secondary jaw crushers 2 ore sorters: 1 for the midsize ~1035mm, and 1 for coarse ~3575mm. Tertiary crusher for sorted product Froth flotation for primary gold recovery Fines bypass to the mill feed Single stage ball mill Regrinding suing vertical mill Rougher flotation at ~190µm and cleaner flotation at 2024µm All milled tailings disposed of as paste backfill Screen at surface to separate size fractions for sorting Sorter reject material is disposed of as waste rock Both grinding and regrinding feature centrifugal gravity units in the grinding circuits INSIGHTS Crushed material is screened, with fines bypassing the tertiary crusher and reporting directly to the mill feed bin Coarser material is screened into two suitable feed streams for sorting ~66 tpd of highgrade flotation concentrate averaging ~133 g/t Au 80% reduction in number of concentrate trucks on local roads 97.75% concentrate payability factor Addition of gravity circuit is expected to recover ~46% of gold in doré SAG and Ball Mill Components already purchased and in storage1 Source: Refer to the Cariboo Technical Report for the assumptions, qualifications and limitations relating to disclosure about the 2025 Cariboo FS on the Cariboo Gold Project. 1. Metso equipment manufactured in 2013, unused, never installed. OGG NYSE TSXV -
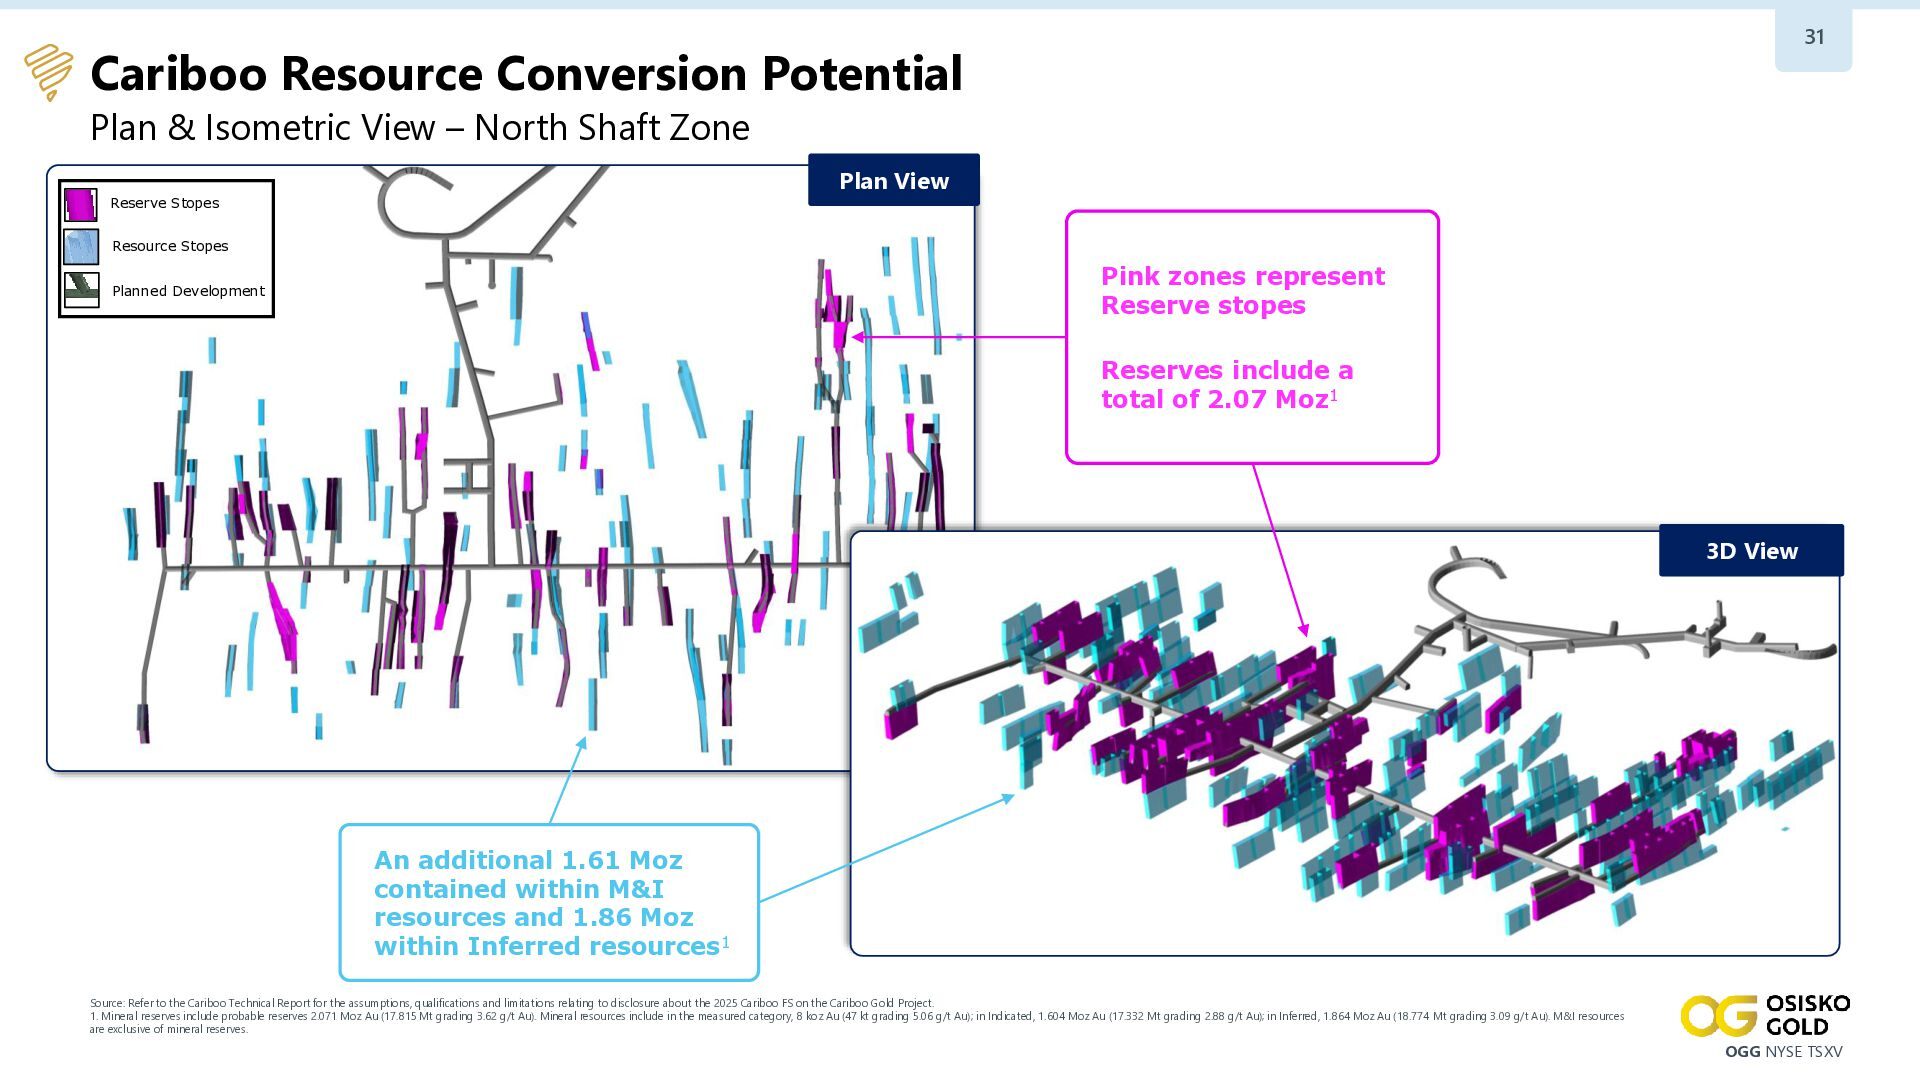
31 Cariboo Resource Conversion Potential Plan & Isometric View –
North Shaft Zone Plan View Reserve Stopes Resource Stopes Pink zones represent Reserve stopes Planned Development Reserves include a total of 2.07 Moz1 3D View An additional 1.61 Moz contained within M&I resources and 1.86 Moz within Inferred resources1 Source: Refer to the Cariboo Technical Report for the assumptions, qualifications and limitations relating to disclosure about the 2025 Cariboo FS on the Cariboo Gold Project. 1. Mineral reserves include probable reserves 2.071 Moz Au (17.815 Mt grading 3.62 g/t Au). Mineral resources include in the measured category, 8 koz Au (47 kt grading 5.06 g/t Au); in Indicated, 1.604 Moz Au (17.332 Mt grading 2.88 g/t Au); in Inferred, 1.864 Moz Au (18.774 Mt grading 3.09 g/t Au). M&I resources are exclusive of mineral reserves. OGG NYSE TSXV -
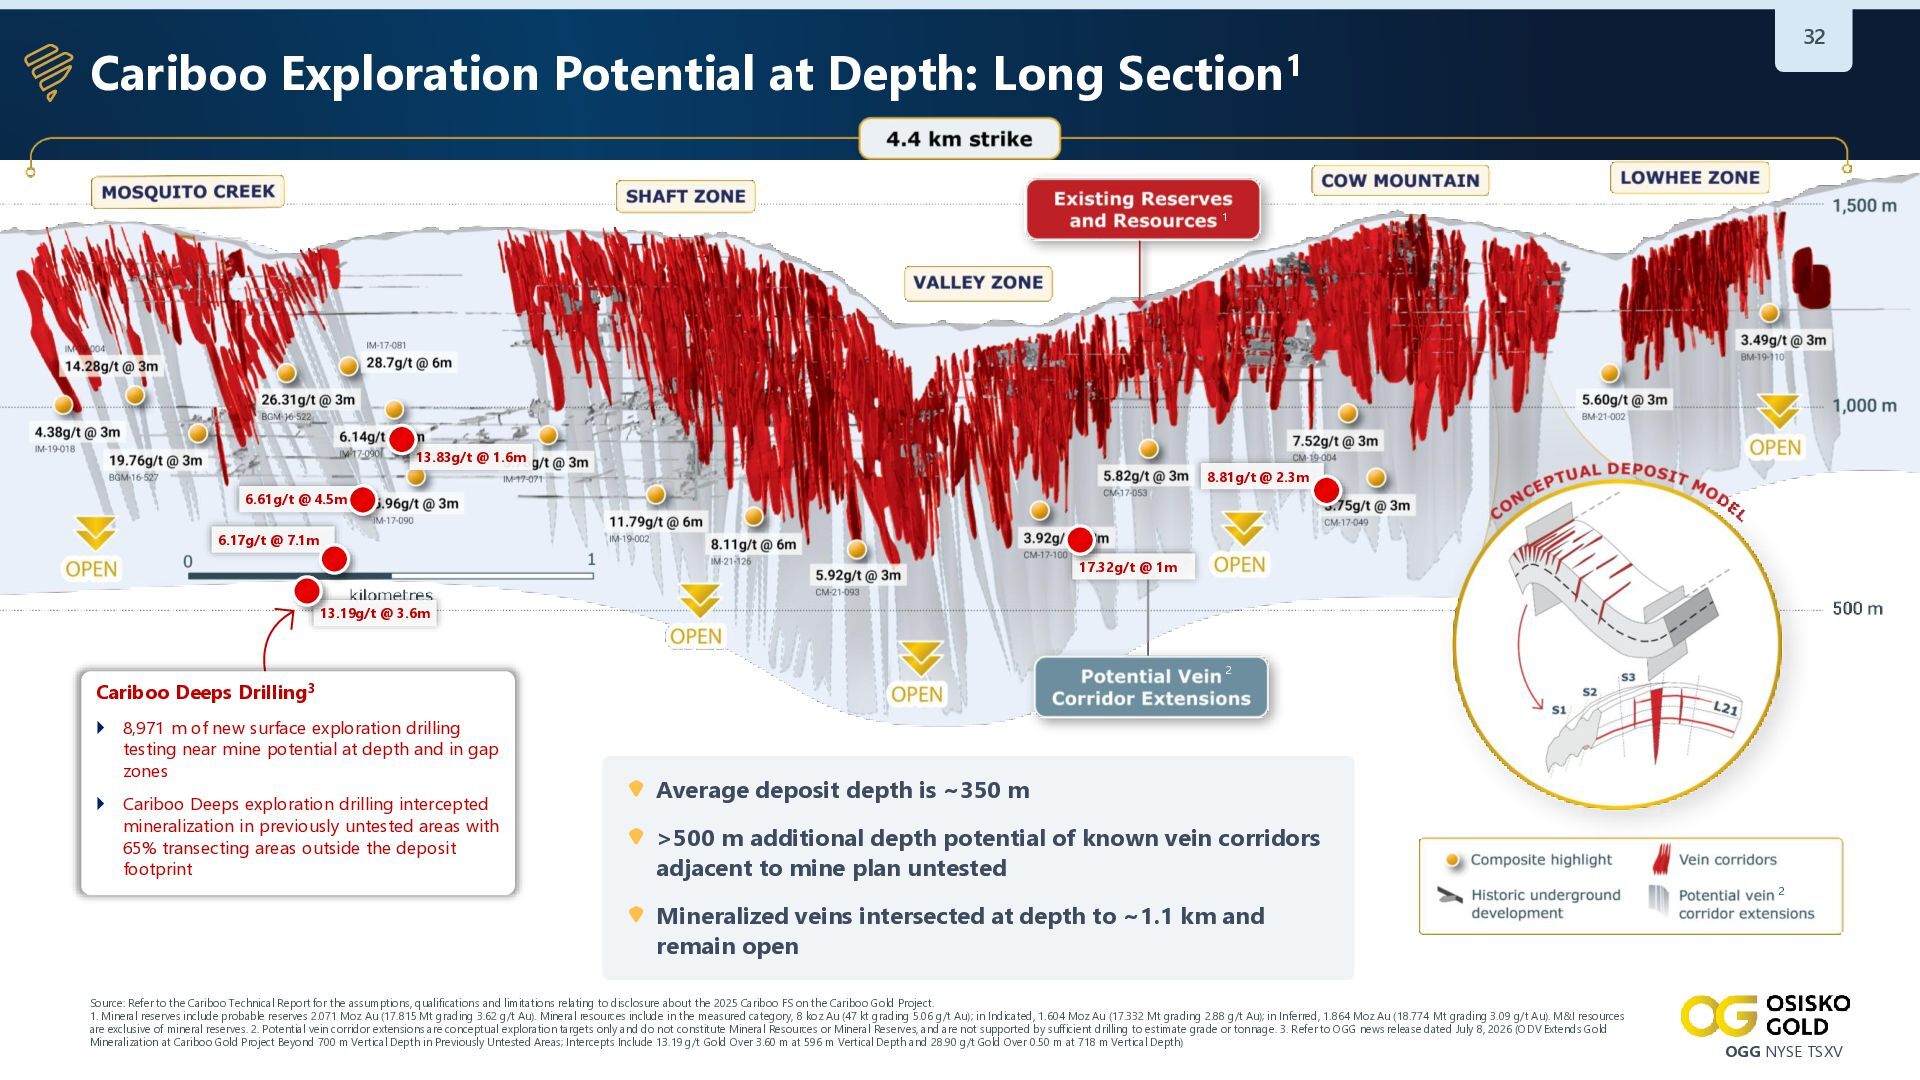
32 Cariboo Exploration Potential at Depth: Long Section1 1 13.83g/t
@ 1.6m 8.81g/t @ 2.3m 6.61g/t @ 4.5m 6.17g/t @ 7.1m 17.32g/t @ 1m 13.19g/t @ 3.6m 2 Cariboo Deeps Drilling3 8,971 m of new surface exploration drilling testing near mine potential at depth and in gap zones Cariboo Deeps exploration drilling intercepted mineralization in previously untested areas with 65% transecting areas outside the deposit footprint Average deposit depth is ~350 m >500 m additional depth potential of known vein corridors adjacent to mine plan untested 2 Mineralized veins intersected at depth to ~1.1 km and remain open Source: Refer to the Cariboo Technical Report for the assumptions, qualifications and limitations relating to disclosure about the 2025 Cariboo FS on the Cariboo Gold Project. 1. Mineral reserves include probable reserves 2.071 Moz Au (17.815 Mt grading 3.62 g/t Au). Mineral resources include in the measured category, 8 koz Au (47 kt grading 5.06 g/t Au); in Indicated, 1.604 Moz Au (17.332 Mt grading 2.88 g/t Au); in Inferred, 1.864 Moz Au (18.774 Mt grading 3.09 g/t Au). M&I resources are exclusive of mineral reserves. 2. Potential vein corridor extensions are conceptual exploration targets only and do not constitute Mineral Resources or Mineral Reserves, and are not supported by sufficient drilling to estimate grade or tonnage. 3. Refer to OGG news release dated July 8, 2026 (ODV Extends Gold Mineralization at Cariboo Gold Project Beyond 700 m Vertical Depth in Previously Untested Areas; Intercepts Include 13.19 g/t Gold Over 3.60 m at 596 m Vertical Depth and 28.90 g/t Gold Over 0.50 m at 718 m Vertical Depth) OGG NYSE TSXV -
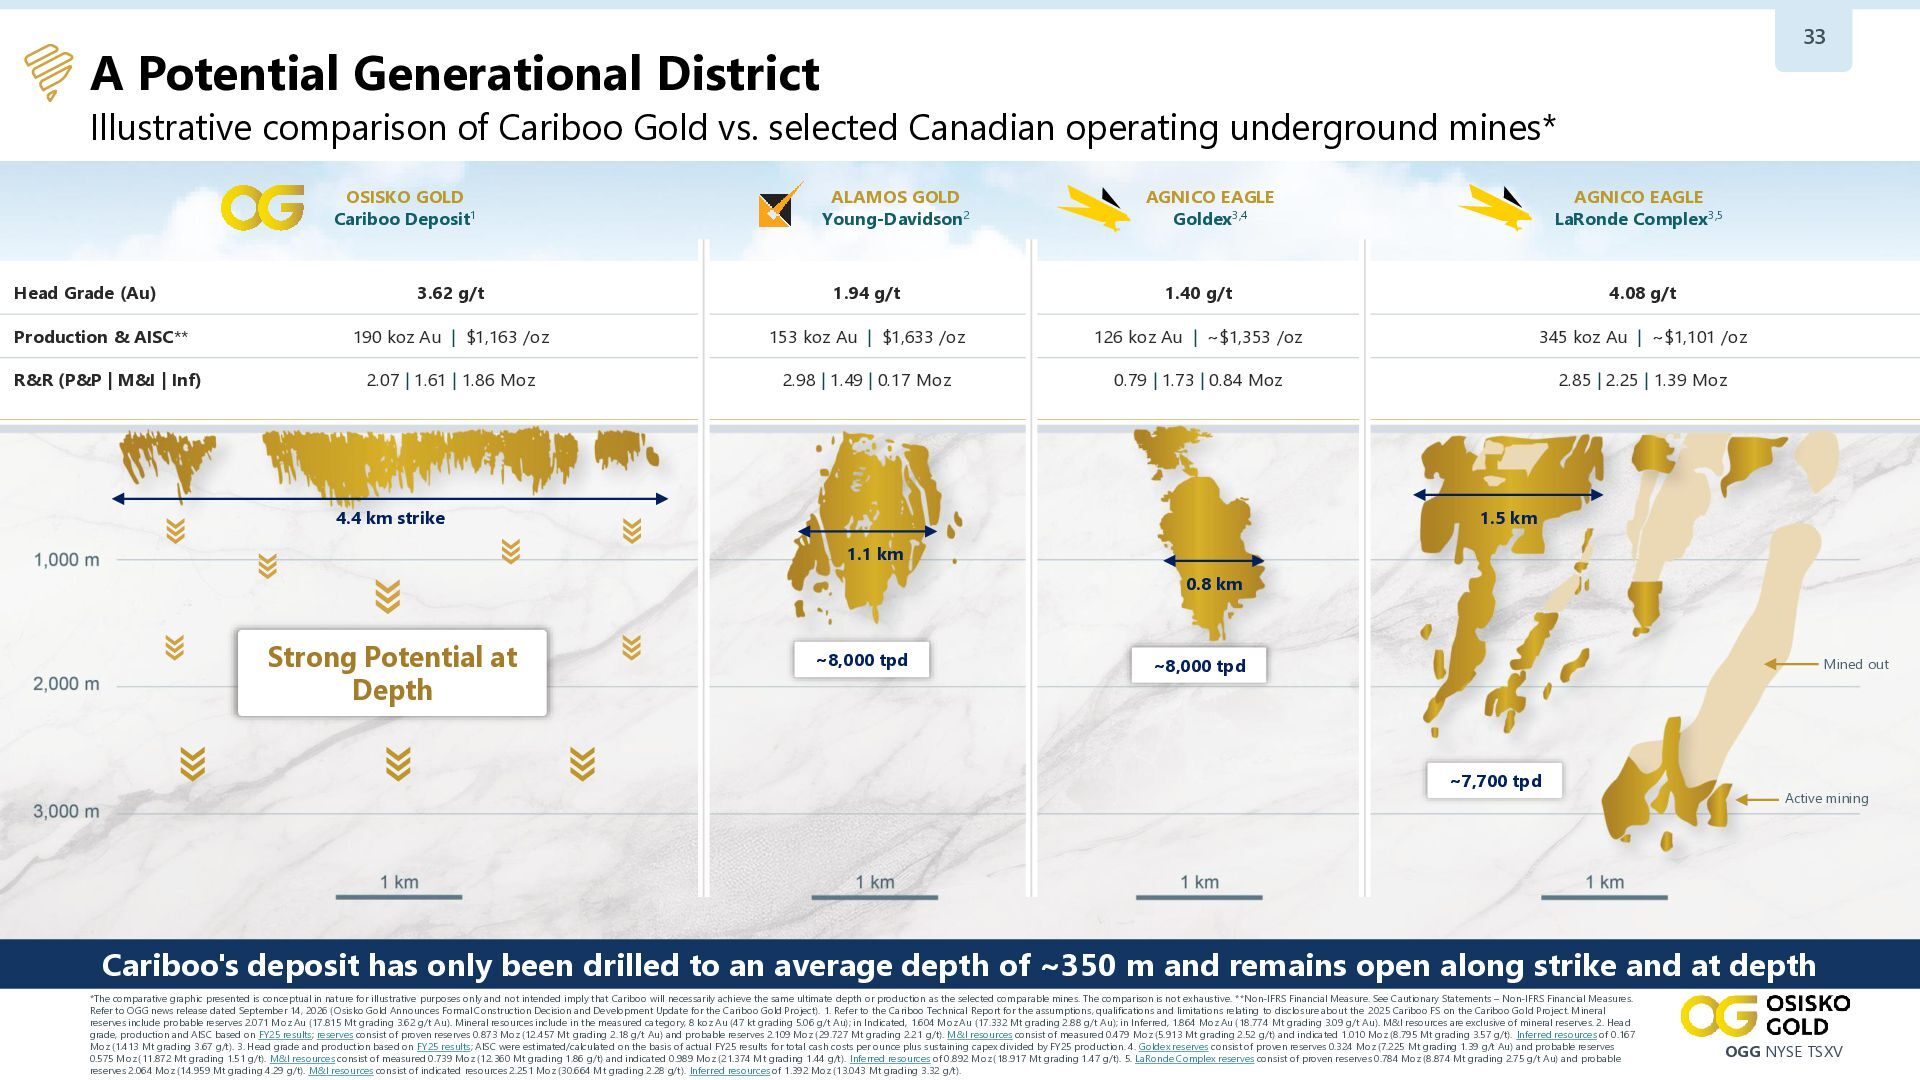
33 A Potential Generational District Illustrative comparison of Cariboo Gold
vs. selected Canadian operating underground mines* OSISKO GOLD Cariboo Deposit1 Head Grade (Au) ALAMOS GOLD Young-Davidson2 AGNICO EAGLE Goldex3,4 AGNICO EAGLE LaRonde Complex3,5 3.62 g/t 1.94 g/t 1.40 g/t 4.08 g/t Production & AISC** 190 koz Au | $1,163 /oz 153 koz Au | $1,633 /oz 126 koz Au | ~$1,353 /oz 345 koz Au | ~$1,101 /oz R&R (P&P | M&I | Inf) 2.07 | 1.61 | 1.86 Moz 2.98 | 1.49 | 0.17 Moz 0.79 | 1.73 | 0.84 Moz 2.85 | 2.25 | 1.39 Moz 1.5 km 4.4 km strike 1.1 km 0.8 km Strong Potential at Depth ~8,000 tpd ~8,000 tpd Mined out ~7,700 tpd Active mining Cariboo's deposit has only been drilled to an average depth of ~350 m and remains open along strike and at depth *The comparative graphic presented is conceptual in nature for illustrative purposes only and not intended imply that Cariboo will necessarily achieve the same ultimate depth or production as the selected comparable mines. The comparison is not exhaustive. **Non-IFRS Financial Measure. See Cautionary Statements – Non-IFRS Financial Measures. Refer to OGG news release dated September 14, 2026 (Osisko Gold Announces Formal Construction Decision and Development Update for the Cariboo Gold Project). 1. Refer to the Cariboo Technical Report for the assumptions, qualifications and limitations relating to disclosure about the 2025 Cariboo FS on the Cariboo Gold Project. Mineral reserves include probable reserves 2.071 Moz Au (17.815 Mt grading 3.62 g/t Au). Mineral resources include in the measured category, 8 koz Au (47 kt grading 5.06 g/t Au); in Indicated, 1.604 Moz Au (17.332 Mt grading 2.88 g/t Au); in Inferred, 1.864 Moz Au (18.774 Mt grading 3.09 g/t Au). M&I resources are exclusive of mineral reserves. 2. Head grade, production and AISC based on FY25 results; reserves consist of proven reserves 0.873 Moz (12.457 Mt grading 2.18 g/t Au) and probable reserves 2.109 Moz (29.727 Mt grading 2.21 g/t). M&I resources consist of measured 0.479 Moz (5.913 Mt grading 2.52 g/t) and indicated 1.010 Moz (8.795 Mt grading 3.57 g/t). Inferred resources of 0.167 Moz (1.413 Mt grading 3.67 g/t). 3. Head grade and production based on FY25 results; AISC were estimated/calculated on the basis of actual FY25 results for total cash costs per ounce plus sustaining capex divided by FY25 production. 4. Goldex reserves consist of proven reserves 0.324 Moz (7.225 Mt grading 1.39 g/t Au) and probable reserves 0.575 Moz (11.872 Mt grading 1.51 g/t). M&I resources consist of measured 0.739 Moz (12.360 Mt grading 1.86 g/t) and indicated 0.989 Moz (21.374 Mt grading 1.44 g/t). Inferred resources of 0.892 Moz (18.917 Mt grading 1.47 g/t). 5. LaRonde Complex reserves consist of proven reserves 0.784 Moz (8.874 Mt grading 2.75 g/t Au) and probable reserves 2.064 Moz (14.959 Mt grading 4.29 g/t). M&I resources consist of indicated resources 2.251 Moz (30.664 Mt grading 2.28 g/t). Inferred resources of 1.392 Moz (13.043 Mt grading 3.32 g/t). OGG NYSE TSXV -
34 An Emerging Mineralized System at Proserpine 14 km trend
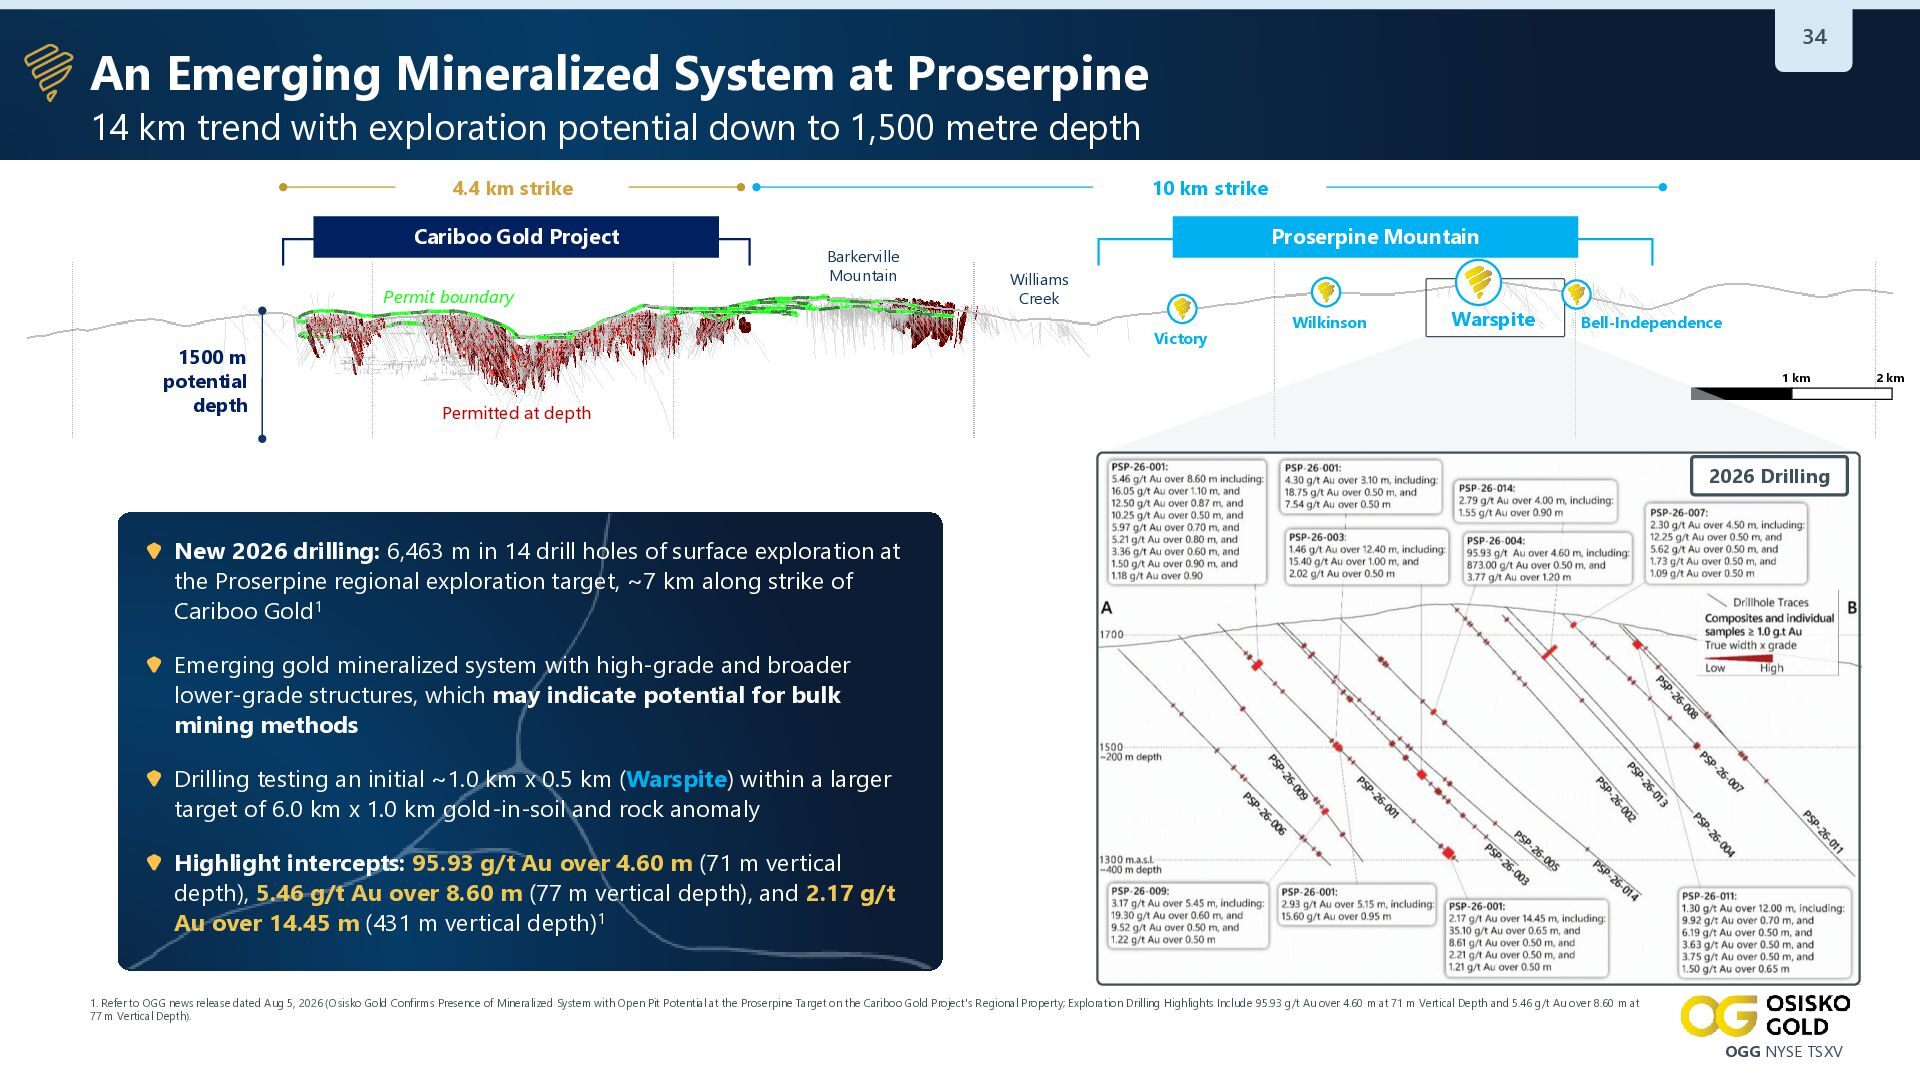
with exploration potential down to 1,500 metre depth 4.4 km strike Cariboo Gold Project Permit boundary 1500 m potential depth 10 km strike Barkerville Mountain Proserpine Mountain Williams Creek Victory Wilkinson Warspite Bell-Independence 1 km Permitted at depth 2026 Drilling New 2026 drilling: 6,463 m in 14 drill holes of surface exploration at the Proserpine regional exploration target, ~7 km along strike of Cariboo Gold1 Emerging gold mineralized system with high-grade and broader lower-grade structures, which may indicate potential for bulk mining methods Drilling testing an initial ~1.0 km x 0.5 km (Warspite) within a larger target of 6.0 km x 1.0 km gold-in-soil and rock anomaly Highlight intercepts: 95.93 g/t Au over 4.60 m (71 m vertical depth), 5.46 g/t Au over 8.60 m (77 m vertical depth), and 2.17 g/t Au over 14.45 m (431 m vertical depth)1 1. Refer to OGG news release dated Aug 5, 2026 (Osisko Gold Confirms Presence of Mineralized System with Open Pit Potential at the Proserpine Target on the Cariboo Gold Project's Regional Property; Exploration Drilling Highlights Include 95.93 g/t Au over 4.60 m at 71 m Vertical Depth and 5.46 g/t Au over 8.60 m at 77 m Vertical Depth). OGG NYSE TSXV 2 km -
35 Cariboo Regional Upside Cariboo hosts two main trends over
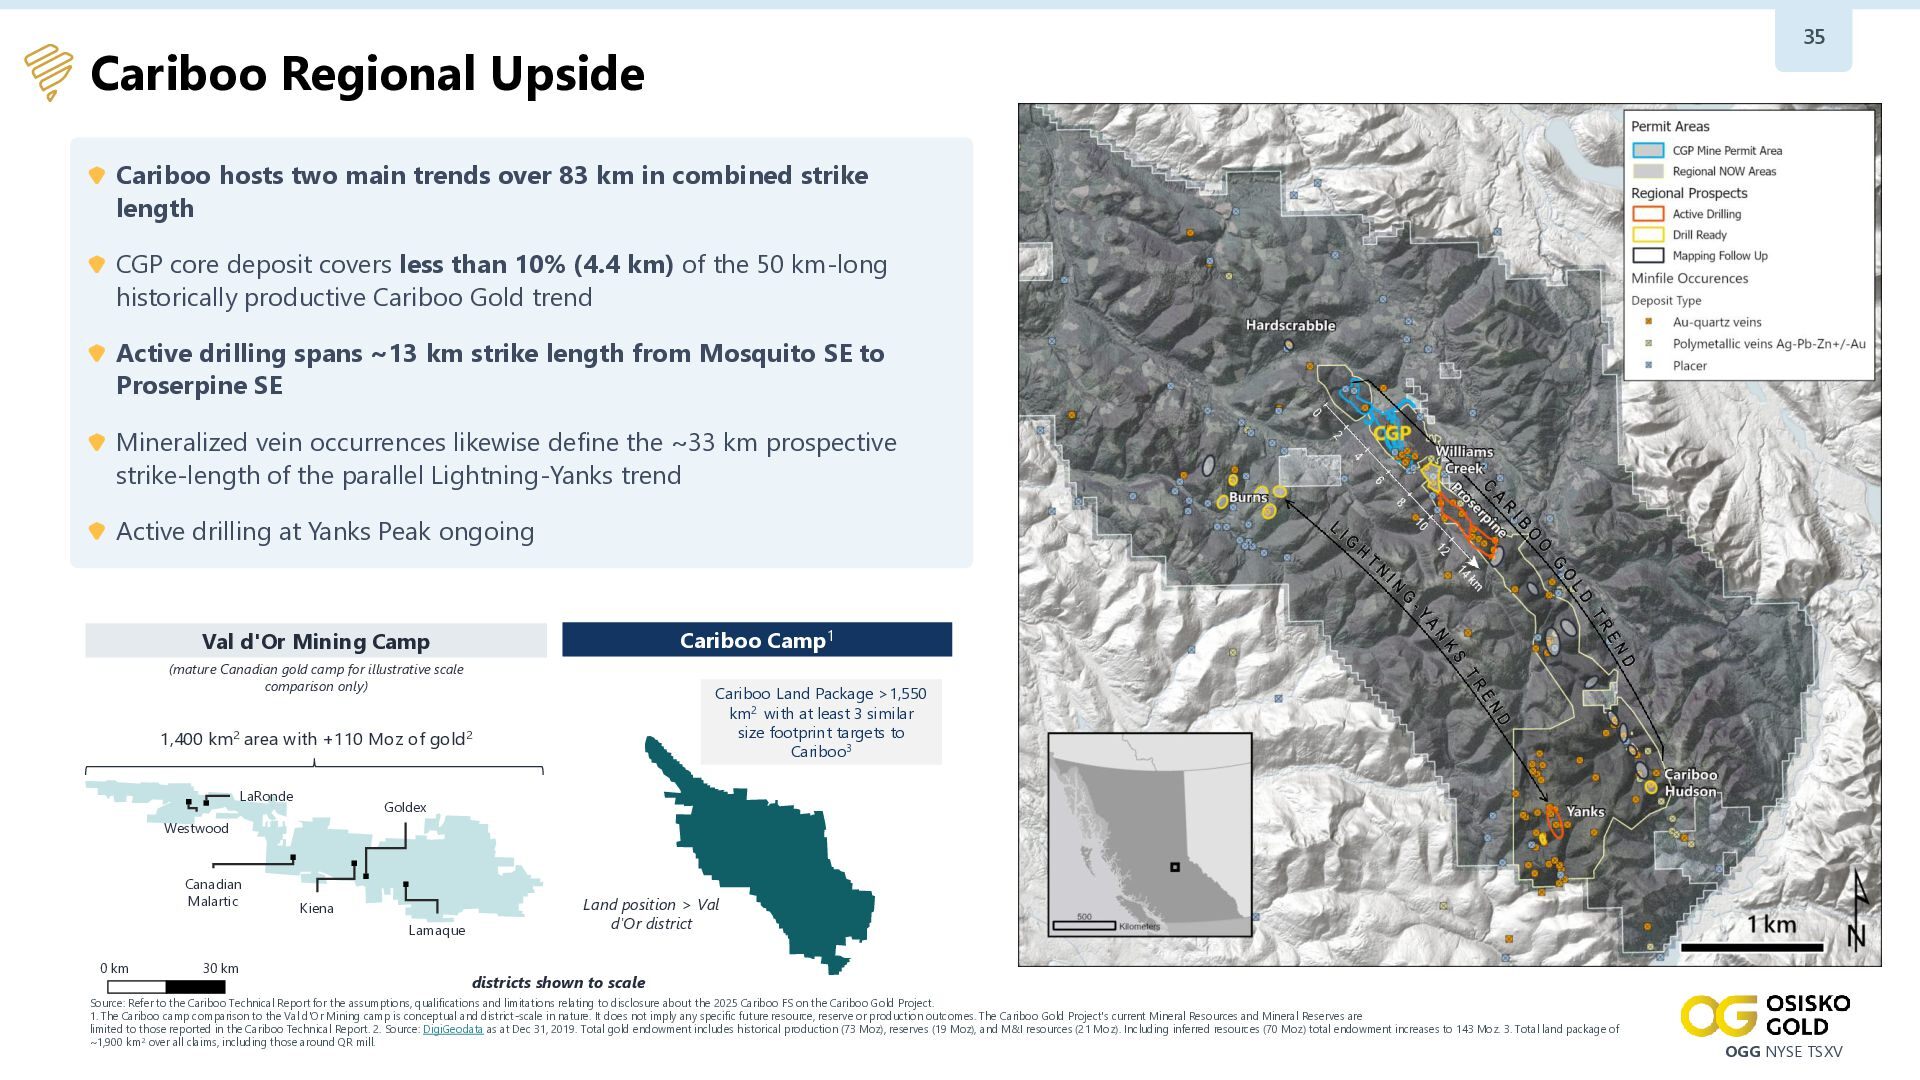
83 km in combined strike length CGP core deposit covers less than 10% (4.4 km) of the 50 km-long historically productive Cariboo Gold trend Active drilling spans ~13 km strike length from Mosquito SE to Proserpine SE Mineralized vein occurrences likewise define the ~33 km prospective strike-length of the parallel Lightning-Yanks trend Active drilling at Yanks Peak ongoing Cariboo Camp1 Val d'Or Mining Camp (mature Canadian gold camp for illustrative scale comparison only) Cariboo Land Package >1,550 km2 with at least 3 similar size footprint targets to Cariboo3 1,400 km2 area with +110 Moz of gold2 LaRonde Goldex Westwood Canadian Malartic Kiena Lamaque 0 km 30 km Land position > Val d'Or district districts shown to scale Source: Refer to the Cariboo Technical Report for the assumptions, qualifications and limitations relating to disclosure about the 2025 Cariboo FS on the Cariboo Gold Project. 1. The Cariboo camp comparison to the Val d'Or Mining camp is conceptual and district-scale in nature. It does not imply any specific future resource, reserve or production outcomes. The Cariboo Gold Project's current Mineral Resources and Mineral Reserves are limited to those reported in the Cariboo Technical Report. 2. Source: DigiGeodata as at Dec 31, 2019. Total gold endowment includes historical production (73 Moz), reserves (19 Moz), and M&I resources (21 Moz). Including inferred resources (70 Moz) total endowment increases to 143 Moz. 3. Total land package of ~1,900 km2 over all claims, including those around QR mill. OGG NYSE TSXV -
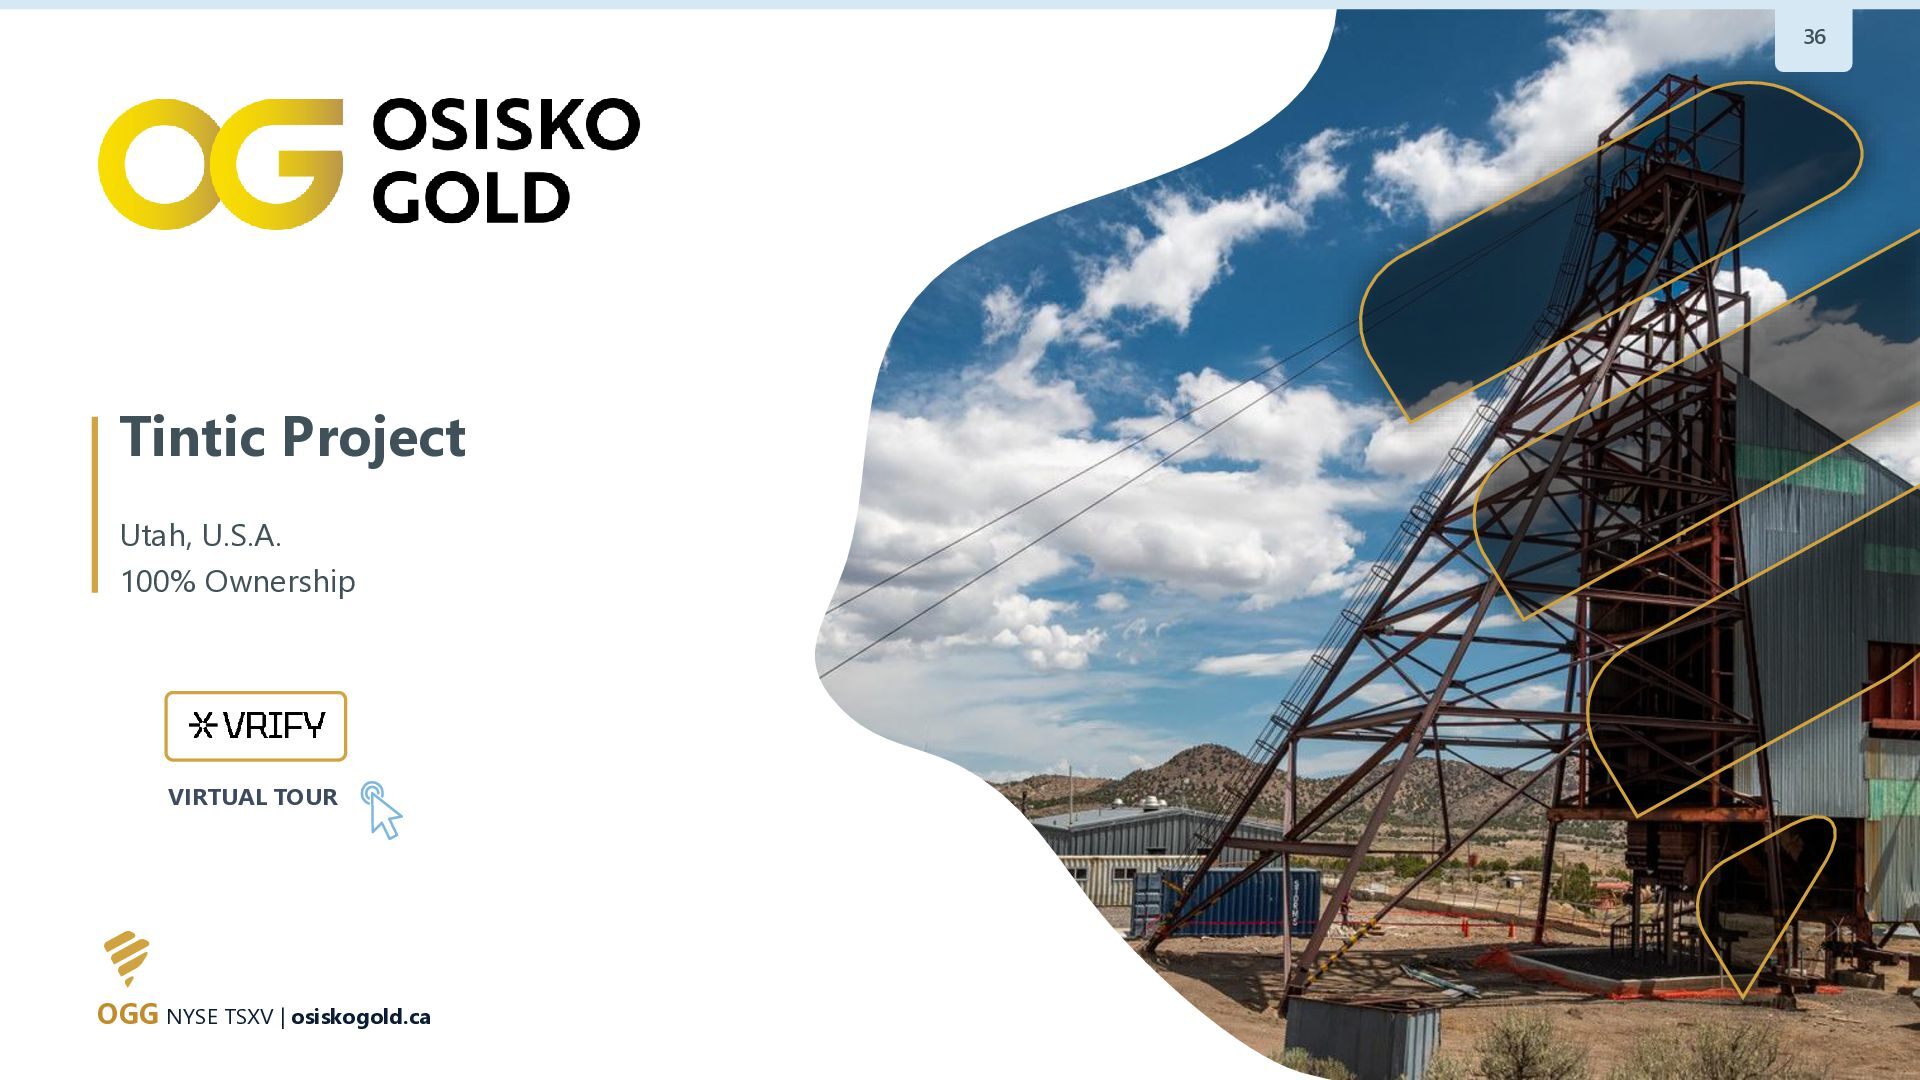
36 Tintic Project Utah, U.S.A. 100% Ownership VIRTUAL TOUR VIRTUAL
TOUR OGG NYSE TSXV | osiskogold.ca -
37 Tintic Project: Asset Snapshot Highly Productive Historical Mining District
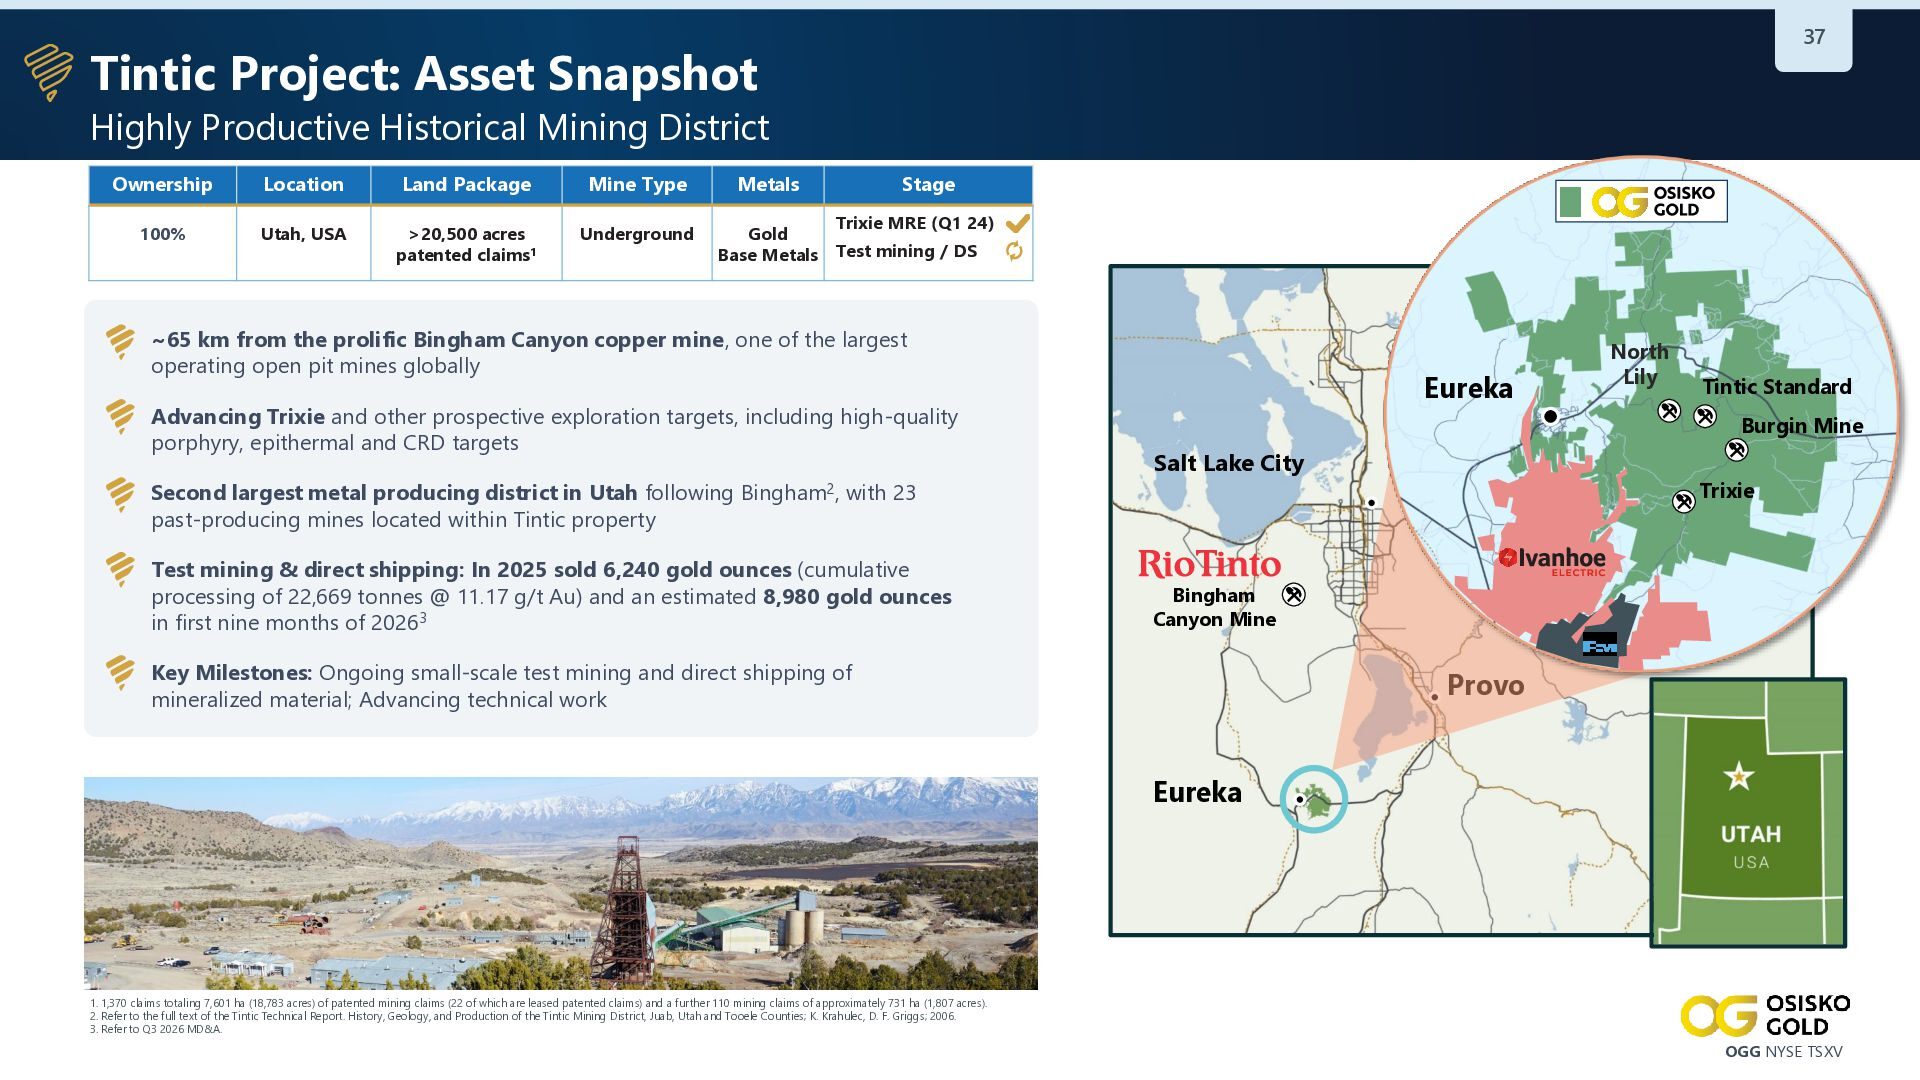
Ownership Location Land Package Mine Type 100% Utah, USA >20,500 acres patented claims1 Underground Metals Stage Trixie MRE (Q1 24) Gold Base Metals Test mining / DS ~65 km from the prolific Bingham Canyon copper mine, one of the largest operating open pit mines globally Advancing Trixie and other prospective exploration targets, including high-quality porphyry, epithermal and CRD targets Eureka North Lily Tintic Standard Burgin Mine Salt Lake City Trixie Second largest metal producing district in Utah following Bingham2, with 23 past-producing mines located within Tintic property Test mining & direct shipping: In 2025 sold 6,240 gold ounces (cumulative processing of 22,669 tonnes @ 11.17 g/t Au) and an estimated 8,980 gold ounces in first nine months of 20263 Bingham Canyon Mine Key Milestones: Ongoing small-scale test mining and direct shipping of mineralized material; Advancing technical work Provo Eureka 1. 1,370 claims totaling 7,601 ha (18,783 acres) of patented mining claims (22 of which are leased patented claims) and a further 110 mining claims of approximately 731 ha (1,807 acres). 2. Refer to the full text of the Tintic Technical Report. History, Geology, and Production of the Tintic Mining District, Juab, Utah and Tooele Counties; K. Krahulec, D. F. Griggs; 2006. 3. Refer to Q3 2026 MD&A. OGG NYSE TSXV -
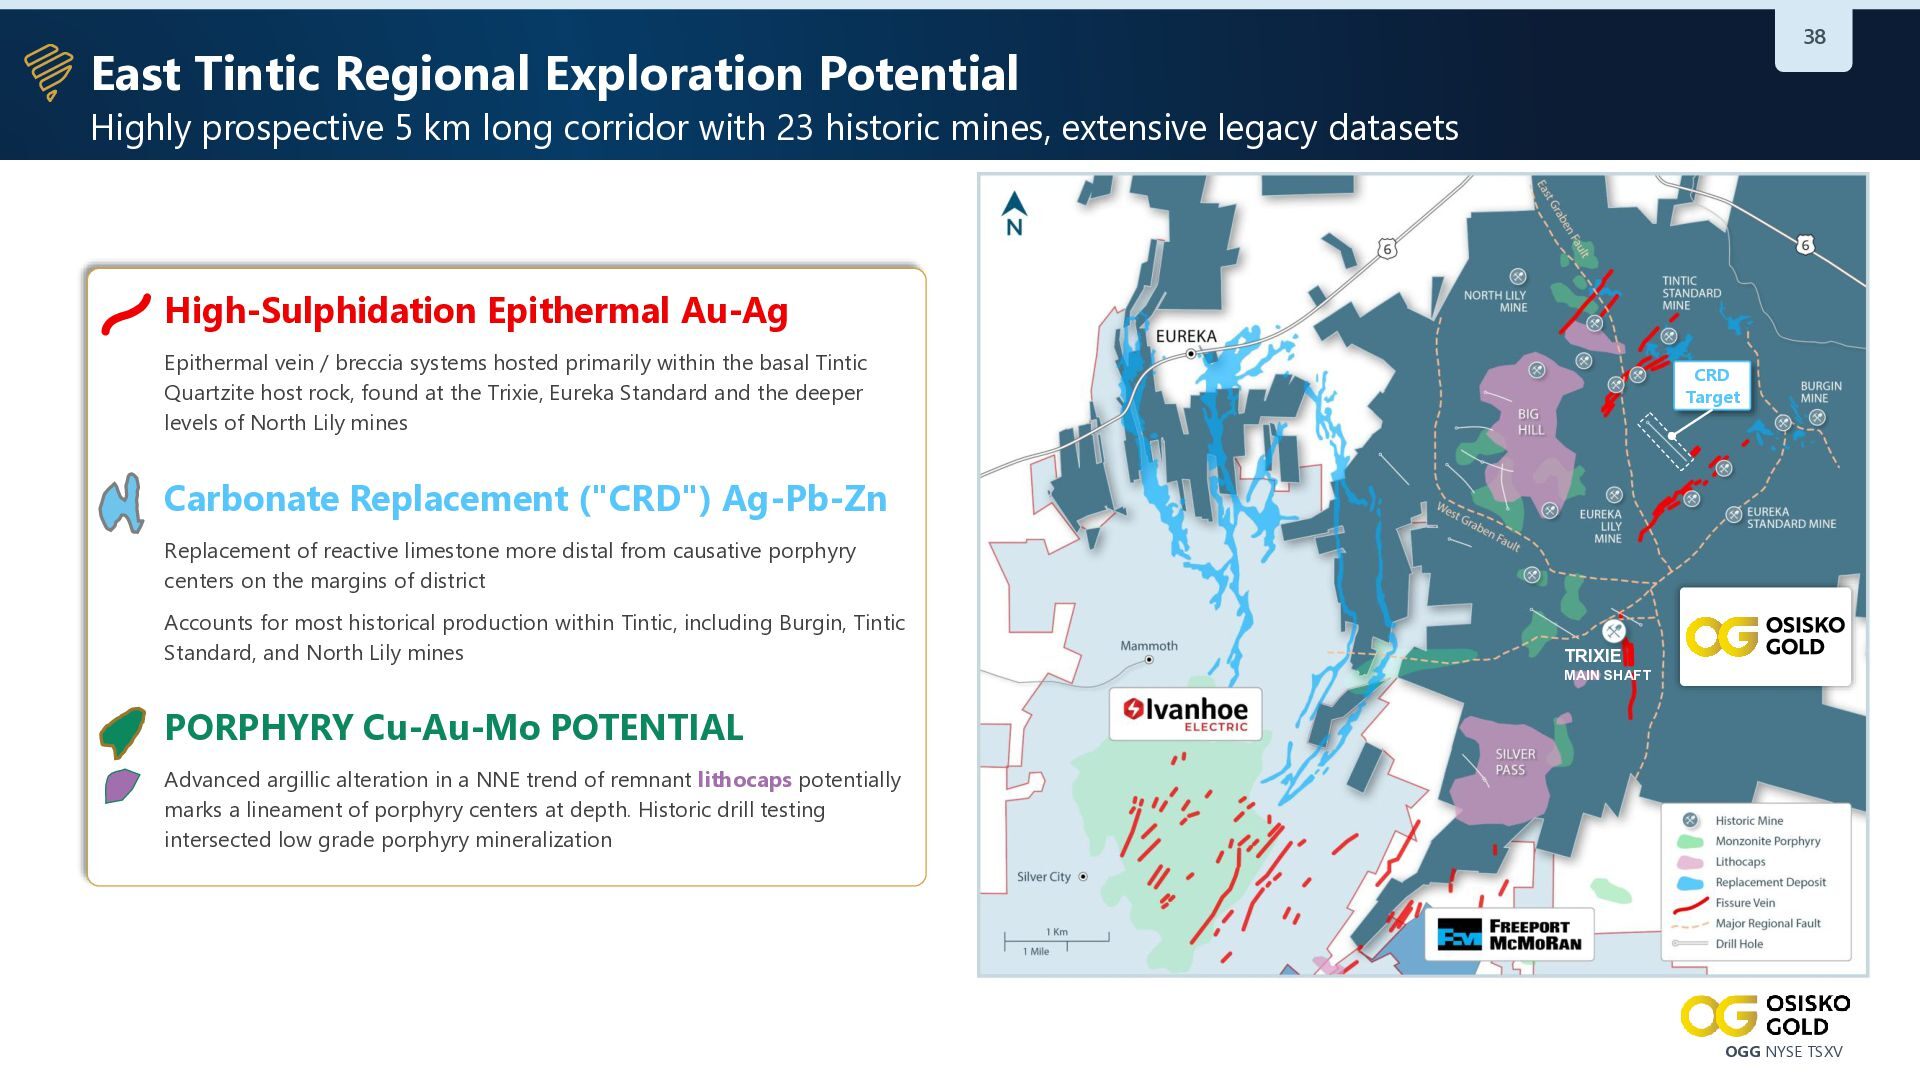
38 East Tintic Regional Exploration Potential Highly prospective 5 km
long corridor with 23 historic mines, extensive legacy datasets High-Sulphidation Epithermal Au-Ag Epithermal vein / breccia systems hosted primarily within the basal Tintic Quartzite host rock, found at the Trixie, Eureka Standard and the deeper levels of North Lily mines CRD Target Carbonate Replacement ("CRD") Ag-Pb-Zn Replacement of reactive limestone more distal from causative porphyry centers on the margins of district Accounts for most historical production within Tintic, including Burgin, Tintic Standard, and North Lily mines TRIXIE MAIN SHAFT PORPHYRY Cu-Au-Mo POTENTIAL Advanced argillic alteration in a NNE trend of remnant lithocaps potentially marks a lineament of porphyry centers at depth. Historic drill testing intersected low grade porphyry mineralization OGG NYSE TSXV -
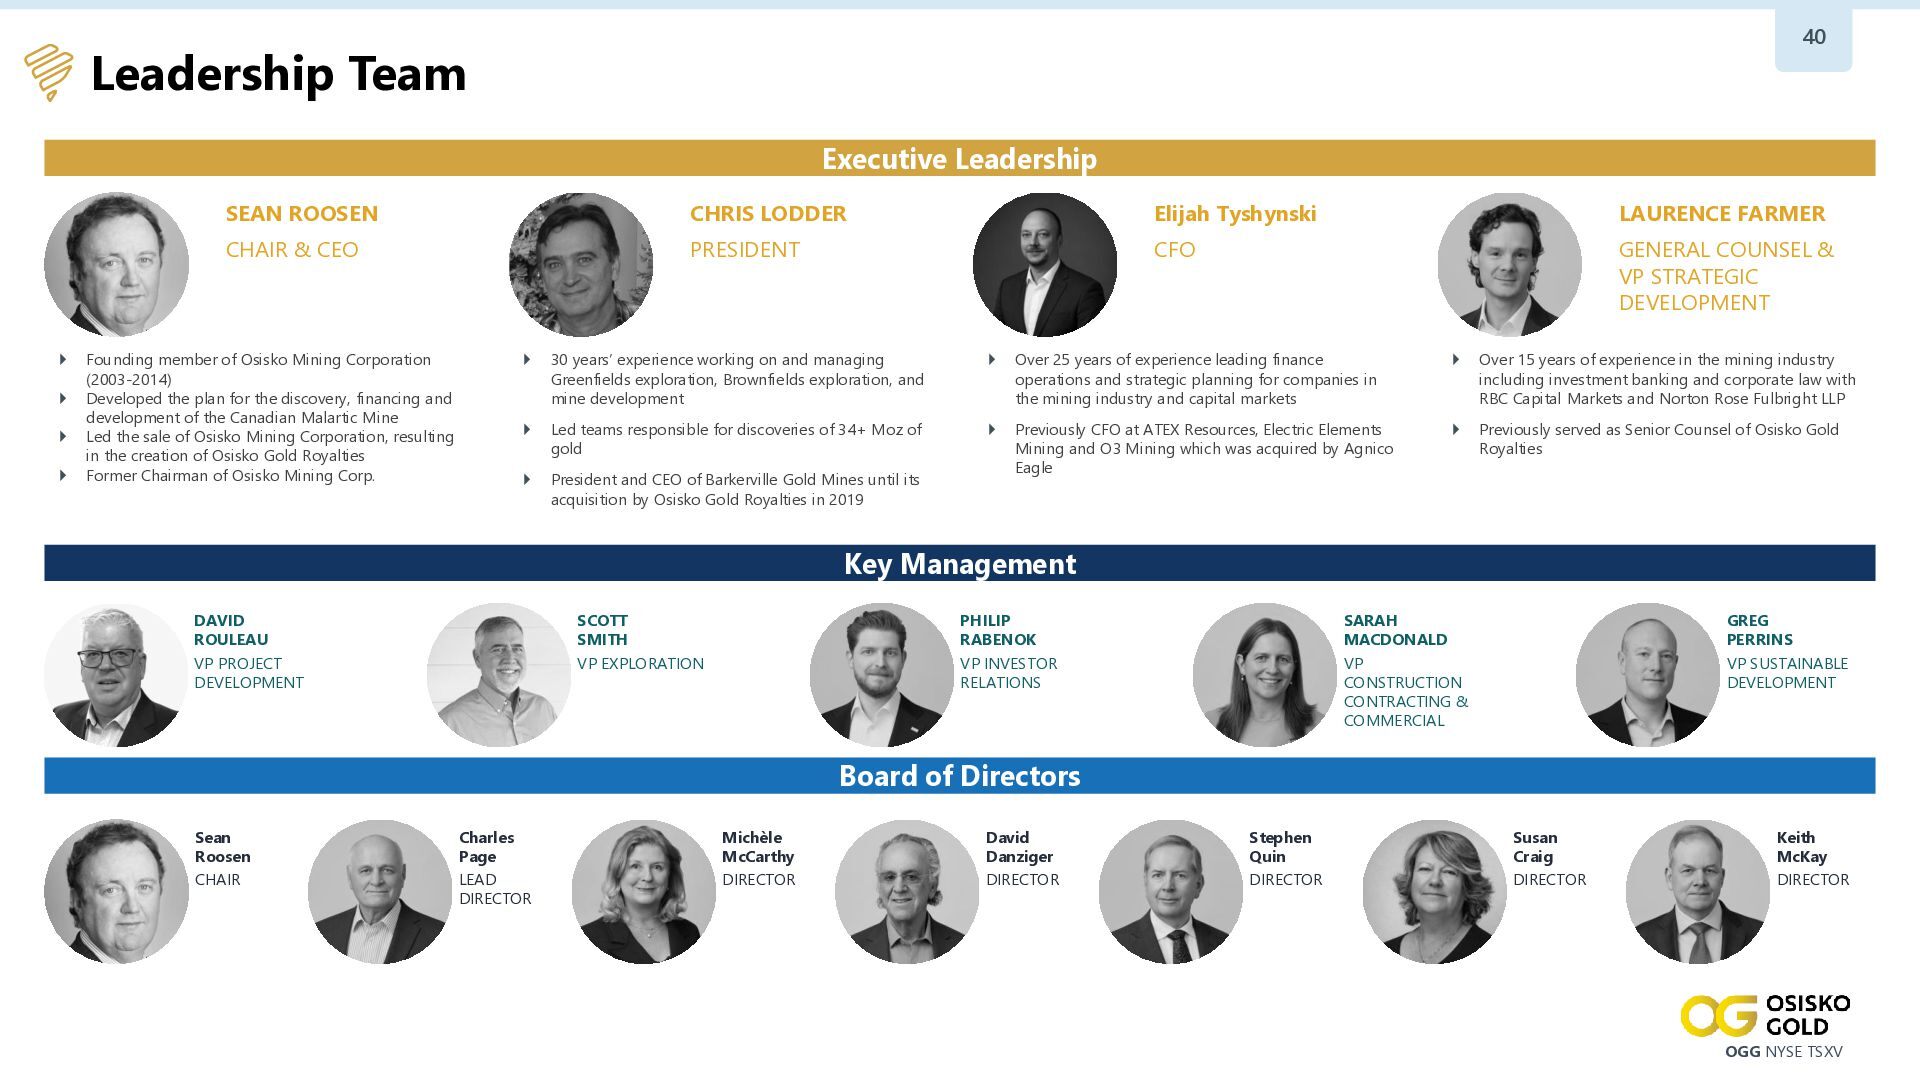
40 Leadership Team Executive Leadership SEAN
ROOSEN CHRIS LODDER Elijah Tyshynski LAURENCE FARMER CHAIR & CEO PRESIDENT CFO GENERAL COUNSEL & VP STRATEGIC DEVELOPMENT Founding member of Osisko Mining Corporation (2003-2014) Developed the plan for the discovery, financing and development of the Canadian Malartic Mine Led the sale of Osisko Mining Corporation, resulting in the creation of Osisko Gold Royalties Former Chairman of Osisko Mining Corp. 30 years’ experience working on and managing Greenfields exploration, Brownfields exploration, and mine development Over 25 years of experience leading finance operations and strategic planning for companies in the mining industry and capital markets Over 15 years of experience in the mining industry including investment banking and corporate law with RBC Capital Markets and Norton Rose Fulbright LLP Led teams responsible for discoveries of 34+ Moz of gold Previously served as Senior Counsel of Osisko Gold Royalties President and CEO of Barkerville Gold Mines until its acquisition by Osisko Gold Royalties in 2019 Previously CFO at ATEX Resources, Electric Elements Mining and O3 Mining which was acquired by Agnico Eagle SARAH MACDONALD VP CONSTRUCTION CONTRACTING & COMMERCIAL GREG PERRINS VP SUSTAINABLE DEVELOPMENT Key Management DAVID ROULEAU VP PROJECT DEVELOPMENT SCOTT SMITH VP EXPLORATION PHILIP RABENOK VP INVESTOR RELATIONS Board of Directors Sean Roosen CHAIR Charles Page LEAD DIRECTOR Michèle McCarthy DIRECTOR David Danziger DIRECTOR Stephen Quin DIRECTOR Susan Craig DIRECTOR Keith McKay DIRECTOR OGG NYSE TSXV -
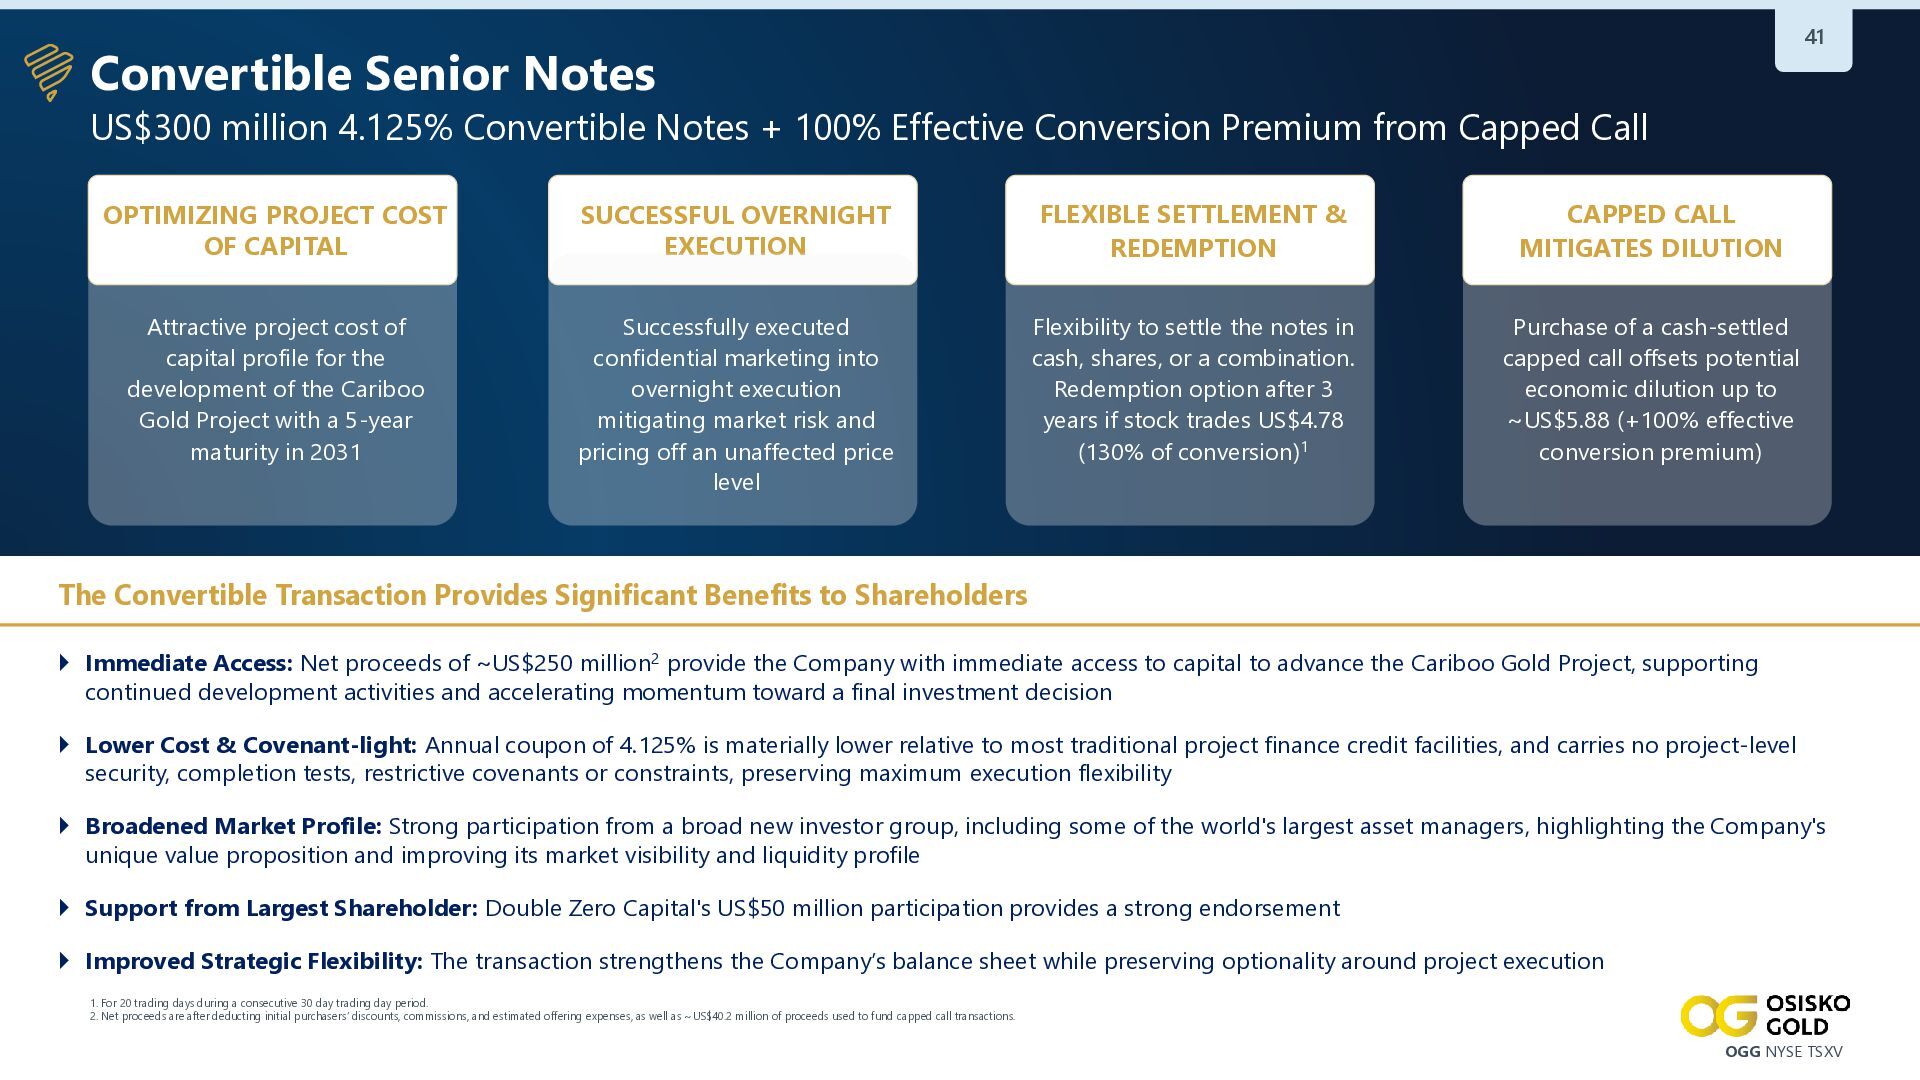
41 Convertible Senior Notes US$300 million 4.125% Convertible Notes +
100% Effective Conversion Premium from Capped Call OPTIMIZING PROJECT COST OF CAPITAL SUCCESSFUL OVERNIGHT EXECUTION FLEXIBLE SETTLEMENT & REDEMPTION CAPPED CALL MITIGATES DILUTION Attractive project cost of capital profile for the development of the Cariboo Gold Project with a 5-year maturity in 2031 Successfully executed confidential marketing into overnight execution mitigating market risk and pricing off an unaffected price level Flexibility to settle the notes in cash, shares, or a combination. Redemption option after 3 years if stock trades US$4.78 (130% of conversion)1 Purchase of a cash-settled capped call offsets potential economic dilution up to ~US$5.88 (+100% effective conversion premium) The Convertible Transaction Provides Significant Benefits to Shareholders Immediate Access: Net proceeds of ~US$250 million2 provide the Company with immediate access to capital to advance the Cariboo Gold Project, supporting continued development activities and accelerating momentum toward a final investment decision Lower Cost & Covenant-light: Annual coupon of 4.125% is materially lower relative to most traditional project finance credit facilities, and carries no project-level security, completion tests, restrictive covenants or constraints, preserving maximum execution flexibility Broadened Market Profile: Strong participation from a broad new investor group, including some of the world's largest asset managers, highlighting the Company's unique value proposition and improving its market visibility and liquidity profile Support from Largest Shareholder: Double Zero Capital's US$50 million participation provides a strong endorsement Improved Strategic Flexibility: The transaction strengthens the Company’s balance sheet while preserving optionality around project execution 1. For 20 trading days during a consecutive 30 day trading day period. 2. Net proceeds are after deducting initial purchasers’ discounts, commissions, and estimated offering expenses, as well as ~US$40.2 million of proceeds used to fund capped call transactions. OGG NYSE TSXV -
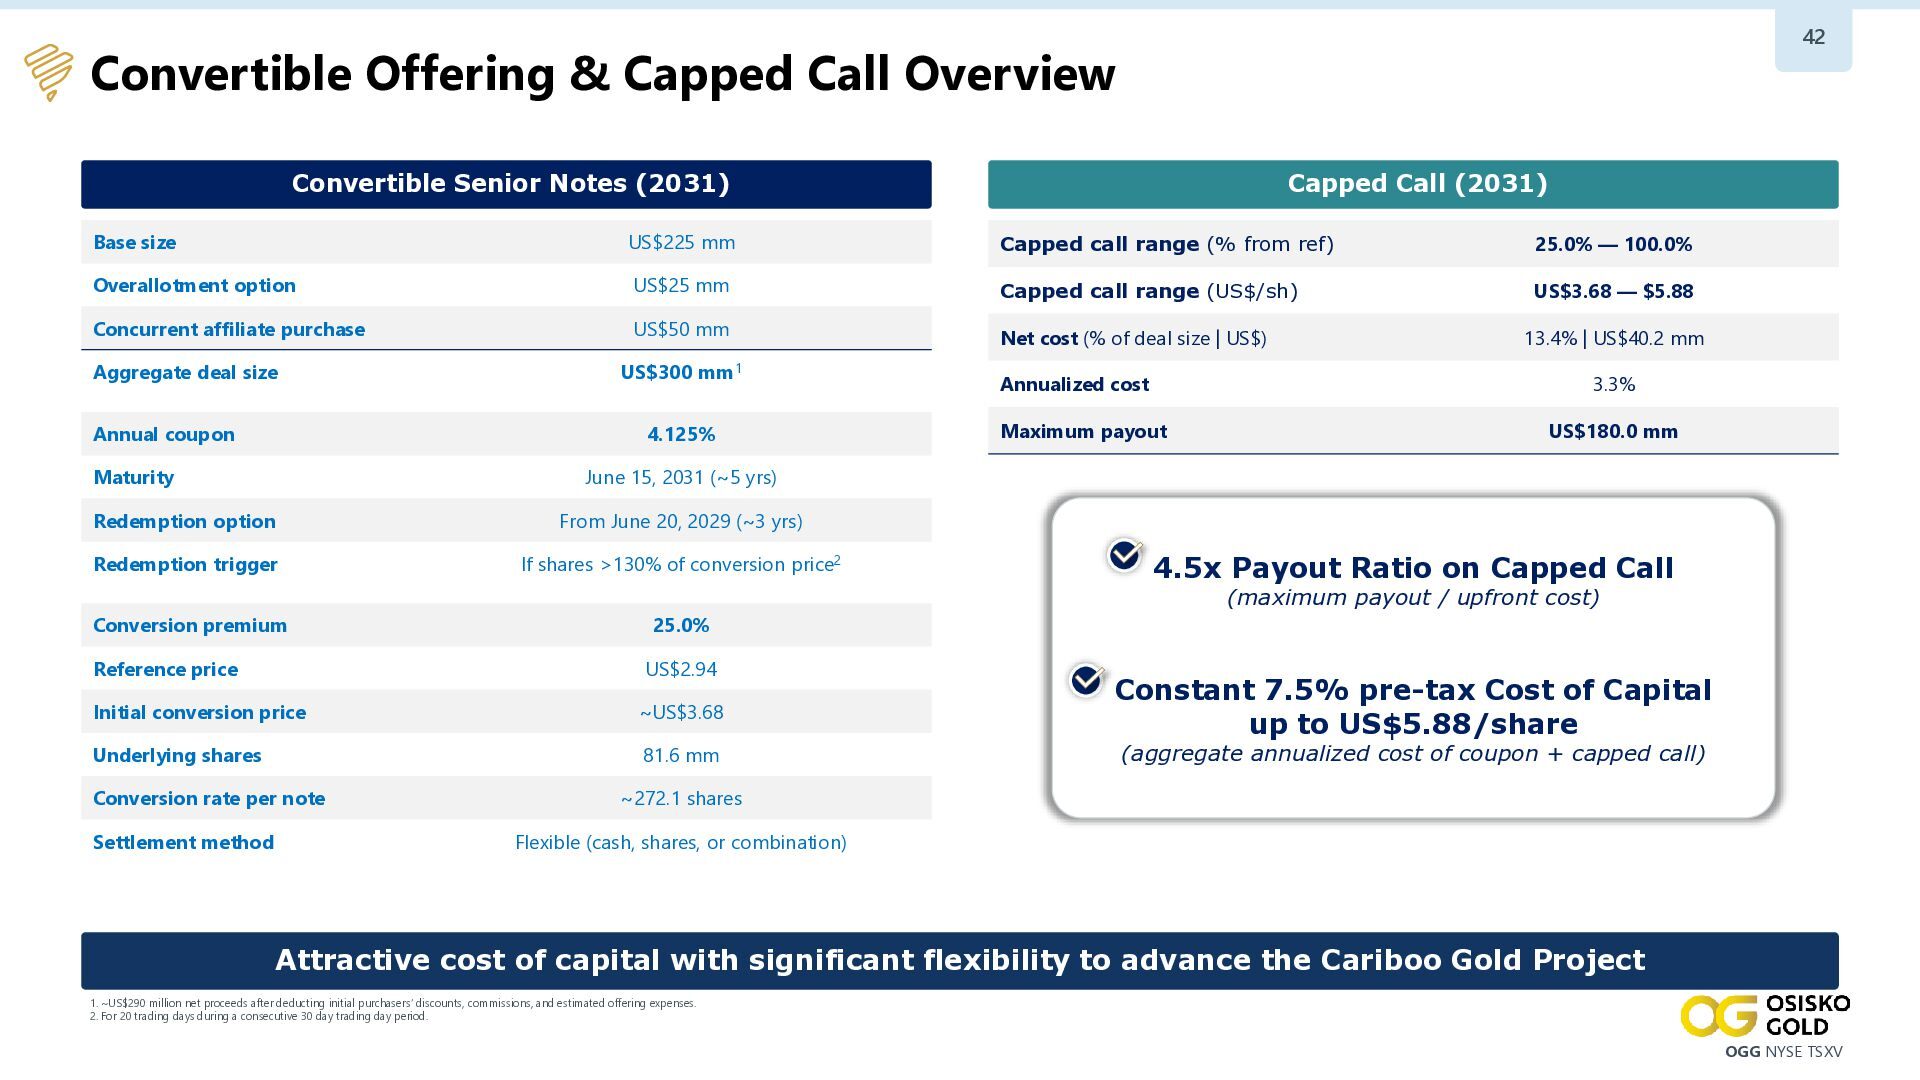
42 Convertible Offering & Capped Call Overview Convertible Senior Notes
(2031) Capped Call (2031) Base size US$225 mm Capped call range (% from ref) 25.0% — 100.0% Overallotment option US$25 mm Capped call range (US$/sh) US$3.68 — $5.88 Concurrent affiliate purchase US$50 mm Net cost (% of deal size | US$) 13.4% | US$40.2 mm Aggregate deal size US$300 mm1 Annual coupon 4.125% Maturity Annualized cost 3.3% Maximum payout US$180.0 mm June 15, 2031 (~5 yrs) Redemption option From June 20, 2029 (~3 yrs) Redemption trigger If shares >130% of conversion price2 4.5x Payout Ratio on Capped Call (maximum payout / upfront cost) Conversion premium 25.0% Reference price US$2.94 Initial conversion price ~US$3.68 Underlying shares 81.6 mm Conversion rate per note Settlement method Constant 7.5% pre-tax Cost of Capital up to US$5.88/share (aggregate annualized cost of coupon + capped call) ~272.1 shares Flexible (cash, shares, or combination) Attractive cost of capital with significant flexibility to advance the Cariboo Gold Project 1. ~US$290 million net proceeds after deducting initial purchasers’ discounts, commissions, and estimated offering expenses. 2. For 20 trading days during a consecutive 30 day trading day period. OGG NYSE TSXV -
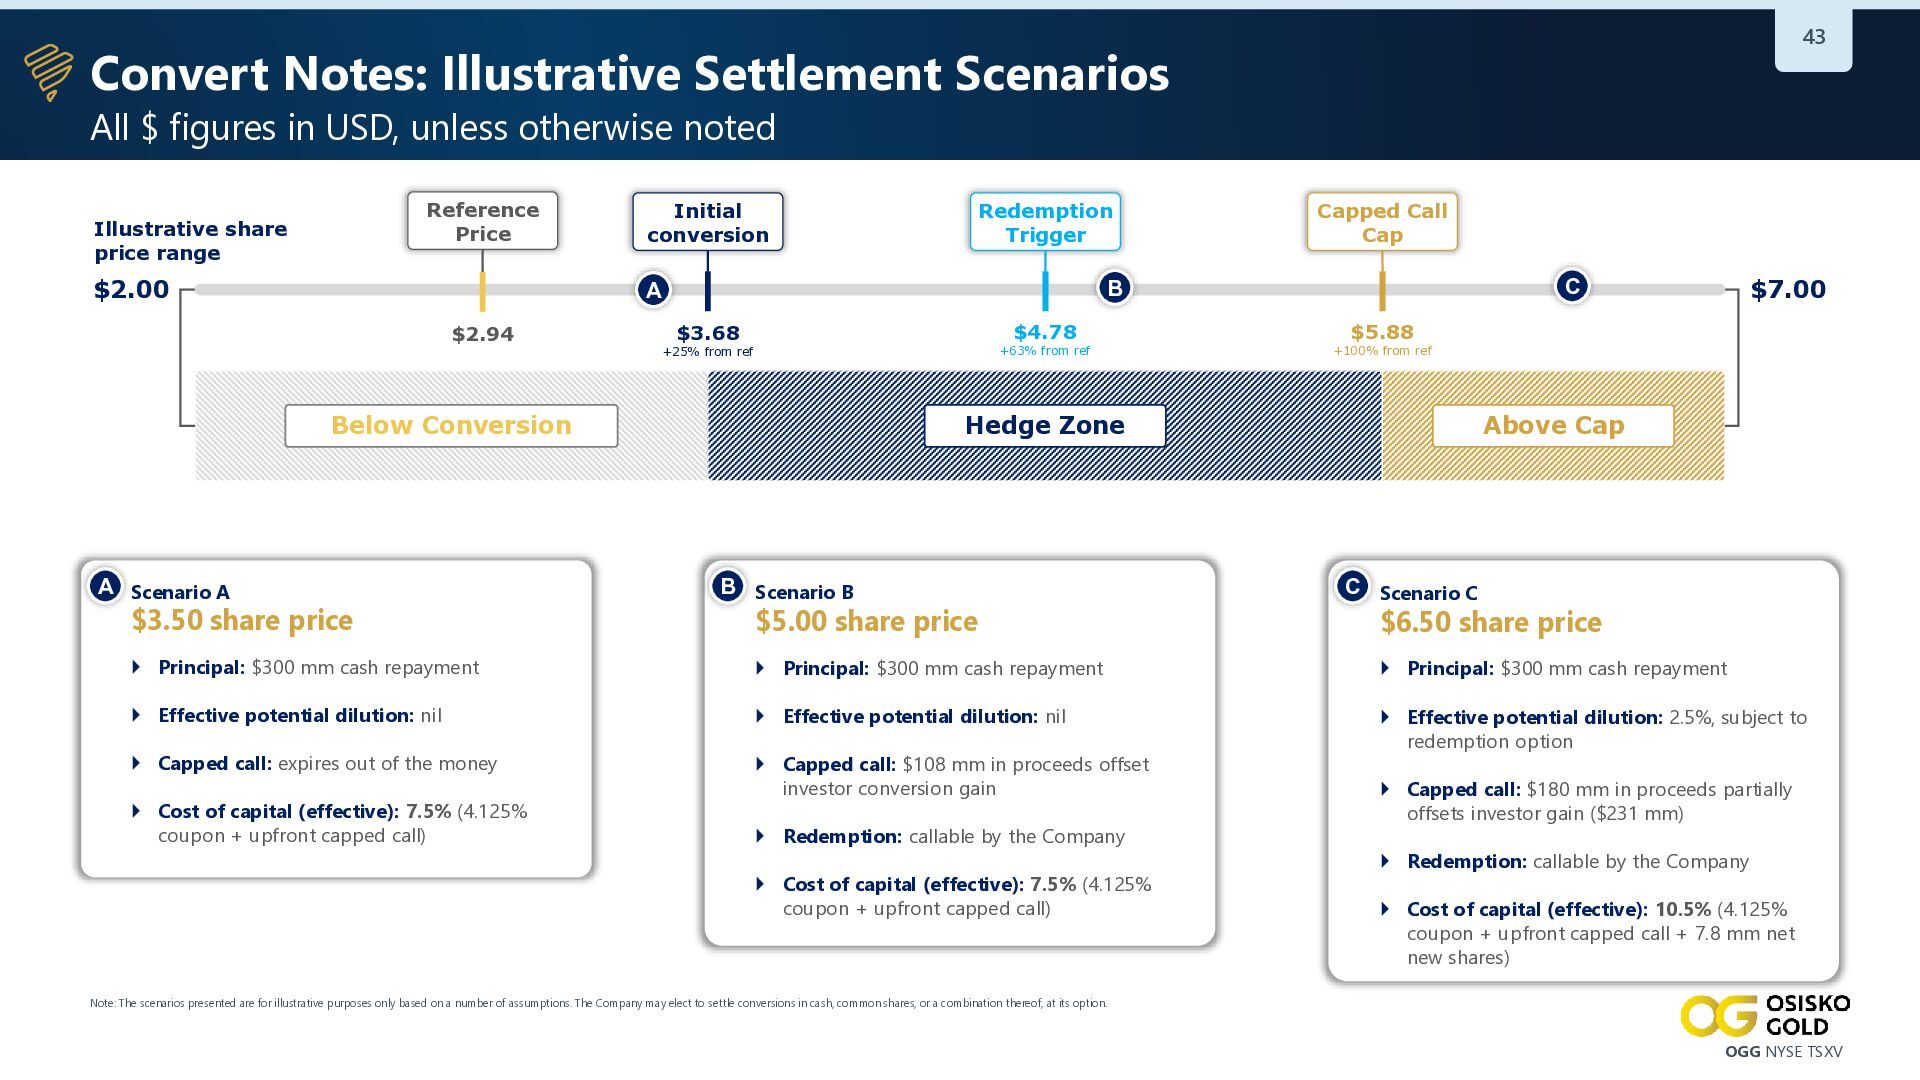
43 Convert Notes: Illustrative Settlement Scenarios All $ figures in
USD, unless otherwise noted Reference Price Illustrative share price range $2.00 Initial conversion Redemption Trigger $4.78 $3.68 +63% from ref +25% from ref Below Conversion A Scenario A $3.50 share price $5.88 +100% from ref Hedge Zone B Scenario B $5.00 share price $7.00 C B A $2.94 Capped Call Cap Above Cap C Scenario C $6.50 share price Principal: $300 mm cash repayment Principal: $300 mm cash repayment Principal: $300 mm cash repayment Effective potential dilution: nil Effective potential dilution: nil Capped call: expires out of the money Capped call: $108 mm in proceeds offset investor conversion gain Effective potential dilution: 2.5%, subject to redemption option Cost of capital (effective): 7.5% (4.125% coupon + upfront capped call) Redemption: callable by the Company Cost of capital (effective): 7.5% (4.125% coupon + upfront capped call) Capped call: $180 mm in proceeds partially offsets investor gain ($231 mm) Redemption: callable by the Company Cost of capital (effective): 10.5% (4.125% coupon + upfront capped call + 7.8 mm net new shares) Note: The scenarios presented are for illustrative purposes only based on a number of assumptions. The Company may elect to settle conversions in cash, common shares, or a combination thereof, at its option. OGG NYSE TSXV -
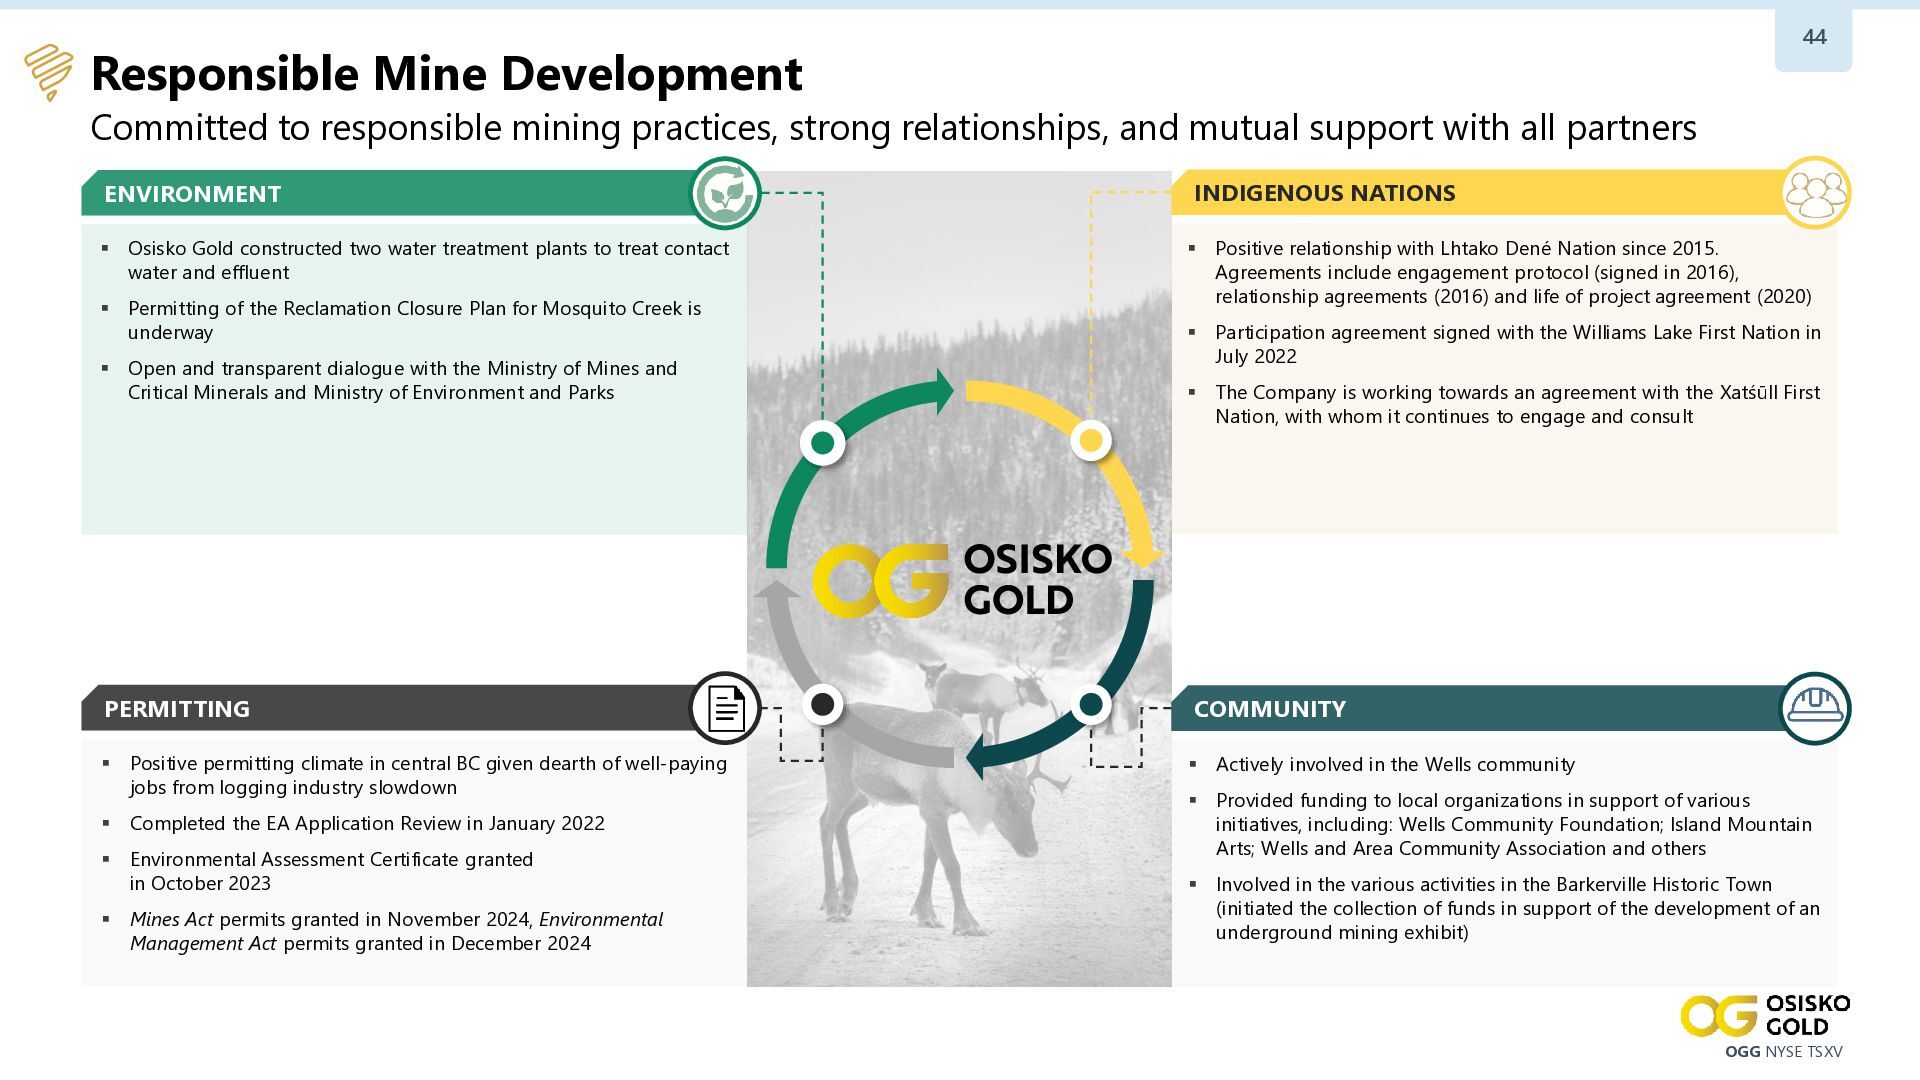
44 Responsible Mine Development Committed to responsible mining practices, strong
relationships, and mutual support with all partners ENVIRONMENT INDIGENOUS NATIONS ▪ Osisko Gold constructed two water treatment plants to treat contact water and effluent ▪ Positive relationship with Lhtako Dené Nation since 2015. Agreements include engagement protocol (signed in 2016), relationship agreements (2016) and life of project agreement (2020) ▪ Permitting of the Reclamation Closure Plan for Mosquito Creek is underway ▪ Open and transparent dialogue with the Ministry of Mines and Critical Minerals and Ministry of Environment and Parks ▪ Participation agreement signed with the Williams Lake First Nation in July 2022 ▪ The Company is working towards an agreement with the Xatśūll First Nation, with whom it continues to engage and consult PERMITTING COMMUNITY ▪ Positive permitting climate in central BC given dearth of well-paying jobs from logging industry slowdown ▪ Actively involved in the Wells community ▪ Completed the EA Application Review in January 2022 ▪ Environmental Assessment Certificate granted in October 2023 ▪ Mines Act permits granted in November 2024, Environmental Management Act permits granted in December 2024 ▪ Provided funding to local organizations in support of various initiatives, including: Wells Community Foundation; Island Mountain Arts; Wells and Area Community Association and others ▪ Involved in the various activities in the Barkerville Historic Town (initiated the collection of funds in support of the development of an underground mining exhibit) OGG NYSE TSXV -
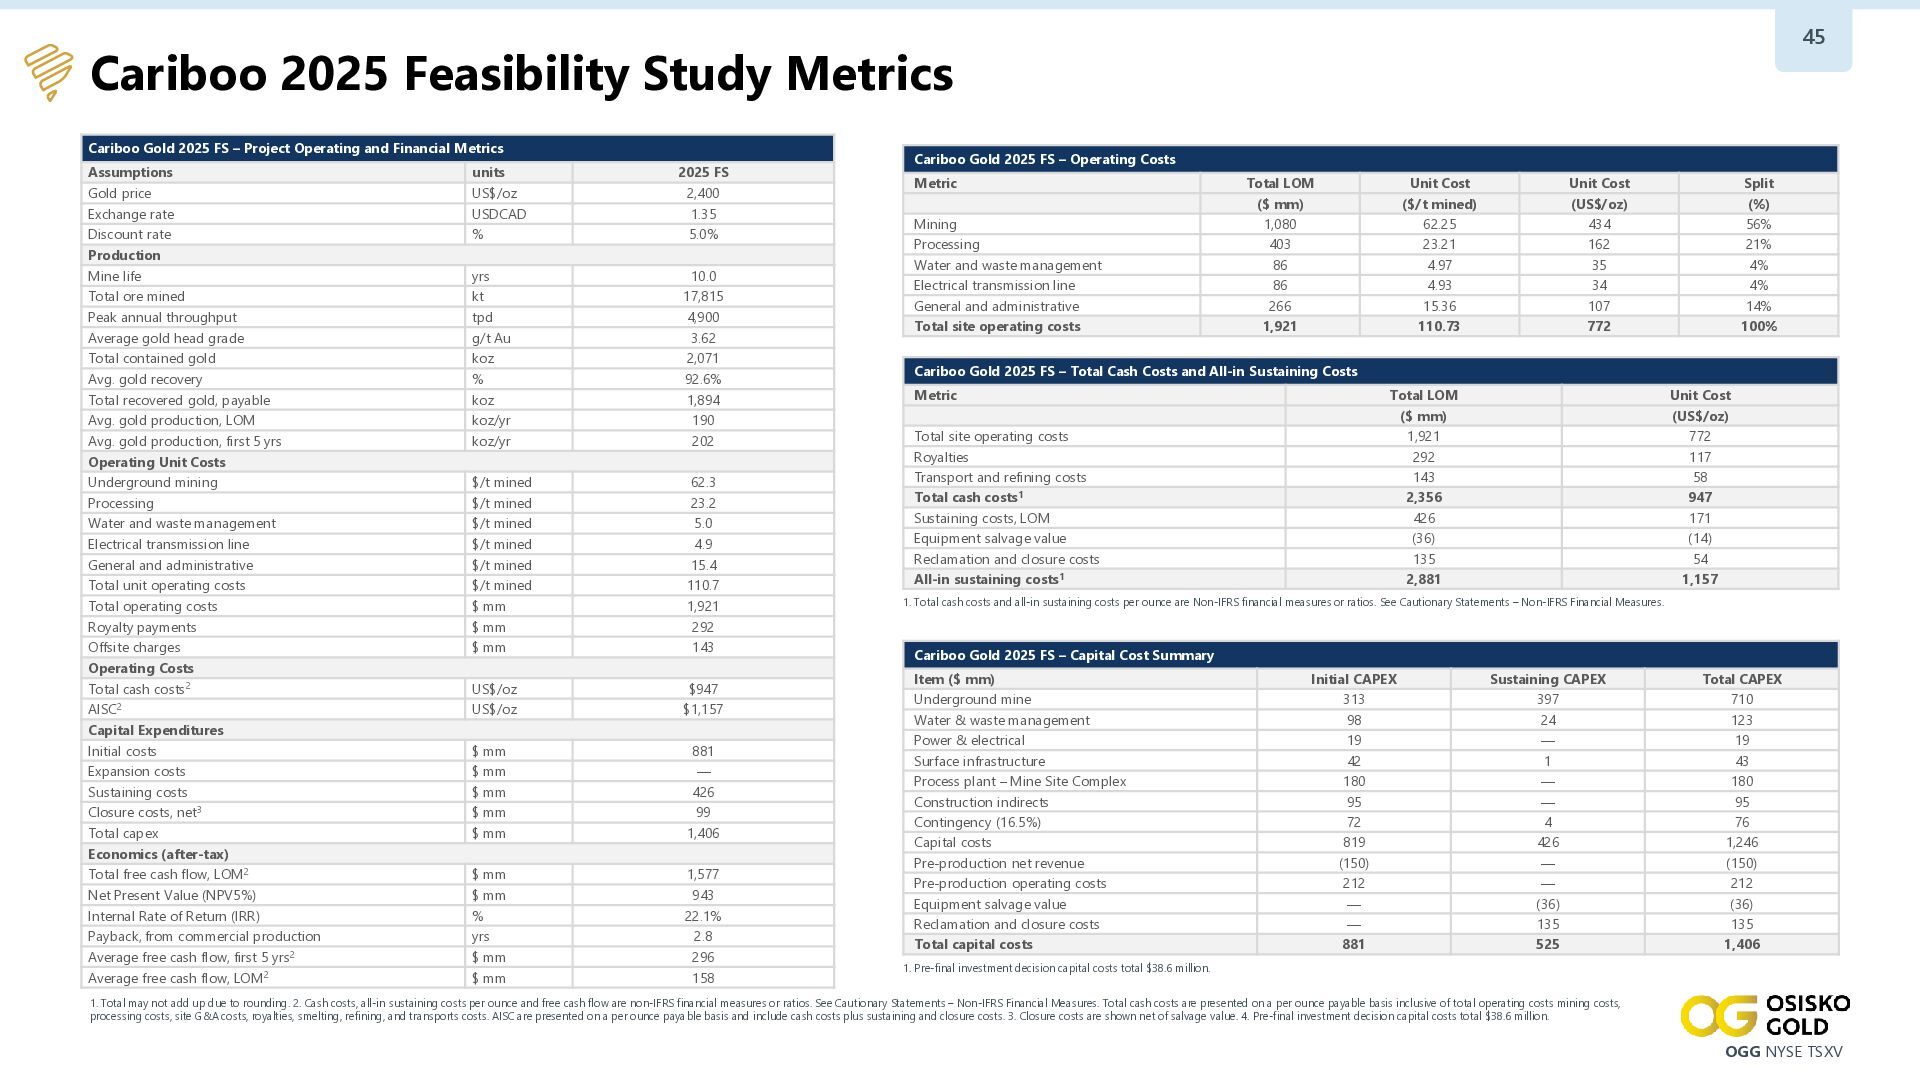
45 Cariboo 2025 Feasibility Study Metrics Cariboo Gold 2025 FS
– Project Operating and Financial Metrics Assumptions Gold price Exchange rate Discount rate Production Mine life Total ore mined Peak annual throughput Average gold head grade Total contained gold Avg. gold recovery Total recovered gold, payable Avg. gold production, LOM Avg. gold production, first 5 yrs Operating Unit Costs Underground mining Processing Water and waste management Electrical transmission line General and administrative Total unit operating costs Total operating costs Royalty payments Offsite charges Operating Costs Total cash costs2 AISC2 Capital Expenditures Initial costs Expansion costs Sustaining costs Closure costs, net3 Total capex Economics (after-tax) Total free cash flow, LOM2 Net Present Value (NPV5%) Internal Rate of Return (IRR) Payback, from commercial production Average free cash flow, first 5 yrs2 Average free cash flow, LOM2 units US$/oz USDCAD % 2025 FS 2,400 1.35 5.0% yrs kt tpd g/t Au koz % koz koz/yr koz/yr 10.0 17,815 4,900 3.62 2,071 92.6% 1,894 190 202 $/t mined $/t mined $/t mined $/t mined $/t mined $/t mined $ mm $ mm $ mm 62.3 23.2 5.0 4.9 15.4 110.7 1,921 292 143 US$/oz US$/oz $947 $1,157 $ mm $ mm $ mm $ mm $ mm 881 — 426 99 1,406 $ mm $ mm % yrs $ mm $ mm 1,577 943 22.1% 2.8 296 158 Cariboo Gold 2025 FS – Operating Costs Metric Mining Processing Water and waste management Electrical transmission line General and administrative Total site operating costs Total LOM ($ mm) 1,080 403 86 86 266 1,921 Unit Cost ($/t mined) 62.25 23.21 4.97 4.93 15.36 110.73 Unit Cost (US$/oz) 434 162 35 34 107 772 Split (%) 56% 21% 4% 4% 14% 100% Cariboo Gold 2025 FS – Total Cash Costs and All-in Sustaining Costs Metric Total site operating costs Royalties Transport and refining costs Total cash costs1 Sustaining costs, LOM Equipment salvage value Reclamation and closure costs All-in sustaining costs1 Total LOM ($ mm) 1,921 292 143 2,356 426 (36) 135 2,881 Unit Cost (US$/oz) 772 117 58 947 171 (14) 54 1,157 1. Total cash costs and all-in sustaining costs per ounce are Non-IFRS financial measures or ratios. See Cautionary Statements – Non-IFRS Financial Measures. Cariboo Gold 2025 FS – Capital Cost Summary Item ($ mm) Underground mine Water & waste management Power & electrical Surface infrastructure Process plant – Mine Site Complex Construction indirects Contingency (16.5%) Capital costs Pre-production net revenue Pre-production operating costs Equipment salvage value Reclamation and closure costs Total capital costs Initial CAPEX 313 98 19 42 180 95 72 819 (150) 212 — — 881 Sustaining CAPEX 397 24 — 1 — — 4 426 — — (36) 135 525 Total CAPEX 710 123 19 43 180 95 76 1,246 (150) 212 (36) 135 1,406 1. Pre-final investment decision capital costs total $38.6 million. 1. Total may not add up due to rounding. 2. Cash costs, all-in sustaining costs per ounce and free cash flow are non-IFRS financial measures or ratios. See Cautionary Statements – Non-IFRS Financial Measures. Total cash costs are presented on a per ounce payable basis inclusive of total operating costs mining costs, processing costs, site G&A costs, royalties, smelting, refining, and transports costs. AISC are presented on a per ounce payable basis and include cash costs plus sustaining and closure costs. 3. Closure costs are shown net of salvage value. 4. Pre-final investment decision capital costs total $38.6 million. OGG NYSE TSXV -
46 Cariboo Mineral Reserves & Resources Measured and Indicated Resources
are exclusive of Mineral Reserves Mineral R&R Probable Reserves Measured Resources Indicated Resources Inferred Resources Tonnes (000’s) Grade (g/t Au) Ounces (koz Au) Tonnes (000’s) Grade (g/t Au) Ounces (koz Au) Tonnes (000’s) Grade (g/t Au) Ounces (koz Au) Tonnes (000’s) Grade (g/t Au) Ounces (koz Au) Bonanza Ledge — — — 47 5.06 8 32 4.02 4 — — — BC Vein — — — — — — 1,057 3.00 102 596 3.17 61 KL — — — — — — 527 2.80 47 2,514 2.53 205 Lowhee 923 3.52 104 — — — 1,333 2.76 118 486 3.01 47 Mosquito 1,105 3.94 140 — — — 1,553 2.96 148 1,883 3.08 186 Shaft 8,548 3.72 1,022 — — — 6,121 2.92 575 7,457 3.44 826 Valley 3,239 3.59 374 — — — 2,718 2.70 236 2,470 3.01 239 Cow 4,000 3.35 431 — — — 3,991 2.91 374 3,368 2.78 301 17,815 3.62 2,071 47 5.06 8 17,332 2.88 1,604 18,774 3.09 1,864 Deposit Total Reserves / Resources MINERAL RESERVES 1. Totals may not add up due to rounding. 2. The Mineral Reserve estimate follows the 2014 CIM Definition Standards on Mineral Resources and Reserves and the 2019 CIM Estimation of Mineral Resources and Mineral Reserves Best Practice Guidelines. 3. Mineral Reserves used the following assumptions: US$1,915/oz gold price, USD:CAD exchange rate of 1.32, and variable cut-off value from 1.70 g/t to 2.0 g/t Au 4. Mineral Reserves include both internal and external dilution along with mining recovery. The external dilution is estimated to be 10.1%. The average mining recovery factor was set at 91.3% to account for ore left in each block in the margins of the deposit. MINERAL RESOURCES 1. The independent and qualified persons for the Mineral Resources estimates, as defined by NI 43-101, are Carl Pelletier, P.Geo., and Tessa Scott, P.Geo. (Norda Stelo). The effective date of the 2025 FS Mineral Resource Estimate is April 22, 2025. 2. These Mineral Resources, exclusive of the reserves, are not Mineral Reserves and do not have demonstrated economic viability. 3. The Mineral Resources estimate follows the 2014 CIM Definition Standards on Mineral Resources and Reserves and the 2019 CIM Estimation of Mineral Resources and Mineral Reserves Best Practice Guidelines. 4. A total of 481 vein zones were modelled for the Cow Mountain (Cow and Valley), Island Mountain (Shaft and Mosquito), Barkerville Mountain (BC Vein, KL, and Lowhee) deposits and one gold zone for Bonanza Ledge. A minimum true thickness of 2.0 m was applied, using the gold grade of the adjacent material when assayed or a value of zero when not assayed. 5. The estimate is reported for a potential underground scenario at a cut-off grade of 1.8 g/t Au, except for Bonanza Ledge at a cut-off grade of 3.5 g/t Au. The cut-off grade for the Cow, Valley, Shaft, Mosquito, BC Vein, KL, and Lowhee deposits was calculated using a gold price of US$2,400/oz; a USDCAD exchange rate of 1.35; an underground mining cost of $66.3/t; a processing and transport cost of $30.80/t; a G&A plus Environmental cost of $22.40/t; and a sustaining CAPEX cost of $45.6/t. No changes have been applied for the Bonanza Ledge. The cut-off grade for the Bonanza Ledge deposit was calculated using a gold price of US$1,700/oz; a USDCAD exchange rate of 1.27; an underground mining cost of $79.13/t; a processing and transport cost of $65.00/t; and a G&A plus Environmental cost of $51.65/t. The cut-off grades may be re-evaluated in light of future prevailing market conditions (metal prices, exchange rate, mining cost, etc.). 6. Density values for Cow, Shaft, Lowhee, and BC Vein were estimated using the ID2 interpolation method, with a value applied for the non-estimated blocks of 2.80 g/cm3 for Cow, 2.78 g/cm3 for Shaft, 2.74 g/cm3 for Lowhee, and 2.69 g/cm3 for BC Vein. Median densities were applied for Valley (2.81 g/cm3), Mosquito (2.79 g/cm3), and KL (2.81 g/cm3). A density of 3.20 g/cm3 was applied for Bonanza Ledge. 7. A four-step capping procedure was applied to composited data for Cow (3.0 m), Valley (1.5 m), Shaft (2.0 m), Mosquito (2.5 m), BC Vein (2.0 m), KL (1.75 m), and Lowhee (1.5 m). Restricted search ellipsoids ranged from 7 to 50 g/t Au at four different distances ranging from 25 m to 250 m for each deposit. High grades at Bonanza Ledge were capped at 70 g/t Au on 2.0 m composited data. 8. The gold Mineral Resources for the Cow, Valley, Shaft, Mosquito, BC Vein, KL, and Lowhee vein zones were estimated using Datamine StudioTM RM 1.9 software using hard boundaries on composited assays. The dilution halo gold mineralization was estimated using Datamine StudioTM RM Pro 1.11. The OK method was used to interpolate a sub-blocked model (parent block size = 5 m x 5 m x 5 m). Mineral Resources for Bonanza Ledge were estimated using GEOVIA GEMSTM 6.7 software using hard boundaries on composited assays. The OK method was used to interpolate a block model (block size = 2 m x 2 m x 5 m). 9. Results are presented in situ. Ounce (troy) = metric tons x grade / 31.10348. Calculations used metric units (metres, tonnes, g/t). The number of tonnes were rounded to the nearest thousand. Any discrepancies in the totals are due to rounding effects. Rounding followed the recommendations as per NI 43-101. 10. The qualified persons responsible for this section of the technical report are not aware of any environmental, permitting, legal, title, taxation, socio-economic, marketing, political, or other relevant factors that could materially affect the Mineral Resource estimate other than those disclosed in this news release and in the Technical Report. OGG NYSE TSXV -
47 2024 Trixie Mineral Resources Estimate DOMAIN T2 T3 T4
+ Wild Cat + 40 FLT 75-85 TOTAL CATEGORY TONNES GRADE (AU G/T) CONTAINED GOLD (OZ) GRADE (AG G/T) CONTAINED SILVER (OZ) Measured 22,678 106.27 77,484 115.99 84,572 Indicated 11,939 23.19 8,902 51.07 19,602 M+I 34,617 77.62 86,387 93.60 104,173 Inferred 1,996 9.82 630 61.38 3,938 Measured 2,385 9.46 725 75.34 5,776 Indicated 970 5.47 171 57.32 1,787 M+I 3,355 8.30 896 70.13 7,564 Inferred 139 6.27 28 63.14 282 Measured 94,784 8.93 27,227 48.41 147,520 Indicated 51,827 6.48 10,795 37.59 62,637 M+I 146,611 8.07 38,023 44.58 210,156 Inferred 104,676 6.57 22,127 38.57 129,792 Measured – – – – – Indicated 60,008 12.93 24,943 80.95 156,185 M+I 60,008 12.93 24,943 80.95 156,185 Inferred 94,793 9.12 27,784 59.28 180,666 Measured 119,847 27.36 105,437 61.73 237,868 Indicated 124,743 11.17 44,811 59.89 240,211 M+I 244,590 19.11 150,248 60.80 478,078 Inferred 201,603 7.80 50,569 48.55 314,678 NOTES 1. Effective date of the 2024 Trixie MRE is March 14, 2024. 2. Each of Mr. William Lewis, P.Geo., of Micon International Limited and Alan J. San Martin, MAusIMM(CP), of Micon International Limited (i) has reviewed and validated the 2024 Trixie MRE, (ii) is considered to be independent of the Company for purposes of Section 1.5 of NI 43-101, and (iii) is a "qualified person" within the meaning of NI 43-101. 3. The mineral resources were estimated using the Canadian Institute of Mining ("CIM"), Metallurgy and Petroleum's "CIM Definition Standards on Mineral Resources and Mineral Reserves" adopted by the CIM council. 4. Mineral resources are reported when they are within potentially mineable shapes derived from a stope optimizer algorithm, assuming an underground longhole stoping mining method with stopes of 6.1 m x 6.1 m x minimum 1.5 m dimensions. 5. Mineral resources that are not mineral reserves do not have demonstrated economic viability. 6. Geologic modelling was completed by Osisko Development modeling geologist Jody Laing, P.Geo, using Leapfrog Geo software. The 2024 Trixie MRE was completed by Osisko Development chief resource geologist, Daniel Downton, P.Geo using Datamine Studio RM 2.0 software. William Lewis and Alan J. San Martin of Micon International Limited independently reviewed and validated the mineral resource model. 7. The estimate is reported for an underground mining scenario and with USD assumptions. The cut-off grade of 4.32 g/t Au was calculated using a gold price 8. 9. 10. 11. 12. 13. 14. of US$1,750/oz, a CAD:USD exchange rate of 1.30; total mining, processing and G&A costs of US$168.04/imperial ton; a refining cost of US$2.65/ounce; a combined royalty of 4.50%; and an average metallurgical gold recovery of 80%. The stope optimizer algorithm evaluated the resources based on a gold equivalent grade which incorporates the silver grade estimate and assumes a silver price of US$23/oz and metallurgical silver recovery of 45%. The 2024 Trixie MRE is comprised of six zones within the greater Trixie area: T2, T3, T4, Wild Cat, 40 Fault and 75-85. Average bulk density values in the mineralized domains were assigned to the T2 (2.955 T/m3), T3 (2.638 T/m3), T4(2.618 T/m3), Wild Cat, and 40 Fault (2.621 T/m3), and 75-85 (2.617 T/m3) domains. Inverse Distance Squared interpolation method was used with a parent block size of 1.2 m x 2.4 m x 2.4 m. The 2024 Trixie MRE results are presented in-situ. Calculations used metric units (metres, tonnes, g/t). The number of tonnes is rounded to the nearest thousand. Any discrepancies in the totals are due to rounding effects. Neither the Company nor Micon International Limited is aware of any known environmental, permitting, legal, title-related, taxation, socio-political, marketing or other relevant issue that could materially affect the mineral resource estimate other than disclosed in this news release. Technical information differs from similar information made public by U.S. companies subject to the reporting and disclosure requirements of the U.S. Securities and Exchange Commission. Refer to "Cautionary Statement to U.S. Investors". OGG NYSE TSXV -
48 PHILIP RABENOK, VICE PRESIDENT, INVESTOR RELATIONS [email protected] | +1
(437) 423 3644 OGG NYSE TSXV | osiskogold.ca OGG NYSE TSXV
 smartgate
 takeuchigroup
 ptna_
 gmofh_hr_team
 yusukiwashita
 77web
 progmat
 aokiplayer
 chibah
 doiko123
 rechiba3
 condordd
 aleyda
 szymonslowik
 dugsong
 tamaranovitovic
 uxyall
 charlesmeaden
 baasie
 axbom
 panda_program
 lara
 inesmontani