An Analysis of Multi-objective Evolutionary Algorithms for Training Ensemble Models Based on Different Performance Measures in Software Effort Estimation
Based on Different Performance Measures in Software Effort Estimation Leandro Minku, Xin Yao {L.L.Minku,X.Yao}@cs.bham.ac.uk CERCIA, School of Computer Science, The University of Birmingham Leandro Minku, Xin Yao {L.L.Minku,X.Yao}@cs.bham.ac.uk An Analysis of MOEAs in SEE 1 / 23
of learning machines have been showing competitive performance in SEE. E. Kocaguneli and T. Menzies. On the Value of Ensemble Effort Estimation. TSE 2012. L. Minku and X. Yao. Ensembles and Locality: Insight on improving software effort estimation. IST 2013. L. Minku and X. Yao. Software Effort Estimation as a Multi-objective Learning Problem. TOSEM 2013. One of the keys for ensembles’ good performance: diversity, i.e., base models should make different errors on the same data points. G. Brown et al. Diversity Creation Methods: A survey and categorisation. Information Fusion 2005. Leandro Minku, Xin Yao {L.L.Minku,X.Yao}@cs.bham.ac.uk An Analysis of MOEAs in SEE 2 / 23
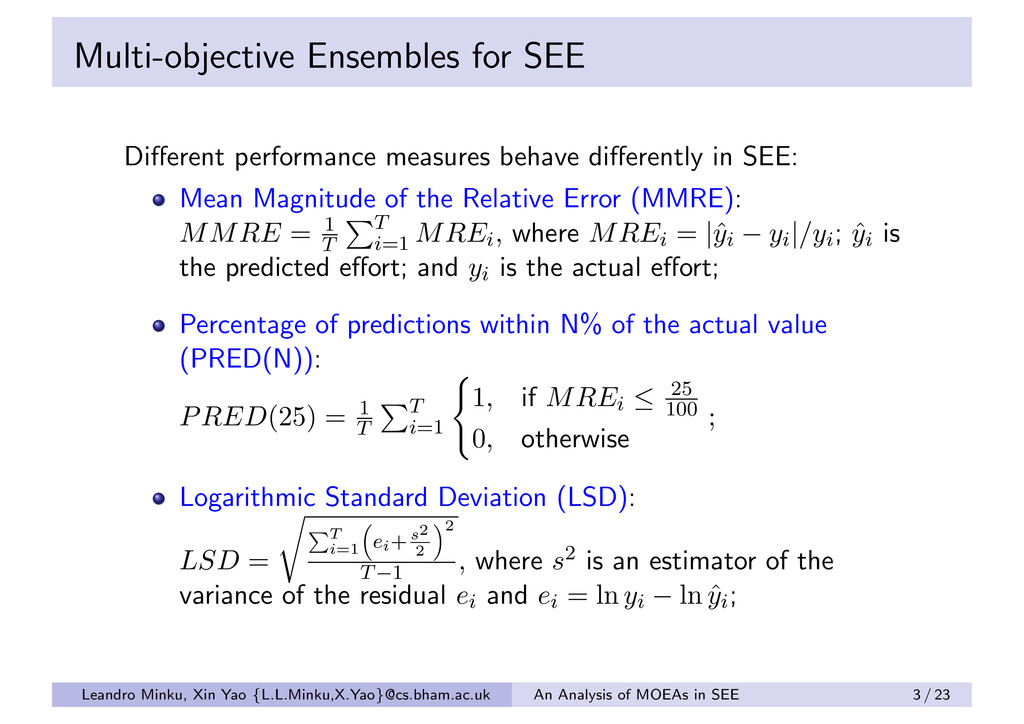
SEE: Mean Magnitude of the Relative Error (MMRE): MMRE = 1 T T i=1 MREi, where MREi = |ˆ yi − yi|/yi; ˆ yi is the predicted effort; and yi is the actual effort; Percentage of predictions within N% of the actual value (PRED(N)): PRED(25) = 1 T T i=1 1, if MREi ≤ 25 100 0, otherwise ; Logarithmic Standard Deviation (LSD): LSD = T i=1 ei+s2 2 2 T−1 , where s2 is an estimator of the variance of the residual ei and ei = ln yi − ln ˆ yi; Leandro Minku, Xin Yao {L.L.Minku,X.Yao}@cs.bham.ac.uk An Analysis of MOEAs in SEE 3 / 23
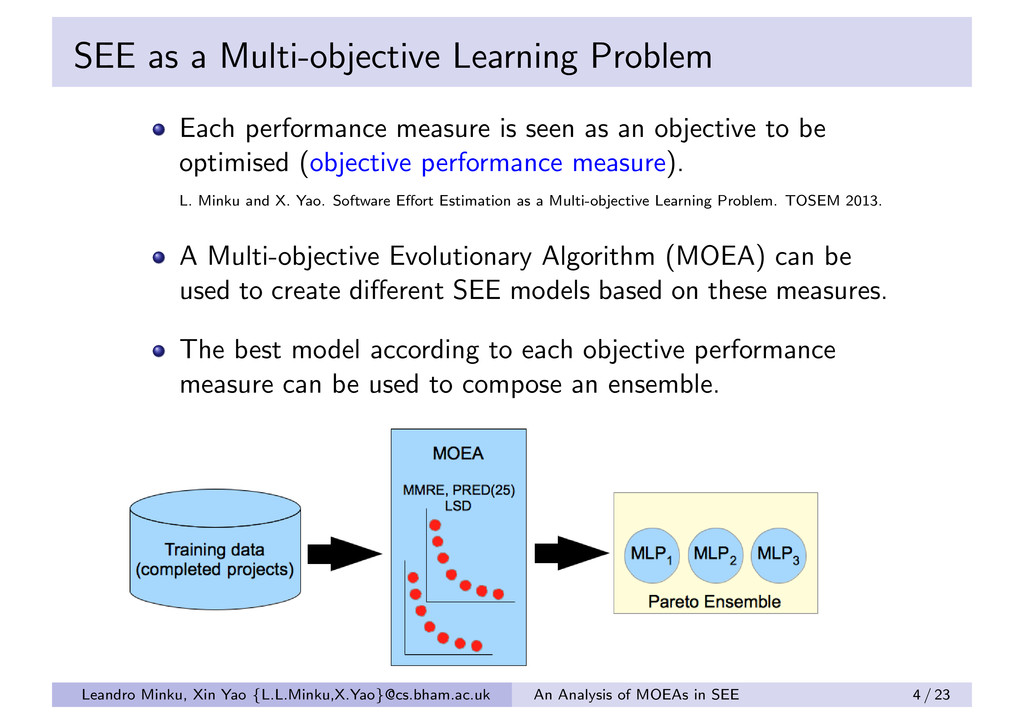
seen as an objective to be optimised (objective performance measure). L. Minku and X. Yao. Software Effort Estimation as a Multi-objective Learning Problem. TOSEM 2013. A Multi-objective Evolutionary Algorithm (MOEA) can be used to create different SEE models based on these measures. The best model according to each objective performance measure can be used to compose an ensemble. Leandro Minku, Xin Yao {L.L.Minku,X.Yao}@cs.bham.ac.uk An Analysis of MOEAs in SEE 4 / 23
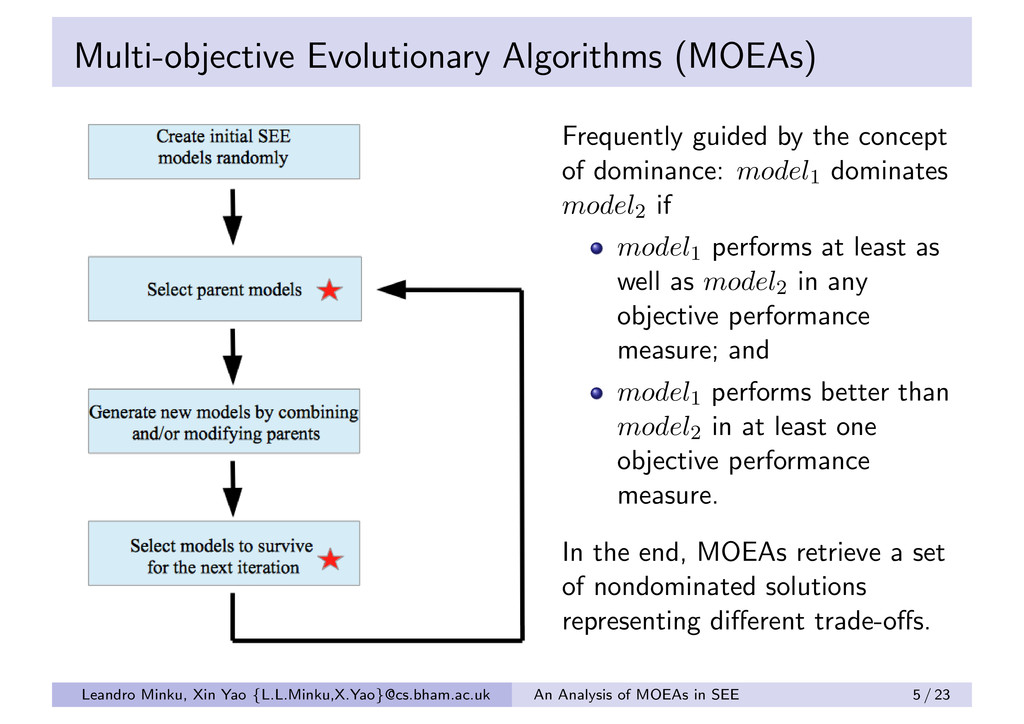
dominance: model1 dominates model2 if model1 performs at least as well as model2 in any objective performance measure; and model1 performs better than model2 in at least one objective performance measure. In the end, MOEAs retrieve a set of nondominated solutions representing different trade-offs. Leandro Minku, Xin Yao {L.L.Minku,X.Yao}@cs.bham.ac.uk An Analysis of MOEAs in SEE 5 / 23
(MLPs). Objective performance measures: LSD, MMRE and PRED(25). Why LSD, MMRE and PRED(25)? Leandro Minku, Xin Yao {L.L.Minku,X.Yao}@cs.bham.ac.uk An Analysis of MOEAs in SEE 6 / 23
(MLPs). Objective performance measures: LSD, MMRE and PRED(25). Why LSD, MMRE and PRED(25)? Because they behave very differently. Diversity is important in ensembles. Optimising LSD, MMRE and PRED(25) resulted in improvements also in other measures such as Mean Absolute Error (MAE). Leandro Minku, Xin Yao {L.L.Minku,X.Yao}@cs.bham.ac.uk An Analysis of MOEAs in SEE 6 / 23
(MLPs). Objective performance measures: LSD, MMRE and PRED(25). Why LSD, MMRE and PRED(25)? Because they behave very differently. Diversity is important in ensembles. Optimising LSD, MMRE and PRED(25) resulted in improvements also in other measures such as Mean Absolute Error (MAE). Using other performance measures would cause the MOEA to look for SEE models that specifically optimise these measures. Leandro Minku, Xin Yao {L.L.Minku,X.Yao}@cs.bham.ac.uk An Analysis of MOEAs in SEE 6 / 23
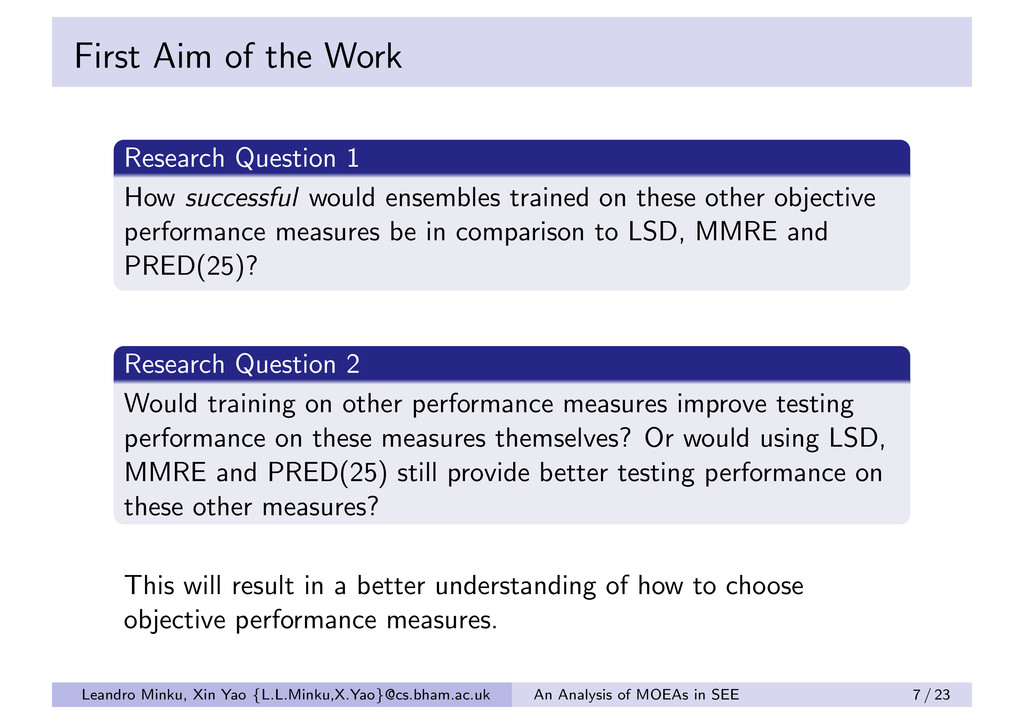
would ensembles trained on these other objective performance measures be in comparison to LSD, MMRE and PRED(25)? Research Question 2 Would training on other performance measures improve testing performance on these measures themselves? Or would using LSD, MMRE and PRED(25) still provide better testing performance on these other measures? This will result in a better understanding of how to choose objective performance measures. Leandro Minku, Xin Yao {L.L.Minku,X.Yao}@cs.bham.ac.uk An Analysis of MOEAs in SEE 7 / 23
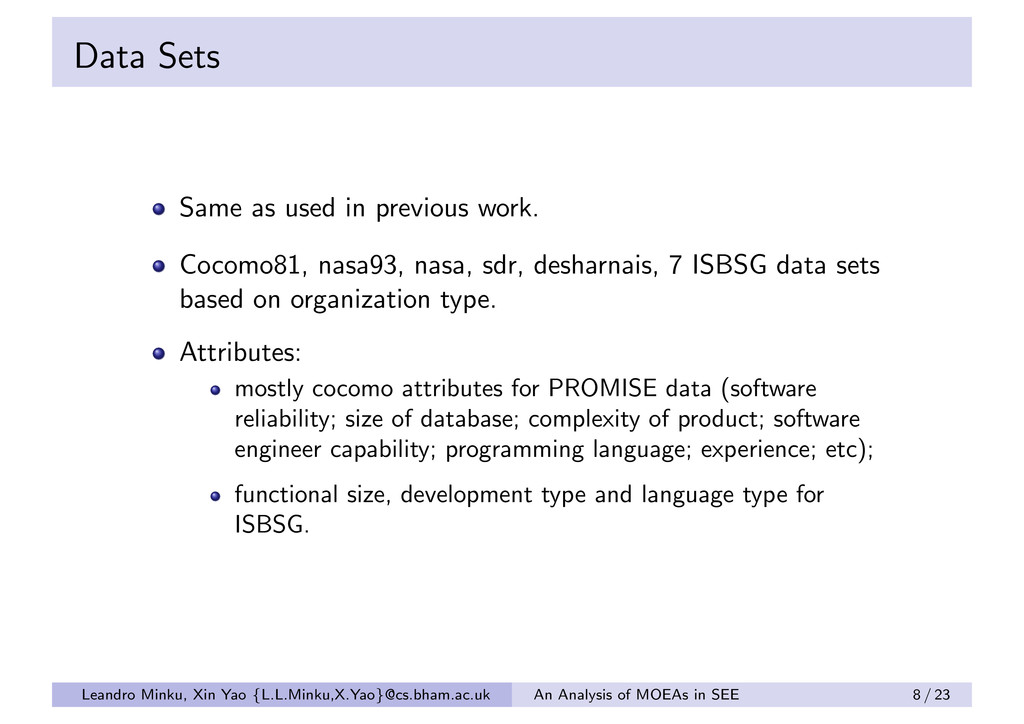
nasa, sdr, desharnais, 7 ISBSG data sets based on organization type. Attributes: mostly cocomo attributes for PROMISE data (software reliability; size of database; complexity of product; software engineer capability; programming language; experience; etc); functional size, development type and language type for ISBSG. Leandro Minku, Xin Yao {L.L.Minku,X.Yao}@cs.bham.ac.uk An Analysis of MOEAs in SEE 8 / 23
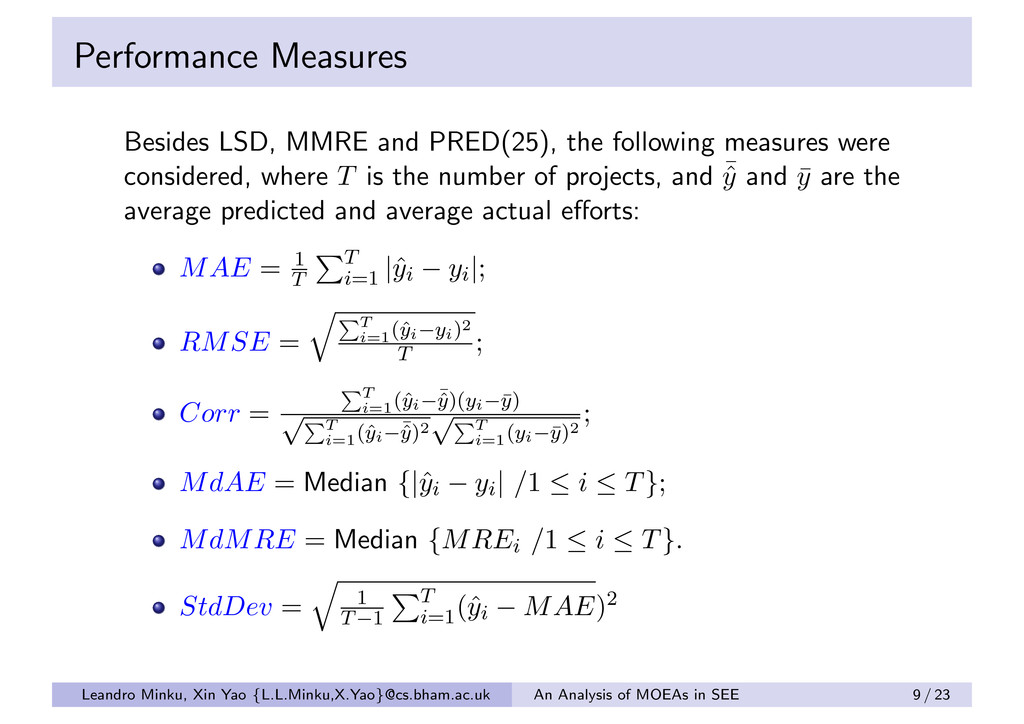
were considered, where T is the number of projects, and ¯ ˆ y and ¯ y are the average predicted and average actual efforts: MAE = 1 T T i=1 |ˆ yi − yi|; RMSE = T i=1 (ˆ yi−yi)2 T ; Corr = T i=1 (ˆ yi−¯ ˆ y)(yi−¯ y) √ T i=1 (ˆ yi−¯ ˆ y)2 √ T i=1 (yi−¯ y)2 ; MdAE = Median {|ˆ yi − yi| /1 ≤ i ≤ T}; MdMRE = Median {MREi /1 ≤ i ≤ T}. StdDev = 1 T−1 T i=1 (ˆ yi − MAE)2 Leandro Minku, Xin Yao {L.L.Minku,X.Yao}@cs.bham.ac.uk An Analysis of MOEAs in SEE 9 / 23
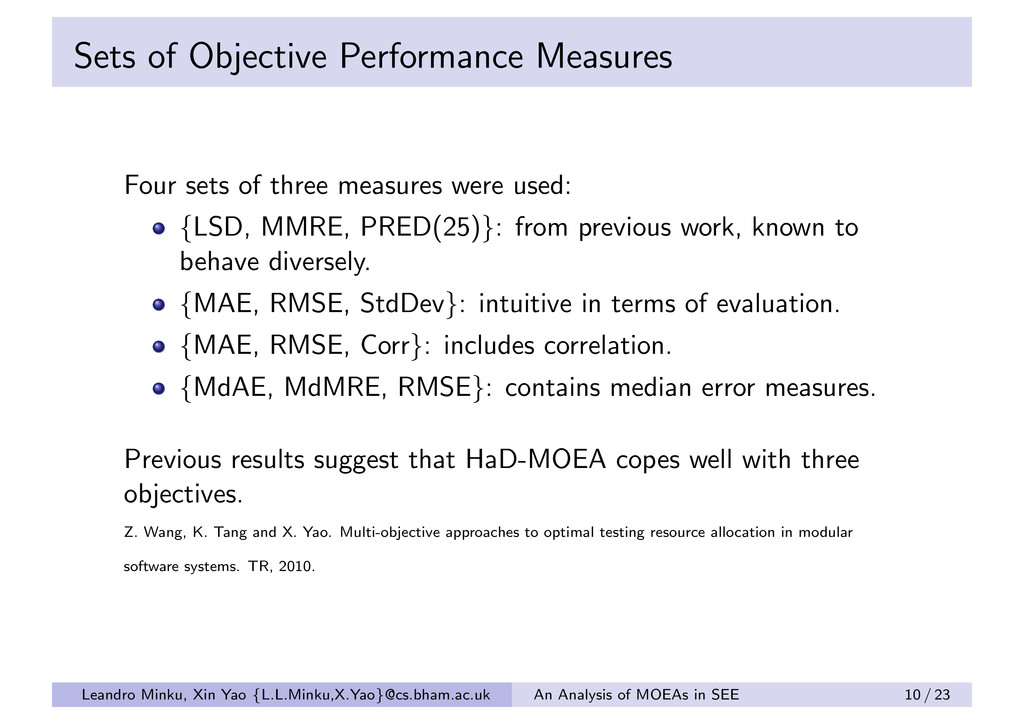
were used: {LSD, MMRE, PRED(25)}: from previous work, known to behave diversely. {MAE, RMSE, StdDev}: intuitive in terms of evaluation. {MAE, RMSE, Corr}: includes correlation. {MdAE, MdMRE, RMSE}: contains median error measures. Previous results suggest that HaD-MOEA copes well with three objectives. Z. Wang, K. Tang and X. Yao. Multi-objective approaches to optimal testing resource allocation in modular software systems. TR, 2010. Leandro Minku, Xin Yao {L.L.Minku,X.Yao}@cs.bham.ac.uk An Analysis of MOEAs in SEE 10 / 23
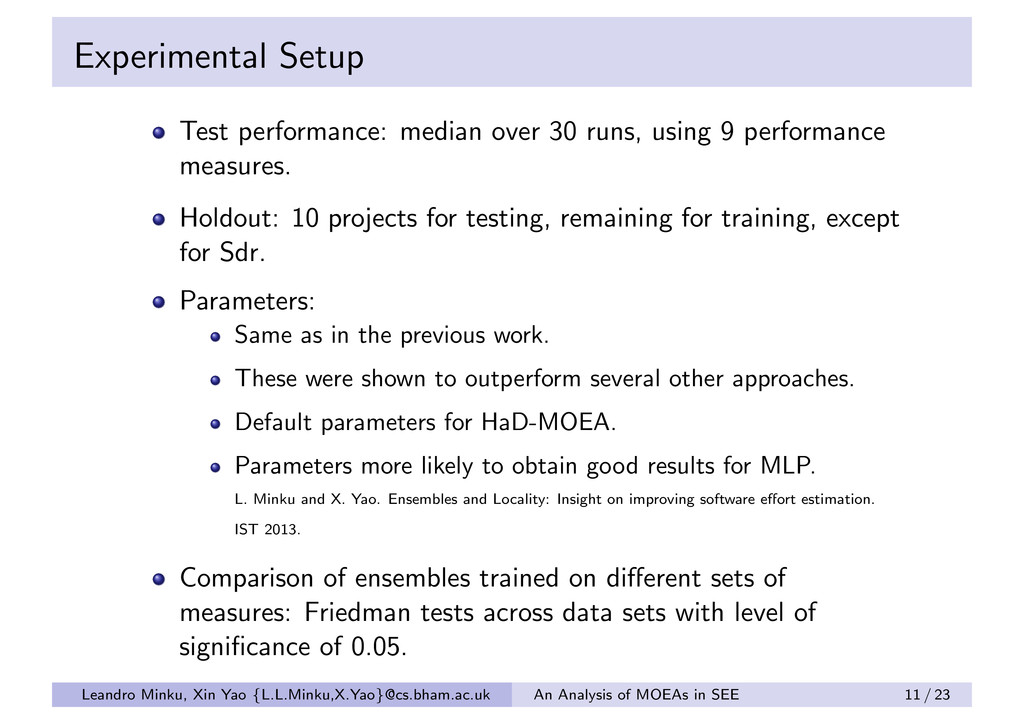
performance measures. Holdout: 10 projects for testing, remaining for training, except for Sdr. Parameters: Same as in the previous work. These were shown to outperform several other approaches. Default parameters for HaD-MOEA. Parameters more likely to obtain good results for MLP. L. Minku and X. Yao. Ensembles and Locality: Insight on improving software effort estimation. IST 2013. Comparison of ensembles trained on different sets of measures: Friedman tests across data sets with level of significance of 0.05. Leandro Minku, Xin Yao {L.L.Minku,X.Yao}@cs.bham.ac.uk An Analysis of MOEAs in SEE 11 / 23
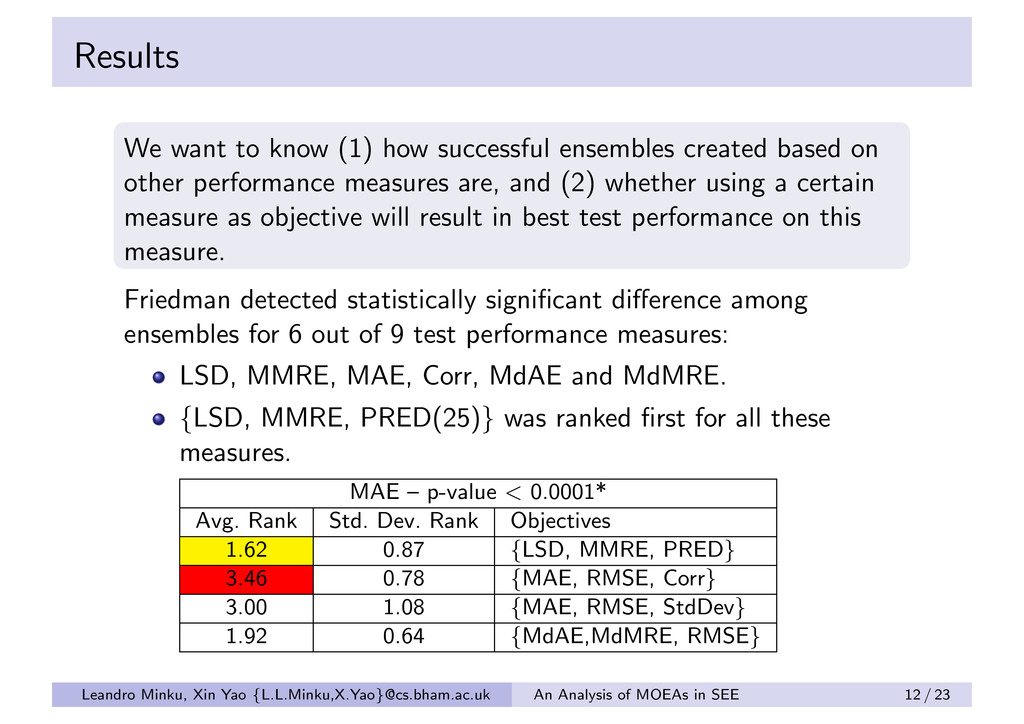
based on other performance measures are, and (2) whether using a certain measure as objective will result in best test performance on this measure. Friedman detected statistically significant difference among ensembles for 6 out of 9 test performance measures: LSD, MMRE, MAE, Corr, MdAE and MdMRE. {LSD, MMRE, PRED(25)} was ranked first for all these measures. MAE – p-value < 0.0001* Avg. Rank Std. Dev. Rank Objectives 1.62 0.87 {LSD, MMRE, PRED} 3.46 0.78 {MAE, RMSE, Corr} 3.00 1.08 {MAE, RMSE, StdDev} 1.92 0.64 {MdAE,MdMRE, RMSE} Leandro Minku, Xin Yao {L.L.Minku,X.Yao}@cs.bham.ac.uk An Analysis of MOEAs in SEE 12 / 23
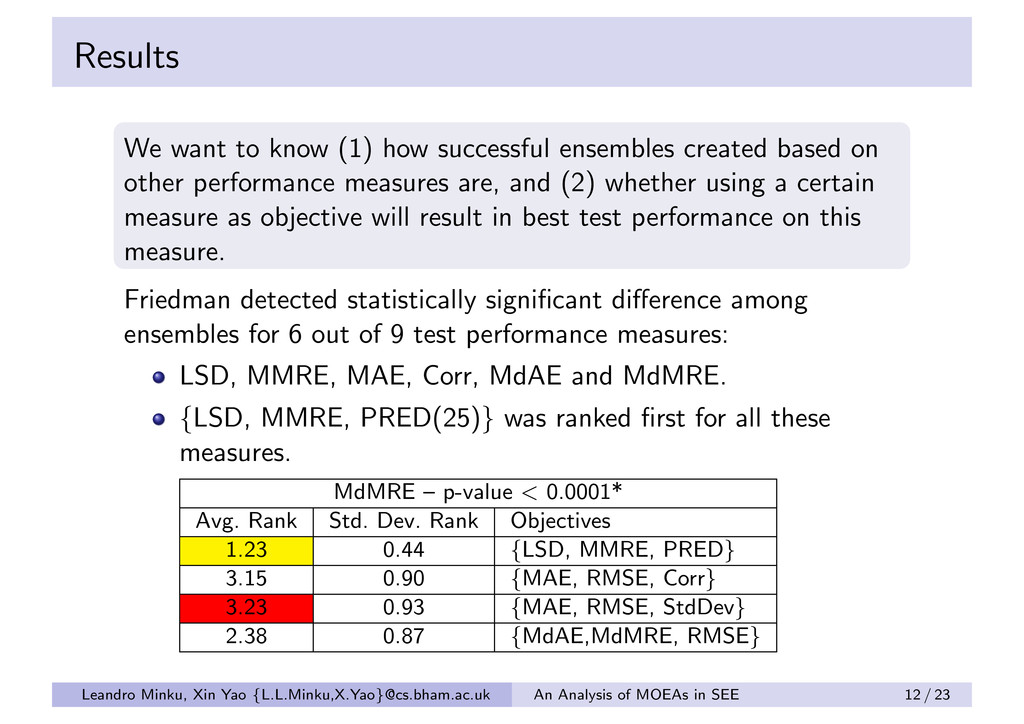
based on other performance measures are, and (2) whether using a certain measure as objective will result in best test performance on this measure. Friedman detected statistically significant difference among ensembles for 6 out of 9 test performance measures: LSD, MMRE, MAE, Corr, MdAE and MdMRE. {LSD, MMRE, PRED(25)} was ranked first for all these measures. MdMRE – p-value < 0.0001* Avg. Rank Std. Dev. Rank Objectives 1.23 0.44 {LSD, MMRE, PRED} 3.15 0.90 {MAE, RMSE, Corr} 3.23 0.93 {MAE, RMSE, StdDev} 2.38 0.87 {MdAE,MdMRE, RMSE} Leandro Minku, Xin Yao {L.L.Minku,X.Yao}@cs.bham.ac.uk An Analysis of MOEAs in SEE 12 / 23
best. However, still statistically significantly worse in terms of LSD and MdMRE. Confirmed with Wilcoxon tests. {MAE, RMSE, Corr} was ranked last for all measures but MdMRE, where it was very similar to the last. Leandro Minku, Xin Yao {L.L.Minku,X.Yao}@cs.bham.ac.uk An Analysis of MOEAs in SEE 13 / 23
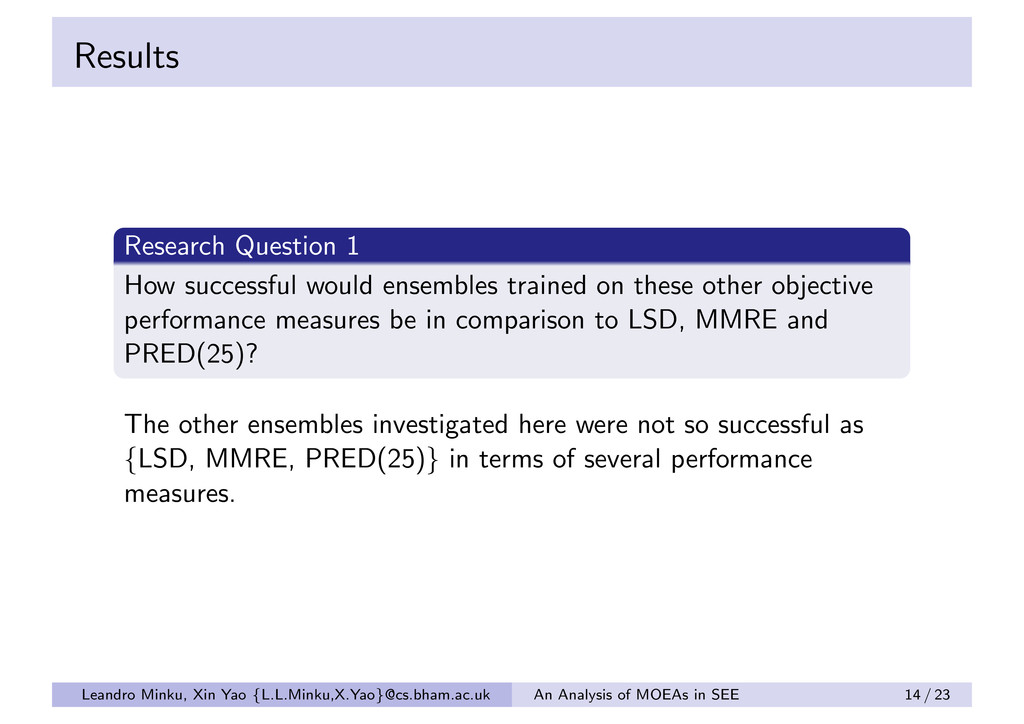
these other objective performance measures be in comparison to LSD, MMRE and PRED(25)? The other ensembles investigated here were not so successful as {LSD, MMRE, PRED(25)} in terms of several performance measures. Leandro Minku, Xin Yao {L.L.Minku,X.Yao}@cs.bham.ac.uk An Analysis of MOEAs in SEE 14 / 23
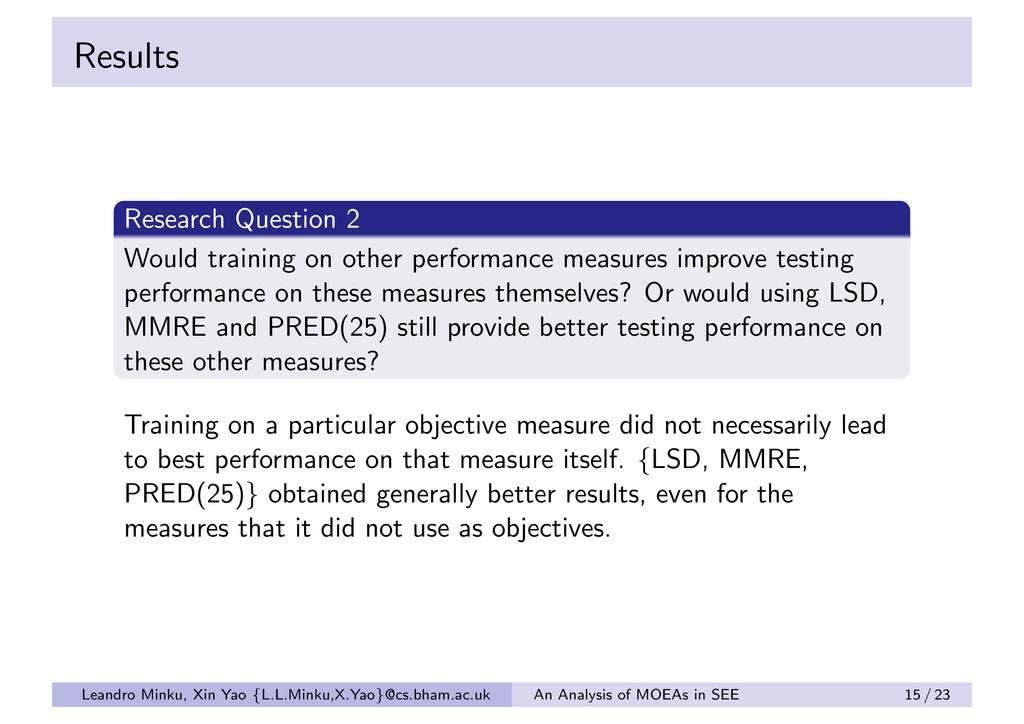
improve testing performance on these measures themselves? Or would using LSD, MMRE and PRED(25) still provide better testing performance on these other measures? Training on a particular objective measure did not necessarily lead to best performance on that measure itself. {LSD, MMRE, PRED(25)} obtained generally better results, even for the measures that it did not use as objectives. Leandro Minku, Xin Yao {L.L.Minku,X.Yao}@cs.bham.ac.uk An Analysis of MOEAs in SEE 15 / 23
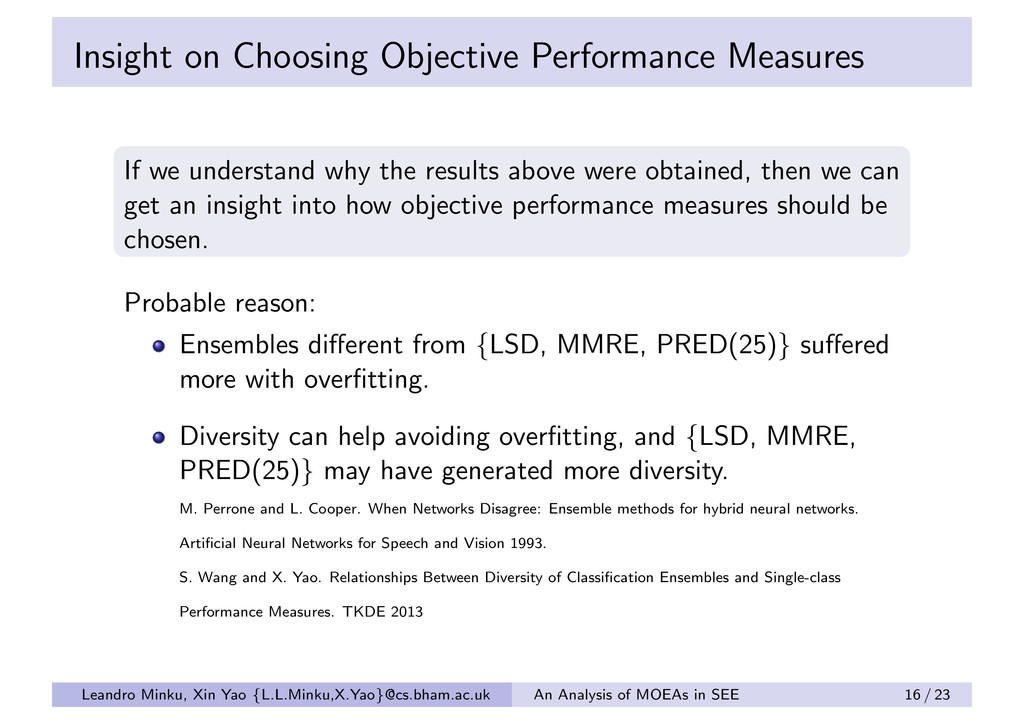
the results above were obtained, then we can get an insight into how objective performance measures should be chosen. Probable reason: Ensembles different from {LSD, MMRE, PRED(25)} suffered more with overfitting. Diversity can help avoiding overfitting, and {LSD, MMRE, PRED(25)} may have generated more diversity. M. Perrone and L. Cooper. When Networks Disagree: Ensemble methods for hybrid neural networks. Artificial Neural Networks for Speech and Vision 1993. S. Wang and X. Yao. Relationships Between Diversity of Classification Ensembles and Single-class Performance Measures. TKDE 2013 Leandro Minku, Xin Yao {L.L.Minku,X.Yao}@cs.bham.ac.uk An Analysis of MOEAs in SEE 16 / 23
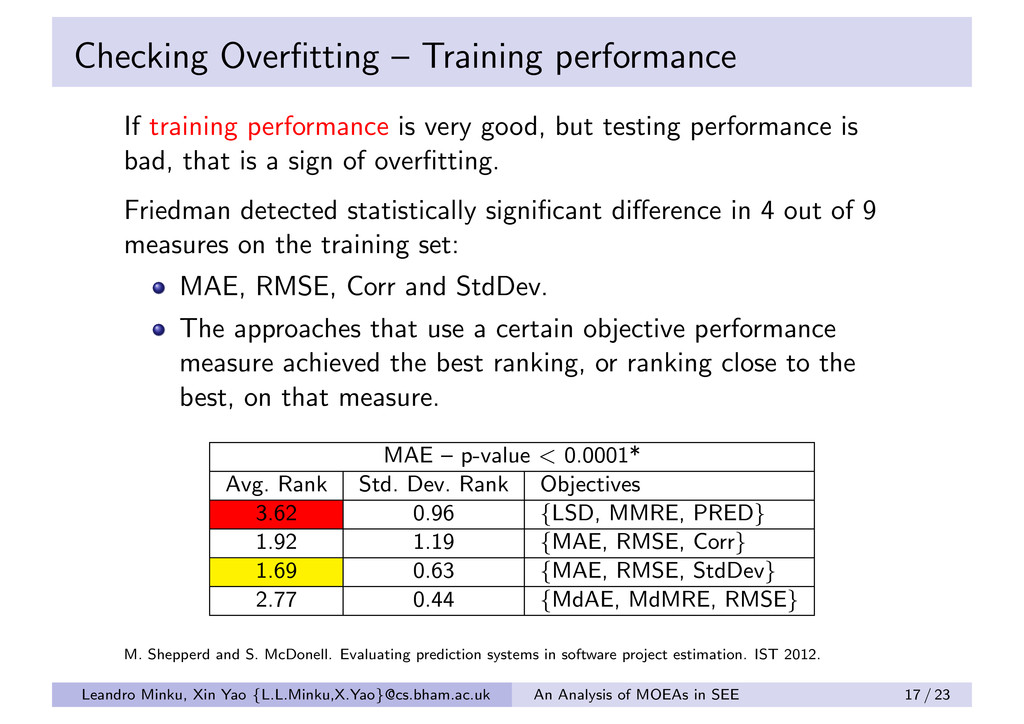
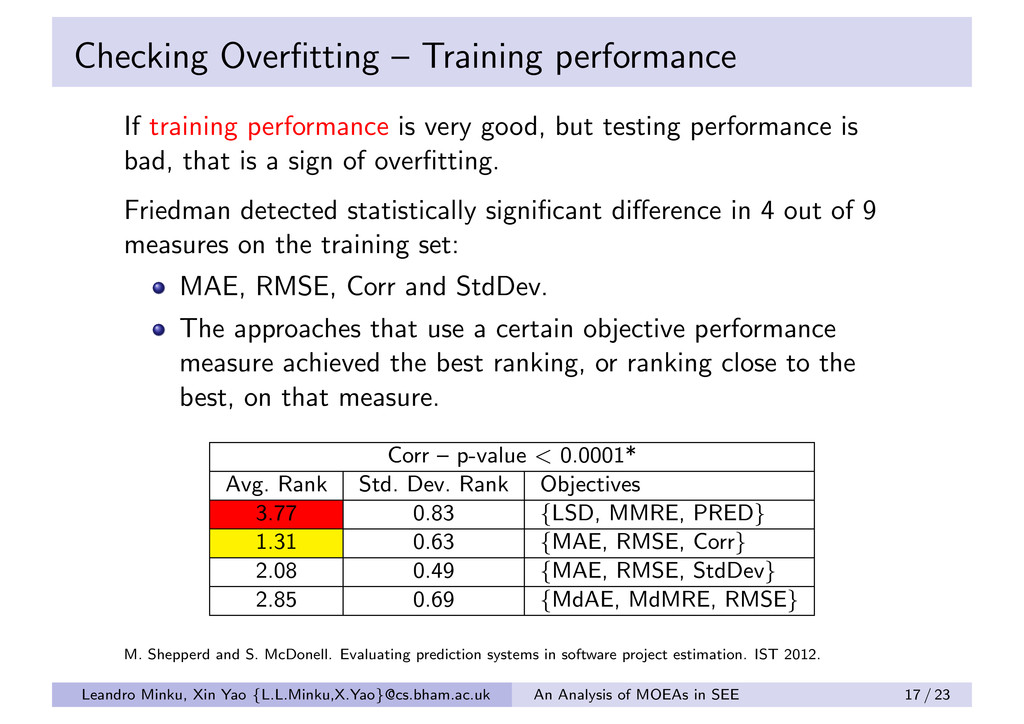
good, but testing performance is bad, that is a sign of overfitting. Friedman detected statistically significant difference in 4 out of 9 measures on the training set: MAE, RMSE, Corr and StdDev. The approaches that use a certain objective performance measure achieved the best ranking, or ranking close to the best, on that measure. MAE – p-value < 0.0001* Avg. Rank Std. Dev. Rank Objectives 3.62 0.96 {LSD, MMRE, PRED} 1.92 1.19 {MAE, RMSE, Corr} 1.69 0.63 {MAE, RMSE, StdDev} 2.77 0.44 {MdAE, MdMRE, RMSE} M. Shepperd and S. McDonell. Evaluating prediction systems in software project estimation. IST 2012. Leandro Minku, Xin Yao {L.L.Minku,X.Yao}@cs.bham.ac.uk An Analysis of MOEAs in SEE 17 / 23
good, but testing performance is bad, that is a sign of overfitting. Friedman detected statistically significant difference in 4 out of 9 measures on the training set: MAE, RMSE, Corr and StdDev. The approaches that use a certain objective performance measure achieved the best ranking, or ranking close to the best, on that measure. Corr – p-value < 0.0001* Avg. Rank Std. Dev. Rank Objectives 3.77 0.83 {LSD, MMRE, PRED} 1.31 0.63 {MAE, RMSE, Corr} 2.08 0.49 {MAE, RMSE, StdDev} 2.85 0.69 {MdAE, MdMRE, RMSE} M. Shepperd and S. McDonell. Evaluating prediction systems in software project estimation. IST 2012. Leandro Minku, Xin Yao {L.L.Minku,X.Yao}@cs.bham.ac.uk An Analysis of MOEAs in SEE 17 / 23
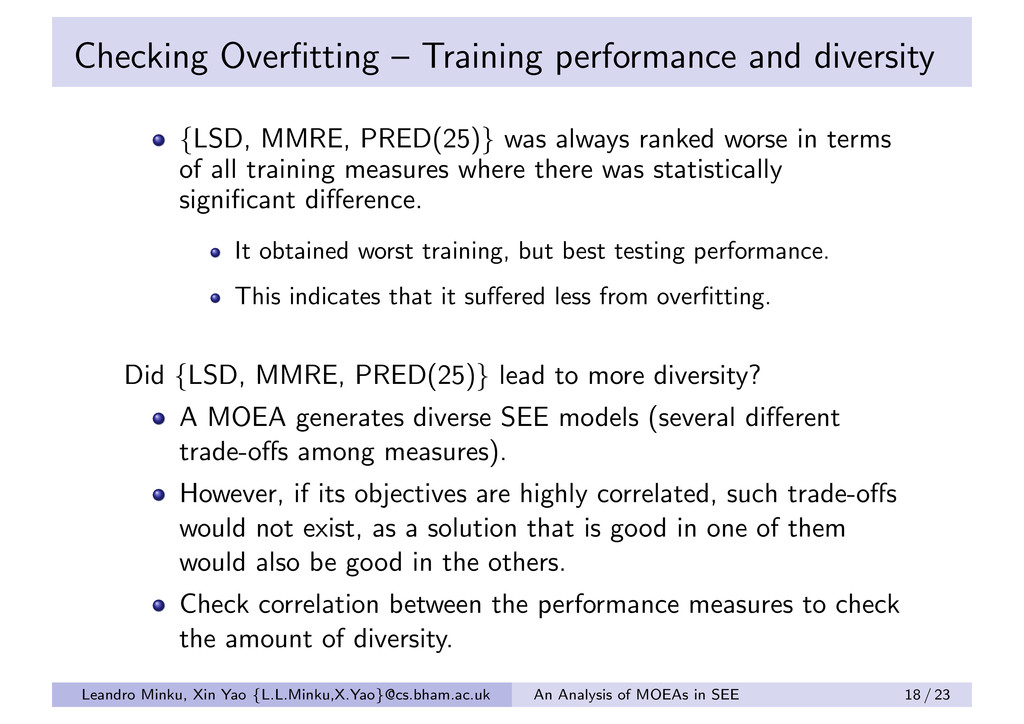
was always ranked worse in terms of all training measures where there was statistically significant difference. It obtained worst training, but best testing performance. This indicates that it suffered less from overfitting. Did {LSD, MMRE, PRED(25)} lead to more diversity? A MOEA generates diverse SEE models (several different trade-offs among measures). However, if its objectives are highly correlated, such trade-offs would not exist, as a solution that is good in one of them would also be good in the others. Check correlation between the performance measures to check the amount of diversity. Leandro Minku, Xin Yao {L.L.Minku,X.Yao}@cs.bham.ac.uk An Analysis of MOEAs in SEE 18 / 23
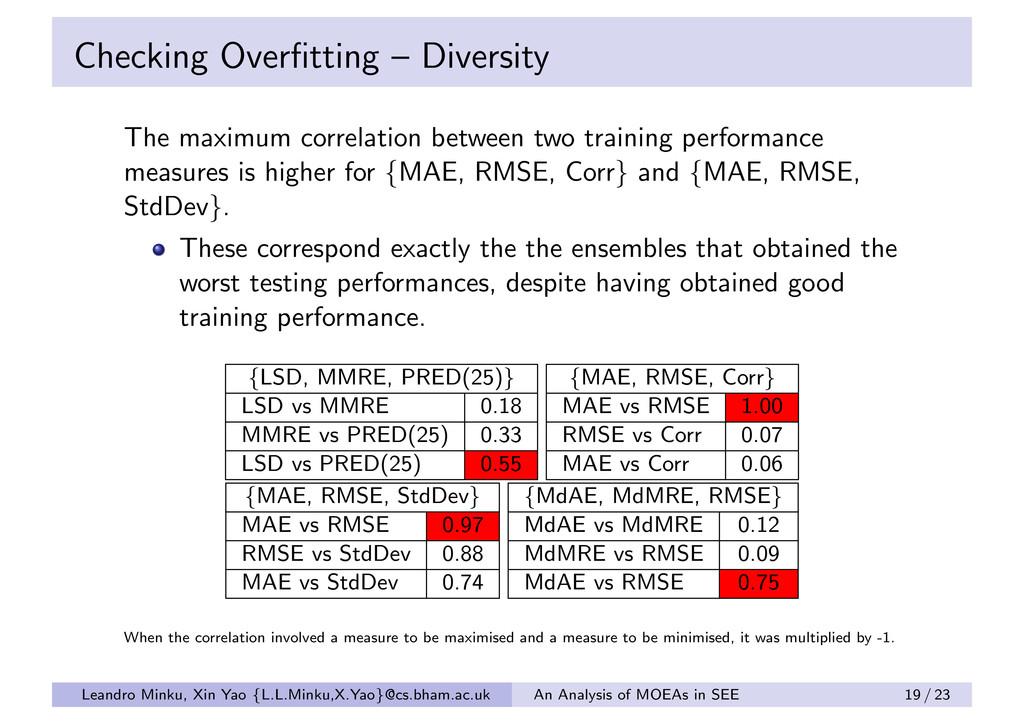
performance measures is higher for {MAE, RMSE, Corr} and {MAE, RMSE, StdDev}. These correspond exactly the the ensembles that obtained the worst testing performances, despite having obtained good training performance. {LSD, MMRE, PRED(25)} LSD vs MMRE 0.18 MMRE vs PRED(25) 0.33 LSD vs PRED(25) 0.55 {MAE, RMSE, Corr} MAE vs RMSE 1.00 RMSE vs Corr 0.07 MAE vs Corr 0.06 {MAE, RMSE, StdDev} MAE vs RMSE 0.97 RMSE vs StdDev 0.88 MAE vs StdDev 0.74 {MdAE, MdMRE, RMSE} MdAE vs MdMRE 0.12 MdMRE vs RMSE 0.09 MdAE vs RMSE 0.75 When the correlation involved a measure to be maximised and a measure to be minimised, it was multiplied by -1. Leandro Minku, Xin Yao {L.L.Minku,X.Yao}@cs.bham.ac.uk An Analysis of MOEAs in SEE 19 / 23
should be a primary consideration in forming the group of objectives. Leandro Minku, Xin Yao {L.L.Minku,X.Yao}@cs.bham.ac.uk An Analysis of MOEAs in SEE 20 / 23
SEE models representing different trade-offs. Previous work used only the best according to the training performance on each objective measure. Including more models might provide better results. Research Question 3 Is it better to use all SEE models produced by the MOEA, or solely the ones with the best training performance on each measure? Result: there was no inherent advantage in using more SEE models in comparison to using the best model according to each measure. Leandro Minku, Xin Yao {L.L.Minku,X.Yao}@cs.bham.ac.uk An Analysis of MOEAs in SEE 21 / 23
based on four combinations of objective performance measures. {LSD, MMRE, PRED(25)} lead to a good level of diversity, and thus was more successful in terms of several performance measures. Using a certain objective measure does not necessarily lead to the best test performance on that measure. Probable reason: overfitting. Diversity may help avoiding overfitting, and should be a primary consideration when choosing objective performance measures. No inherent advantage was found in using another scheme than the best model according to each measure to choose models to compose the ensemble. Leandro Minku, Xin Yao {L.L.Minku,X.Yao}@cs.bham.ac.uk An Analysis of MOEAs in SEE 22 / 23
performance measures and combinations. Impact of using other MOEAs and parameters. Use of MOEAs for creating other types of SEE models. The relationship between low ensemble diversity and overfitting. Leandro Minku, Xin Yao {L.L.Minku,X.Yao}@cs.bham.ac.uk An Analysis of MOEAs in SEE 23 / 23