Upgrade to Pro
— share decks privately, control downloads, hide ads and more …
Speaker Deck
Features
Speaker Deck
PRO
Sign in
Sign up for free
Search
Search
Atelier Datalab - volet technique
Search
Providenz - Laurent Paoletti
September 29, 2014
Technology
82
0
Share
Embed
Copy iframe code
Copy JS code
Copy link
Start on current slide
Atelier Datalab - volet technique
Stockage, analyse, visualisation de données et machine learning
Providenz - Laurent Paoletti
September 29, 2014
More Decks by Providenz - Laurent Paoletti
See All by Providenz - Laurent Paoletti
Introduction au machine learning
providenz
0
220
Des builds front plus rapides
providenz
0
55
Back to front
providenz
0
170
Machine Learning for the rest of us
providenz
1
200
Brunch, le builder pour les developpeurs pressés
providenz
0
170
Postgresql la plateforme de vos données
providenz
0
270
Performance web (Brown bag lunch)
providenz
0
50
Montée en charge
providenz
0
50
Présentation de django
providenz
0
50
Other Decks in Technology
See All in Technology
生成AIの活用/high_school2026
okana2ki
0
110
なぜ人は自分のプロジェクトを 「なんちゃってアジャイル」と 自嘲するのか
kozotaira
0
260
アラート調査向けAIエージェントの本番導入とその後/AI Agents for Alert Investigation: Production Deployment and After
taddy_919
1
390
『AIに負けない』より『AIと遊ぶ』」〜ワクワクが最強のテスト・QA学習戦略_公開用
odan611
1
450
Road to SRE NEXTの今までとこれから
hiroyaonoe
0
130
Claude Codeとハーネスについて考えてみる
oikon48
18
8.6k
4人目のSREはAgent
tanimuyk
0
400
AIで政治は変わるのか? — 中高生と考えたAI時代の民主主義(東海高校サタデープログラム)
eitarosuda
0
400
小さいから、全部わかる。— 常駐AI "xangi" のすすめ
sugupoko
0
270
cccccc
moznion
0
1.8k
Terraform共通モジュールをチーム横断で“変えられる”運用へ ― リリースと適用の分離
kekke_n
0
640
FinOps X 2026 Recap from Engineer Side #JapanFinOps
chacco38
0
260
Featured
See All Featured
Let's Do A Bunch of Simple Stuff to Make Websites Faster
chriscoyier
508
140k
Marketing Yourself as an Engineer | Alaka | Gurzu
gurzu
0
260
For a Future-Friendly Web
brad_frost
183
10k
Leading Effective Engineering Teams in the AI Era
addyosmani
9
2.1k
From π to Pie charts
rasagy
0
230
Sam Torres - BigQuery for SEOs
techseoconnect
PRO
0
300
Cheating the UX When There Is Nothing More to Optimize - PixelPioneers
stephaniewalter
287
14k
jQuery: Nuts, Bolts and Bling
dougneiner
66
8.5k
How to train your dragon (web standard)
notwaldorf
97
6.7k
実際に使うSQLの書き方 徹底解説 / pgcon21j-tutorial
soudai
PRO
201
75k
Agile Leadership in an Agile Organization
kimpetersen
PRO
0
180
Gemini Prompt Engineering: Practical Techniques for Tangible AI Outcomes
mfonobong
2
460
Transcript
DATALAB l ’atelier Laurent Paoletti @providenz TVT - 29 septembre
2014
DATA BIG DATA DATASCIENCE définitions
VOLUME VÉLOCITÉ VARIÉTÉ COMPLEXITÉ critères
DONNÉES STRUCTURÉES SEMI-STRUCTURÉES NON STRUCTURÉES typologie
TEXTE HORODATEES GÉOGRAPHIQUES SCIENCE - FINANCE LOGS GRAPHE IMAGE/SON/VIDEO typologie
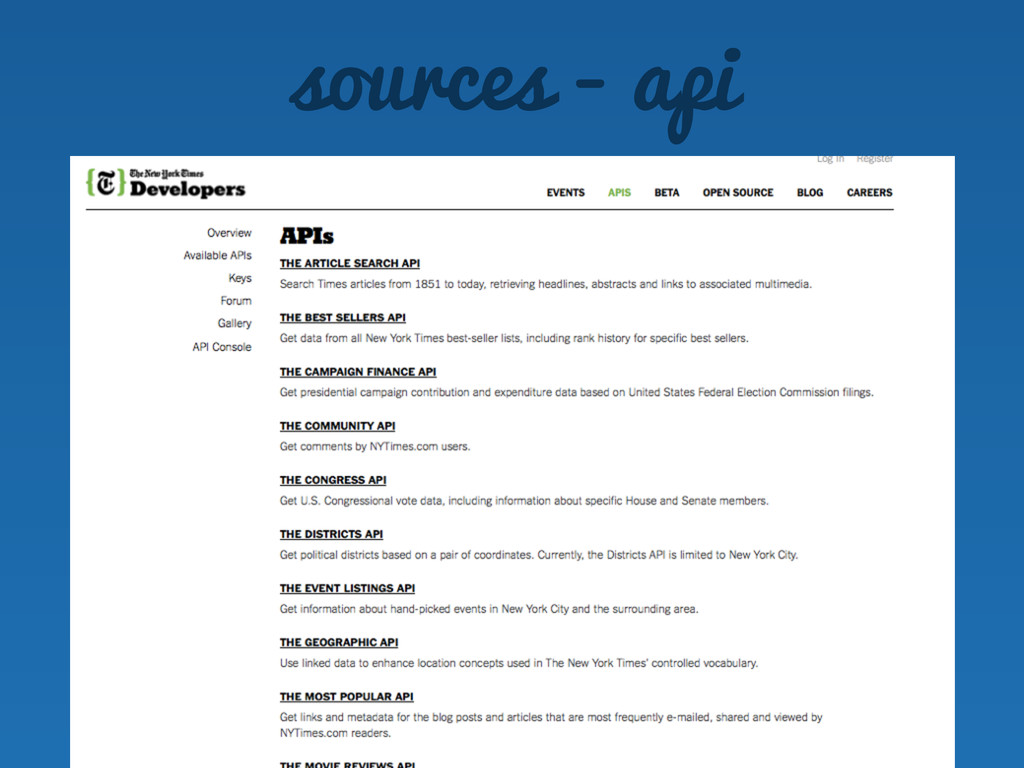
OPENDATA SERVICES - API ORGANIQUE CROWDSOURCING OBJETS CONNECTÉS ACHAT SCRAPING
- EXTRACTION sources
sources - api
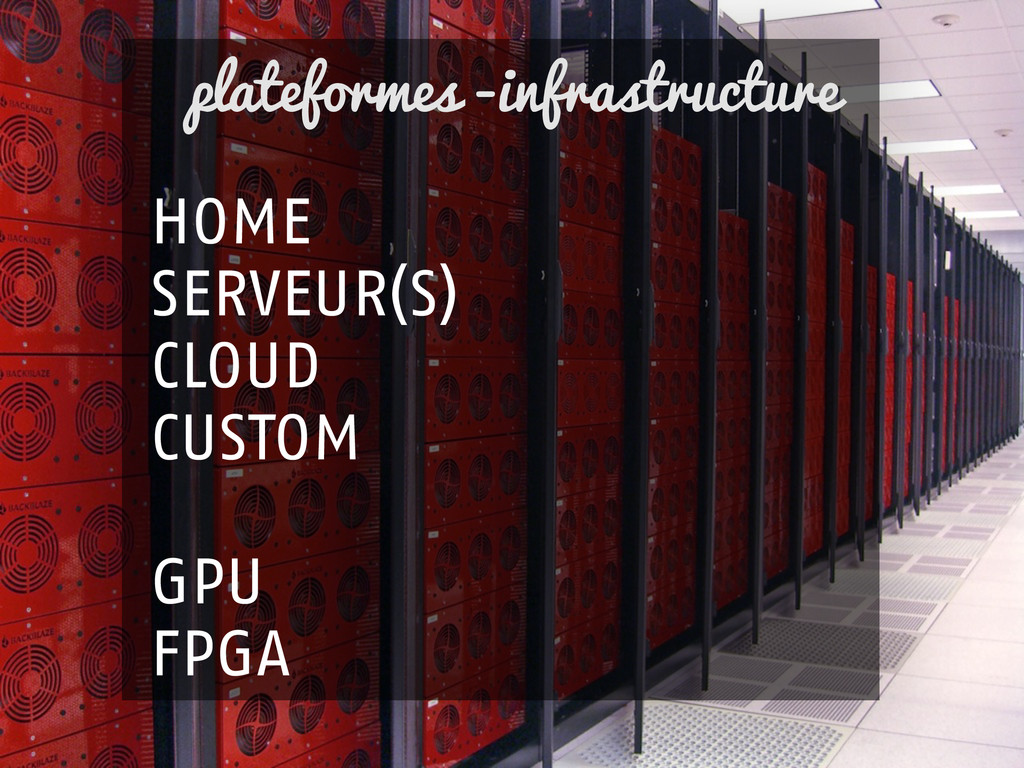
HOME SERVEUR(S) CLOUD CUSTOM ! GPU FPGA plateformes -infrastructure
FICHIERS excel csv hdf5 plateformes -persistance
DB RELATIONELLES ! MYSQL POSTGRESQL SQLSERVER, ORACLE plateformes -persistance
SIG:POSTGIS plateformes -persistance
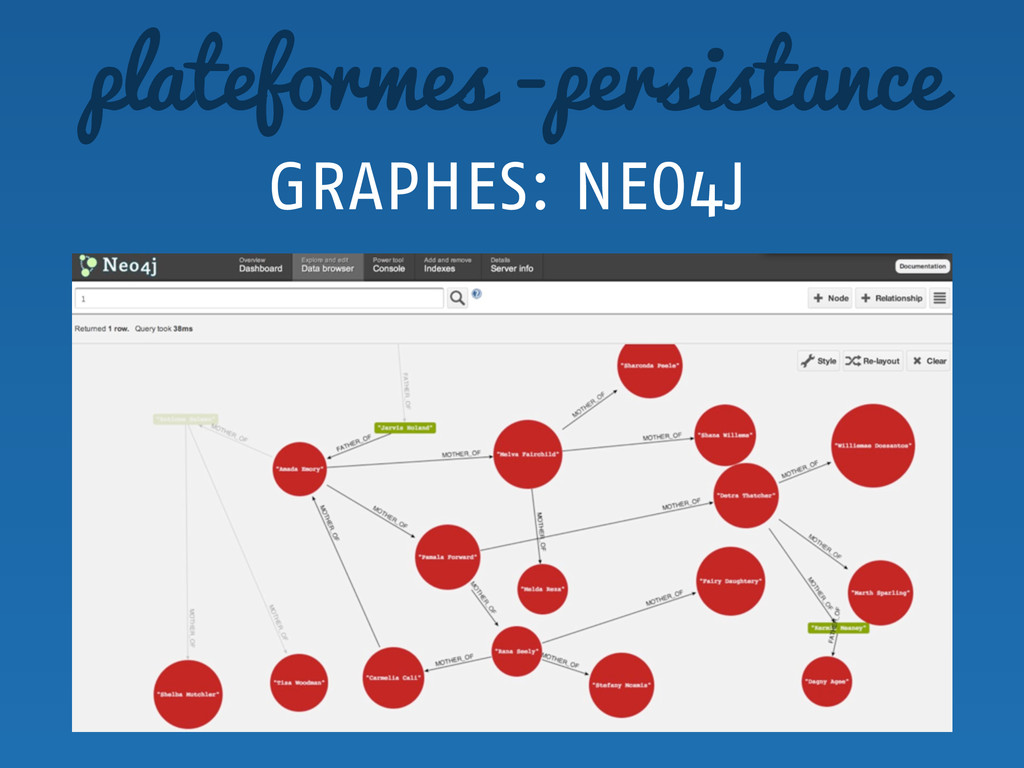
GRAPHES: NEO4J plateformes -persistance
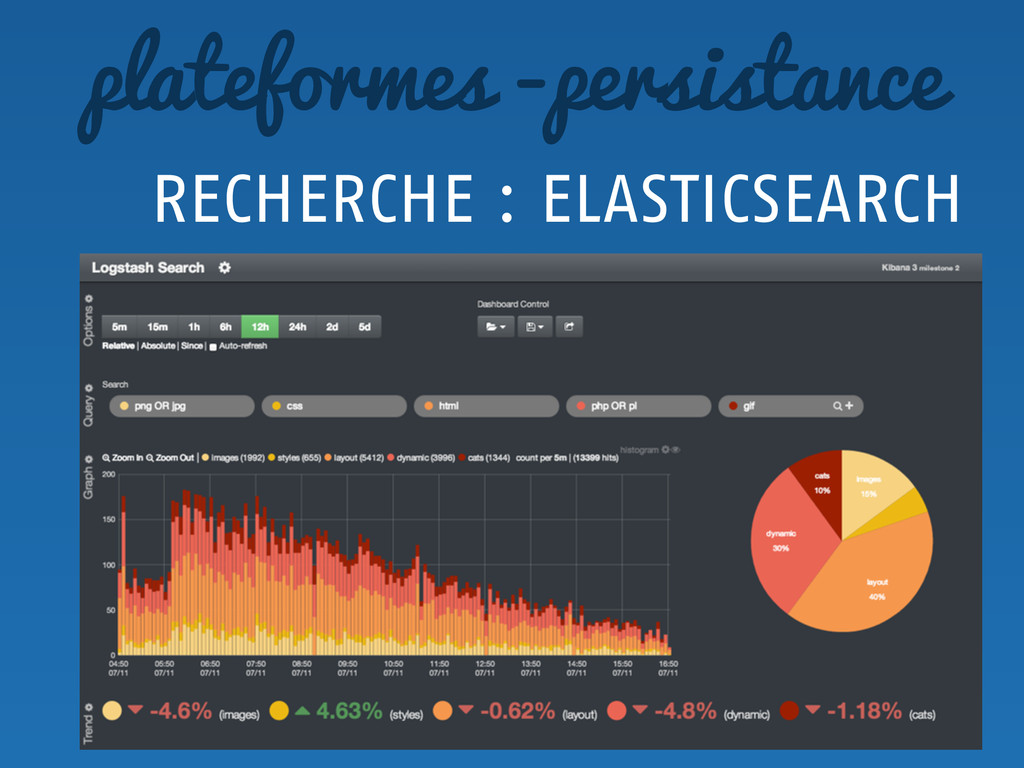
RECHERCHE : ELASTICSEARCH plateformes -persistance
HADOOP SPARK HBASE plateformes -persistance
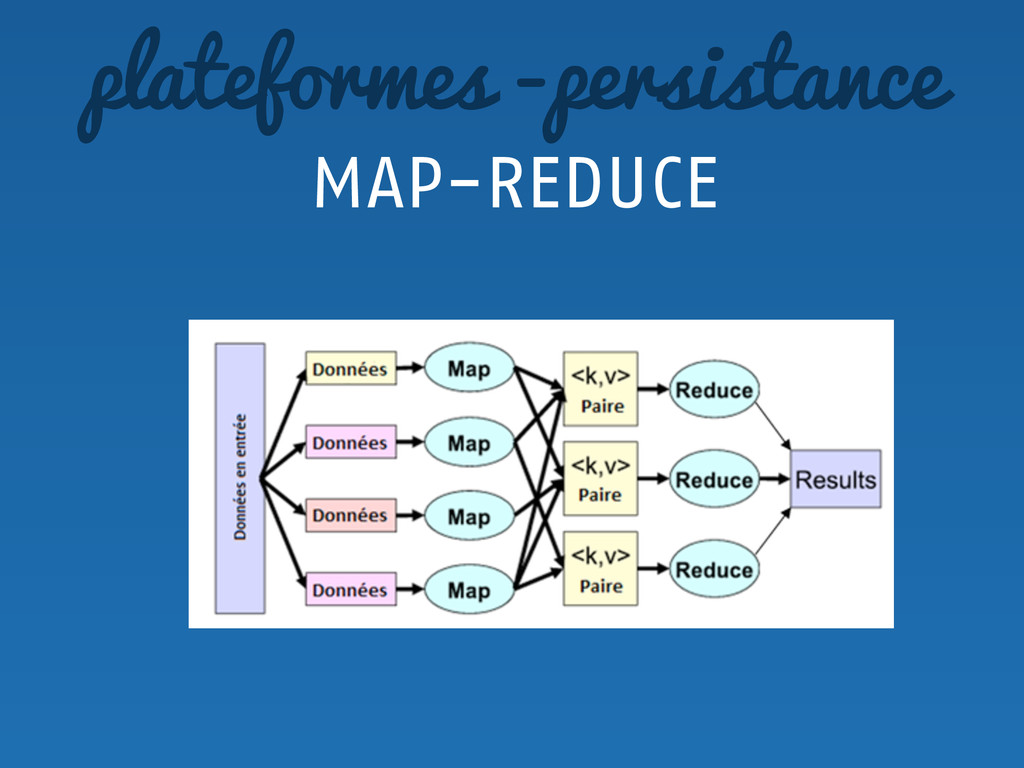
MAP-REDUCE plateformes -persistance
EXTRACTION NETTOYAGE ETL analyse - préparation
FILTRAGE TRANSFORMATION STATISTIQUES analyse
R SQL PYTHON OPENREFINE analyse - outils
« capacité qu’on donne à une machine d’ingérer des données
à apprendre et de s’enrichir grâce à son expérience » machine learning
machine learning ANTI-SPAM RECOMMANDATIONS SCORING OPTIMISATION DE PRIX IDENTIFICATION
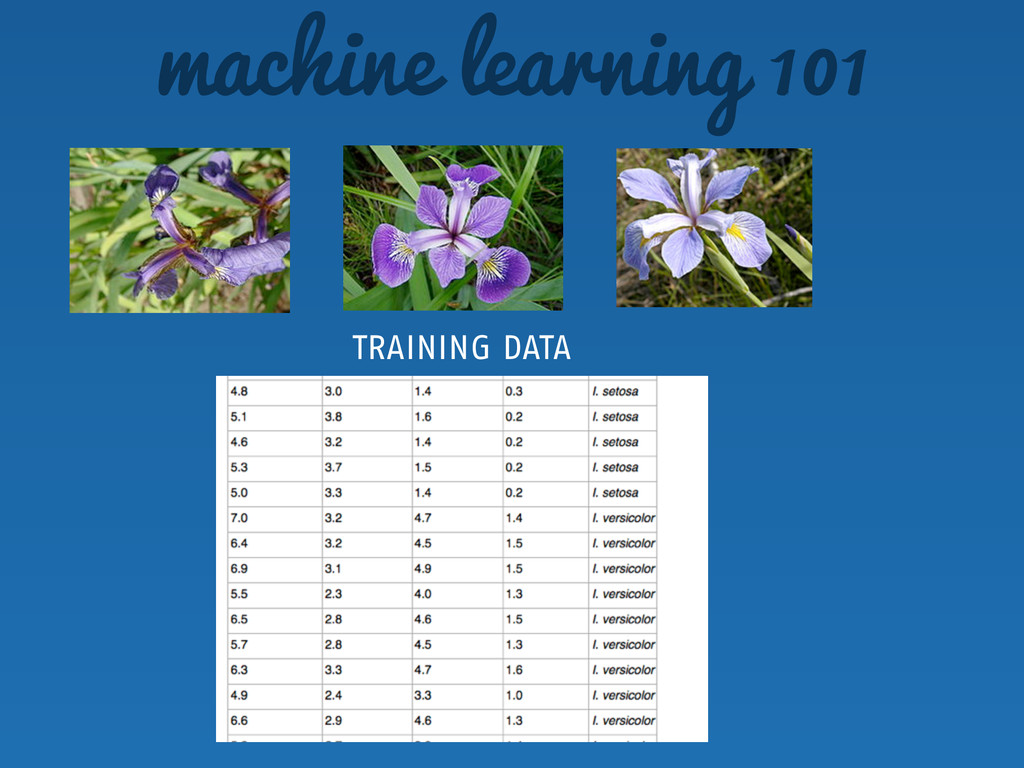
TRAINING DATA machine learning 101
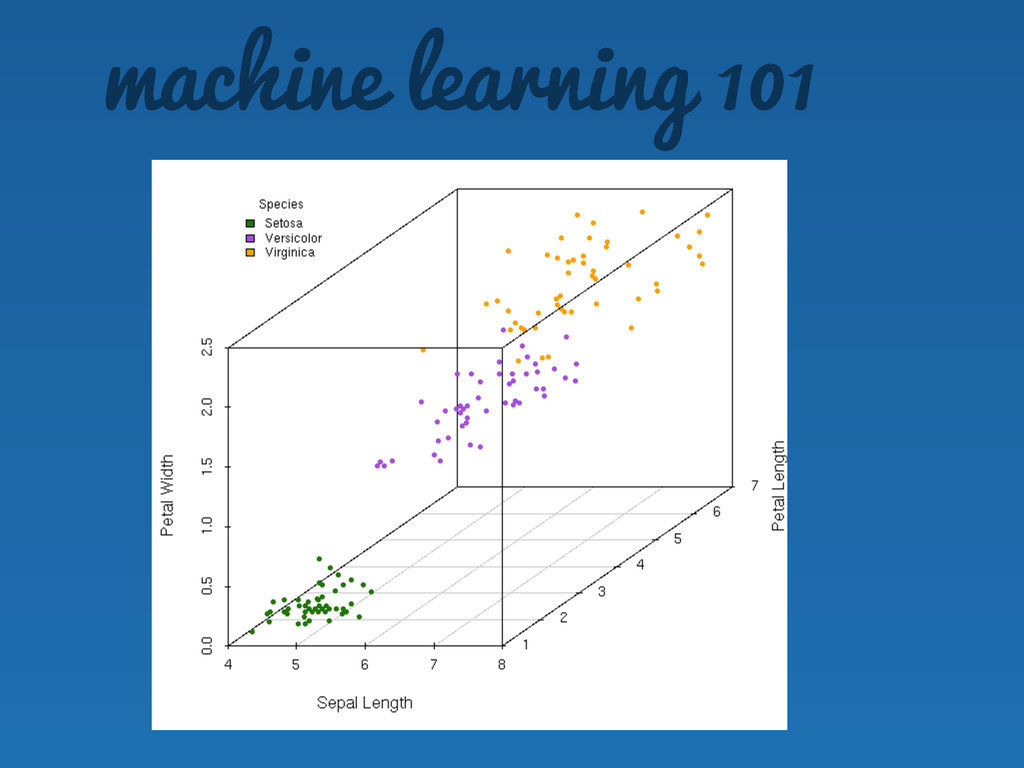
machine learning 101
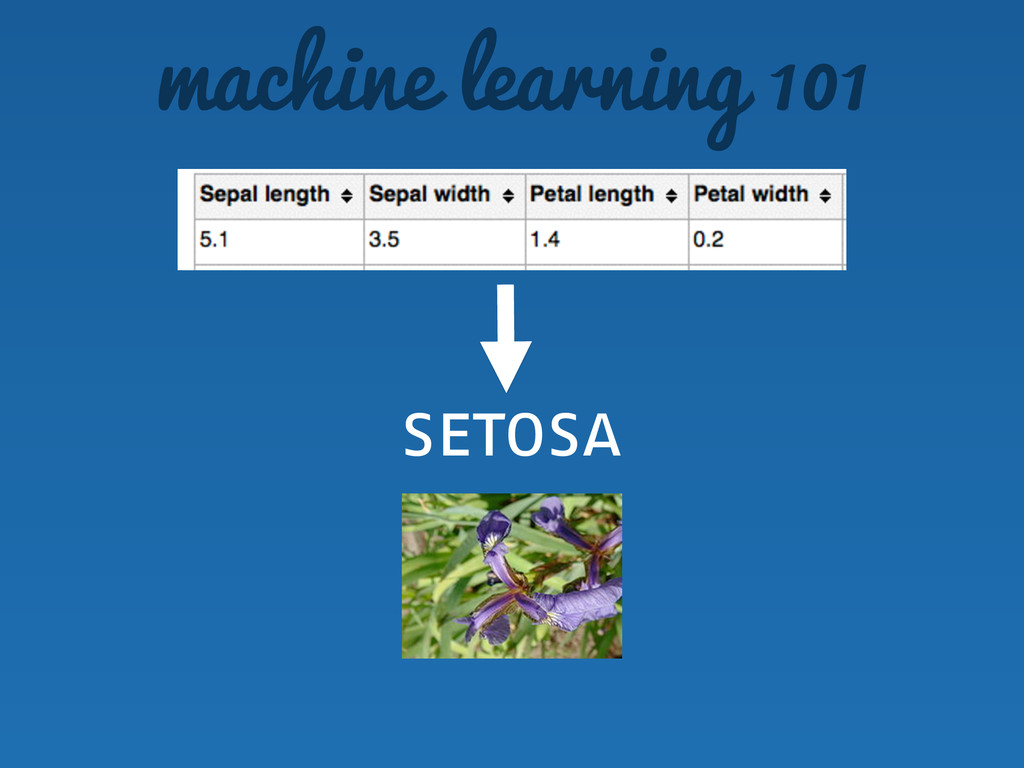
machine learning 101 setosa
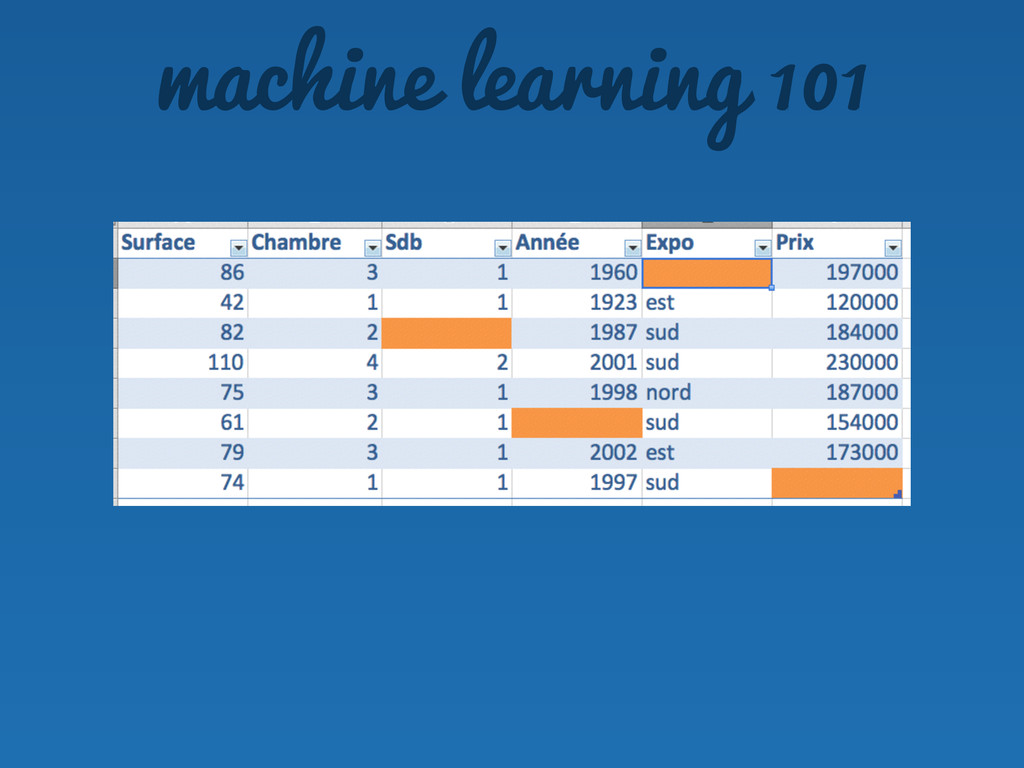
machine learning 101
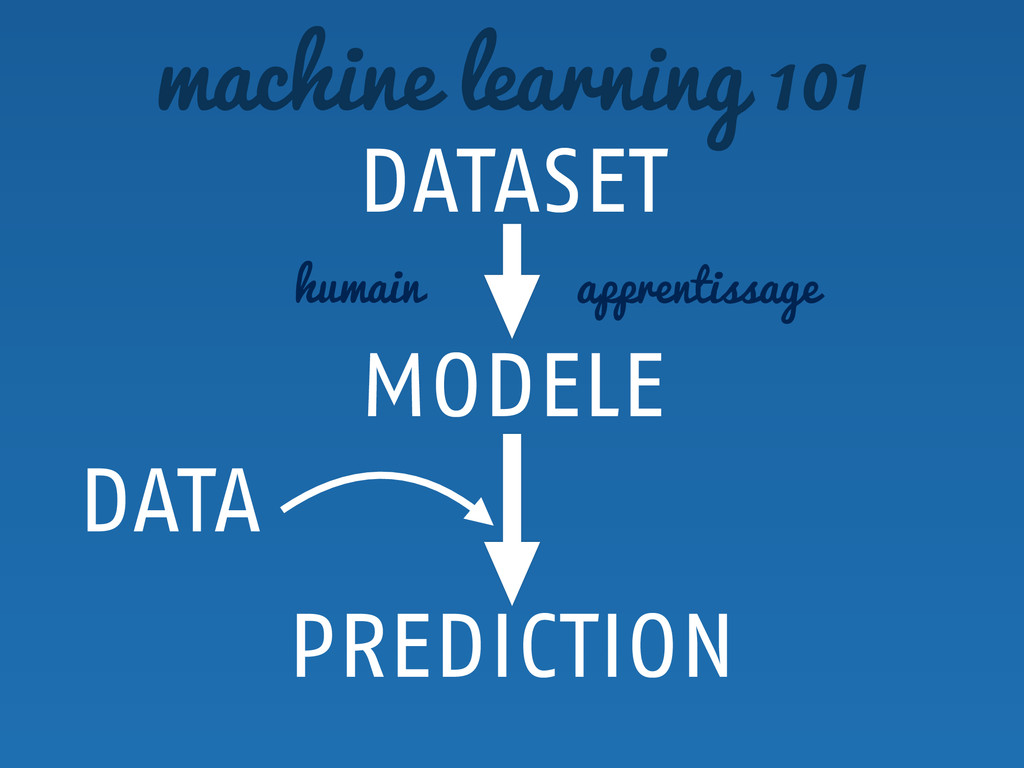
machine learning 101 DATASET MODELE DATA PREDICTION apprentissage humain
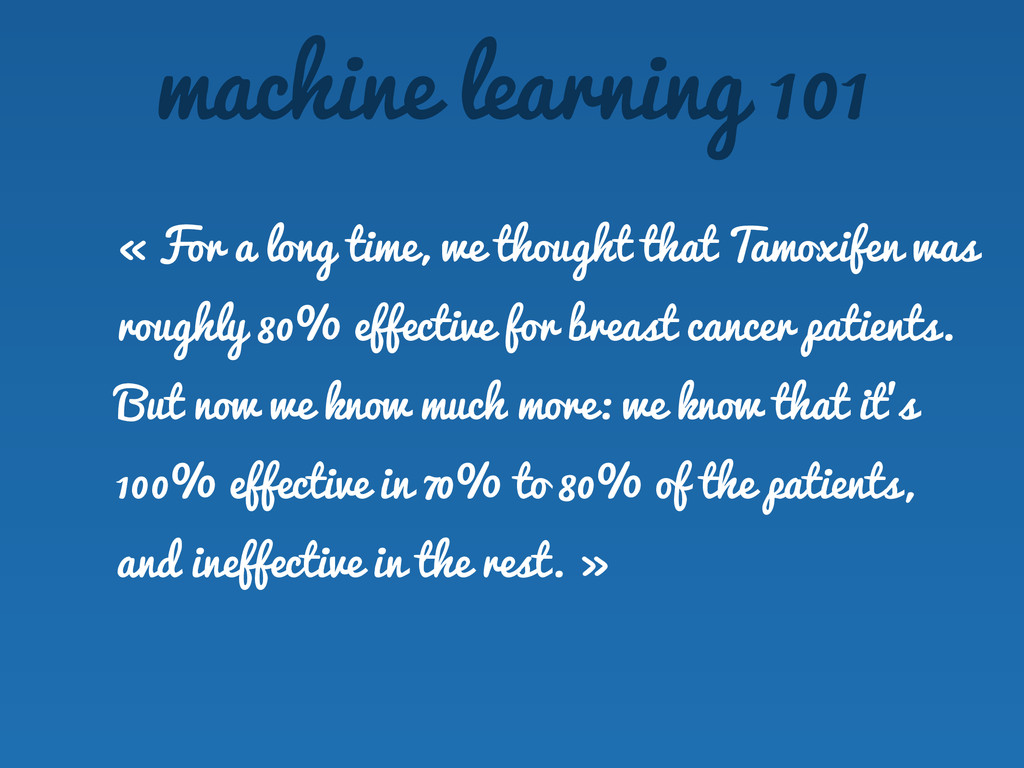
« For a long time, we thought that Tamoxifen was
roughly 80% effective for breast cancer patients. But now we know much more: we know that it’s 100% effective in 70% to 80% of the patients, and ineffective in the rest. » ! machine learning 101
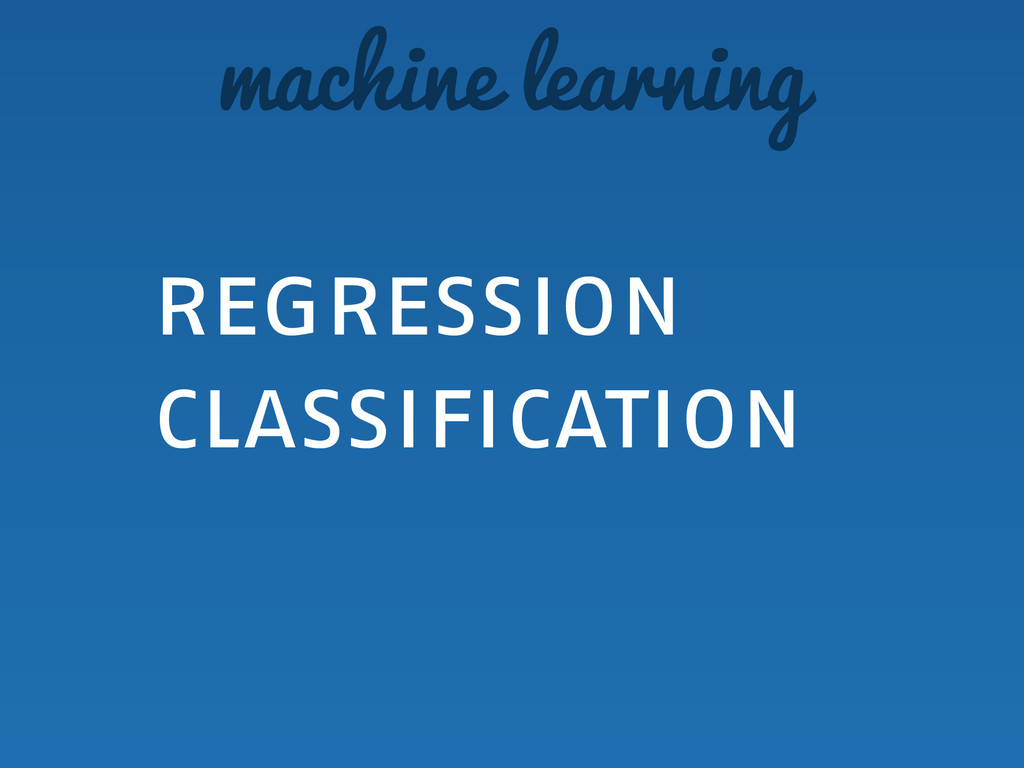
machine learning regression classification !
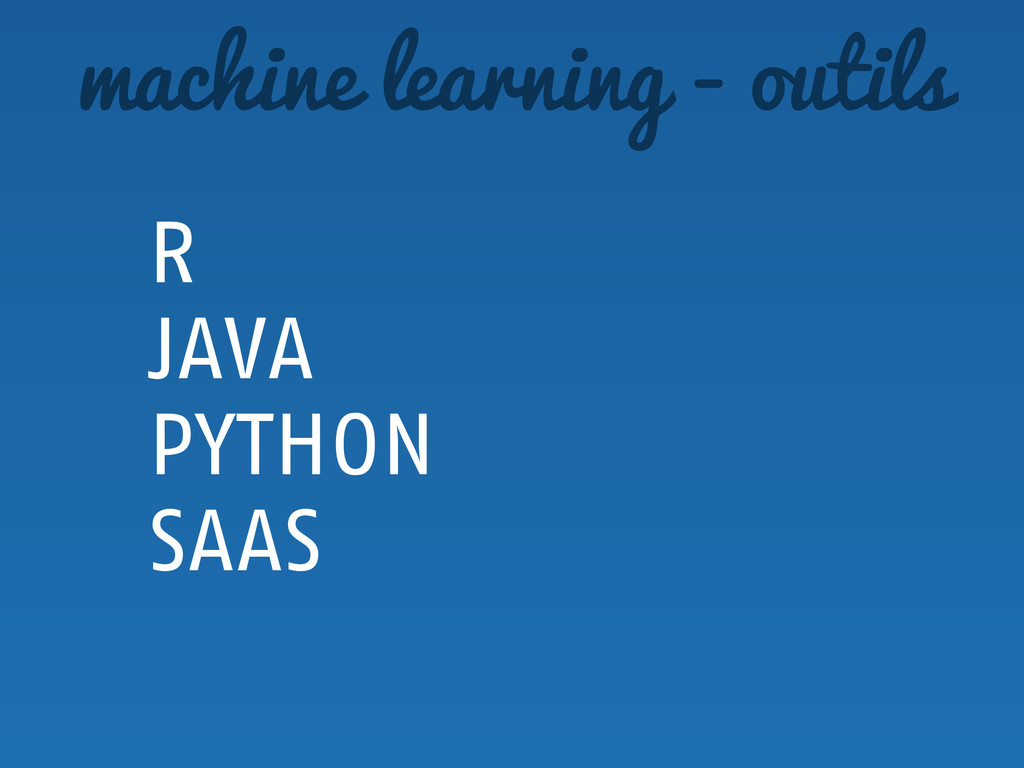
machine learning - outils R JAVA PYTHON SAAS ! !
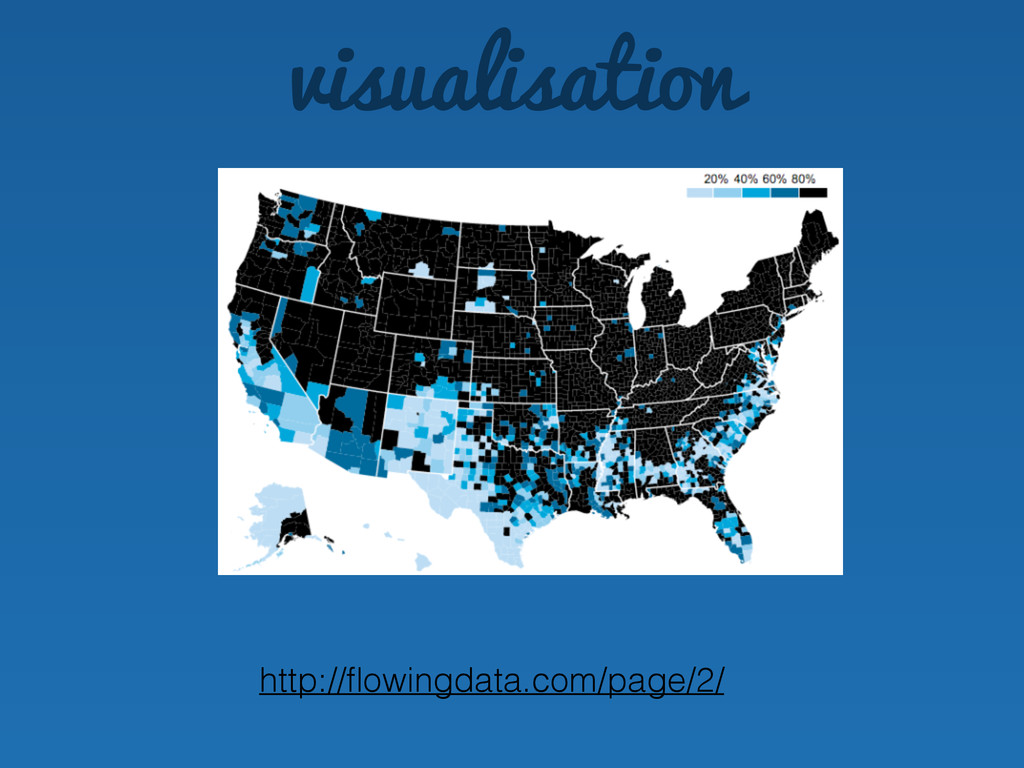
visualisation http://flowingdata.com/page/2/
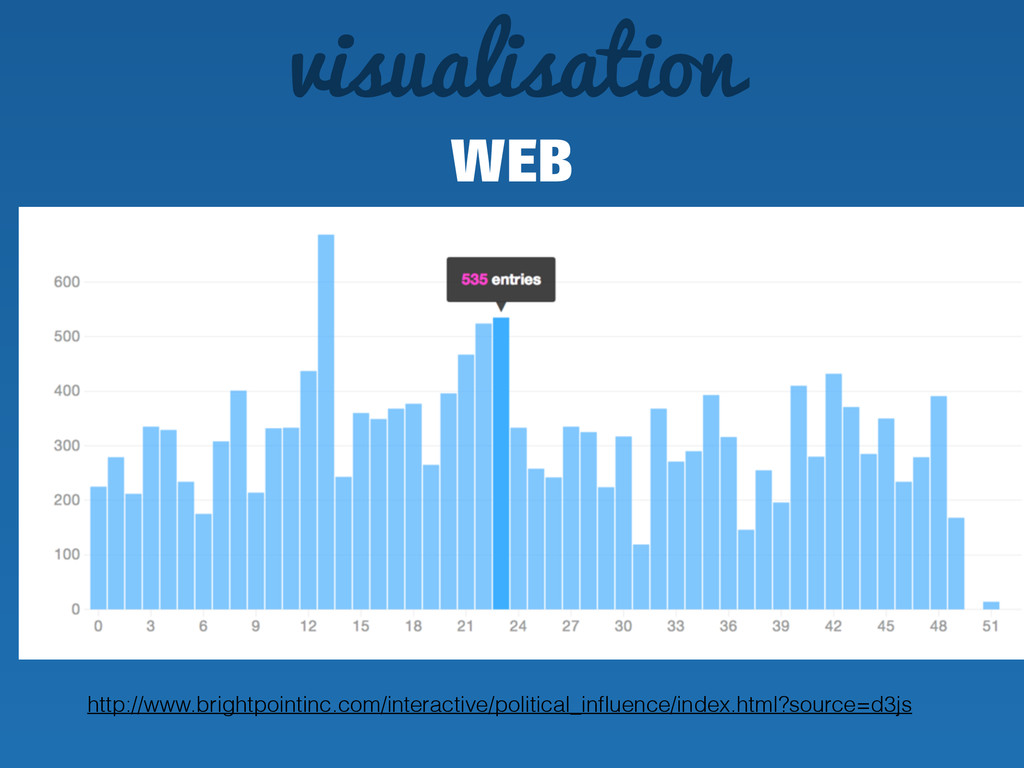
http://www.brightpointinc.com/interactive/political_influence/index.html?source=d3js WEB visualisation
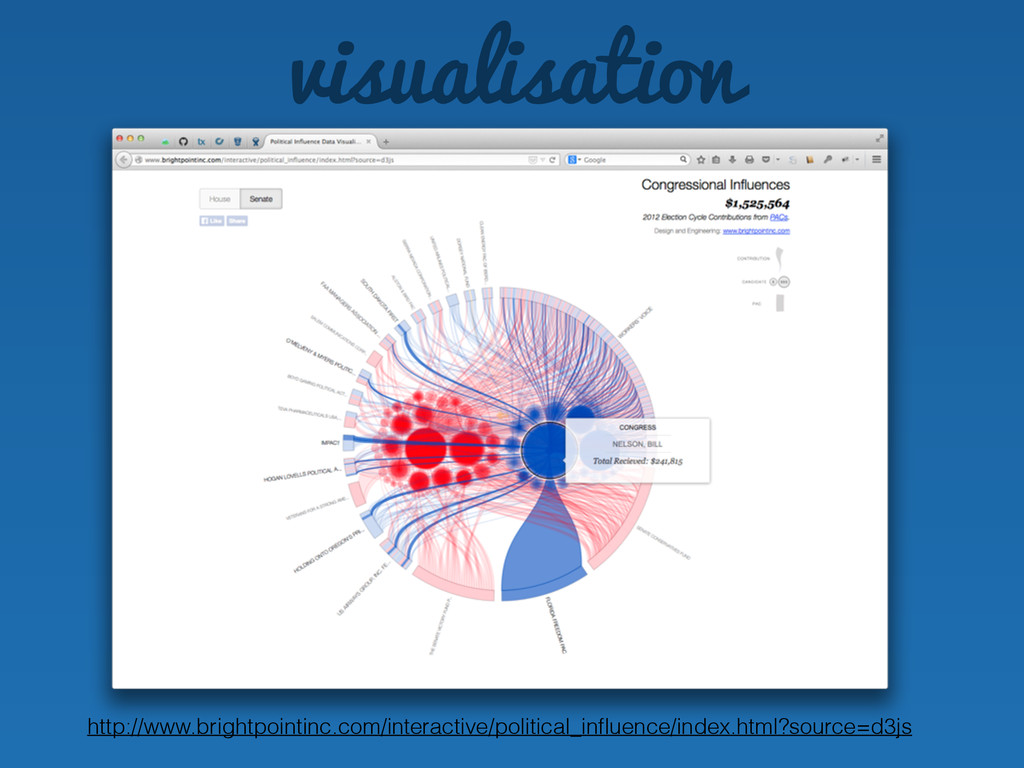
http://www.brightpointinc.com/interactive/political_influence/index.html?source=d3js visualisation
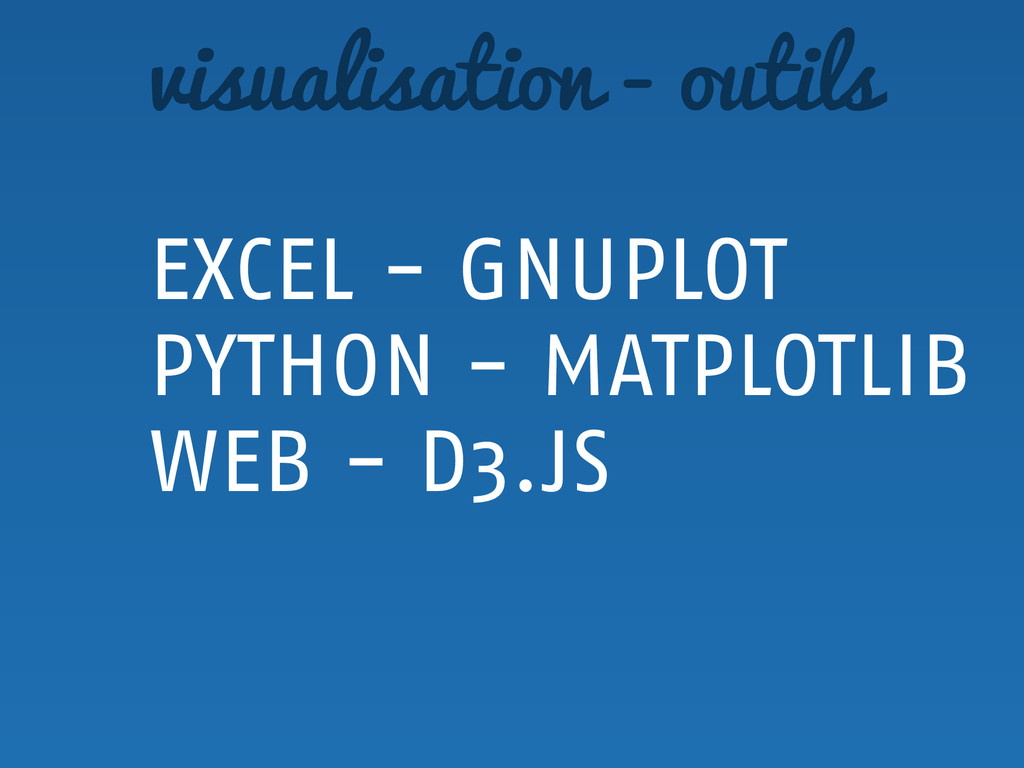
EXCEL - GNUPLOT PYTHON - MATPLOTLIB WEB - D3.JS !
! visualisation - outils
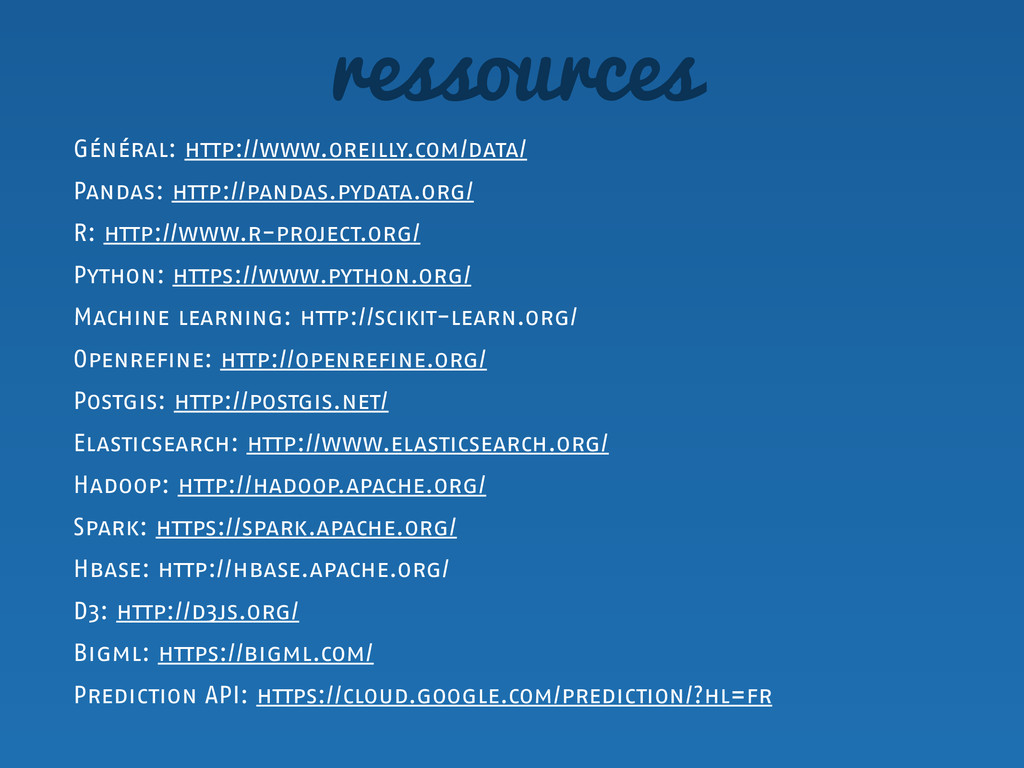
Général: http://www.oreilly.com/data/ Pandas: http://pandas.pydata.org/ R: http://www.r-project.org/ Python: https://www.python.org/ Machine learning:
http://scikit-learn.org/ Openrefine: http://openrefine.org/ Postgis: http://postgis.net/ Elasticsearch: http://www.elasticsearch.org/ Hadoop: http://hadoop.apache.org/ Spark: https://spark.apache.org/ Hbase: http://hbase.apache.org/ D3: http://d3js.org/ Bigml: https://bigml.com/ Prediction API: https://cloud.google.com/prediction/?hl=fr ressources
merci Laurent Paoletti @providenz TVT - 29 septembre 2014