Upgrade to Pro — share decks privately, control downloads, hide ads and more …

Manual 01: How to Design a Survey Software?

Punit Patpatia
February 20, 2019

Manual 01: How to Design a Survey Software?

Designing a Survey Software is a bit complicated as it involves a lot of logic and individual responses from a varied set of population. Apparently, people-powered data for business. It includes a vast framework, both in terms of GUI and back-end database. I had worked through various survey mechanisms to understand the insights. The manual, herein, designed by me is a detail of how the Survey GUI works closely with these logics, also how the database schema can be designed and inter-linked.

The Design includes:

1. Minified Survey Flow
2. Survey Plans based on the mix of functionality
3. GUI and backend Framework
4. Masters and Database Scheme
5. Data Structure, Calculations, and Visualization

Punit Patpatia

February 20, 2019
Tweet

More Decks by Punit Patpatia

Other Decks in Research

Transcript

  1. How to Design a How to Design a Survey Softw

    are? Survey Softw are? A Manual created by Punit Patpatia for uNextt Technologies Pvt. Ltd.
  2. Name of University/Institute/College/School/Organization Logo Survey Title Survey Sub-title / Description

    Customized Common Fields: For example, Department, Course, Academic Year, Survey Date etc. Page 1 Page 2 Page 3 etc. [For Page Logic] Question Types [including featured types] Standard and Featured Theme All Featured Logics Standard and Featured Options Featured Function for Quota & Custom Variables Charts/Graphs and Reports [including featured Charts/Graph and Reports] Sign-up/Sign In Pro Feature MINIFIED SURVEY FLOW MINIFIED SURVEY FLOW Questions (+) Themes (+) Logic (+) Options (+) Handlers (+) Collect Responses Slide/Page #2 of 141
  3. Slide/Page #3 of 141 Page Standard Professional New Page Page

    Break Intro Page Questions (+) Drop Down Star Rating Multiple Choice Matrix / Rating Scale Ranking Single Text Box Comment Box Contact Information SURVEY PLANS SURVEY PLANS Advance Text Editor [including Tex Math]
  4. Slide/Page #4 of 141 Questions (+) Standard Professional Advance Matrix

    / Rating Scale Matrix of Drop Down Menus Text Slider Multiple Text Box Image Text A/B Test Image A/B Test Themes (+) Themes for Teams Pre Defined Themes 15 100 Customized Themes Date / Time SURVEY PLANS SURVEY PLANS
  5. Slide/Page #5 of 141 Logics (+) Standard Professional Question &

    Answer Piping Page Randomization Question & Page Skip Logic Options (+) Survey Title Question Number Required Asterisks Page Title Page Number Progress Bar Custom Footer Multi Language Support Exit Link SURVEY PLANS SURVEY PLANS Logo
  6. Slide/Page #6 of 141 Handlers (+) Standard Professional Custom Variables

    Quota Charts/Graphs (+) Bar Chart [Horizontal / Vertical] Stacked Bar Chart Pie Chart Stacked 100% Area Chart Line Chart Stacked 100% Bar Chart Stacked Area Chart Waterfall Chart Tree Map Scatter Plot Bubble Size SURVEY PLANS SURVEY PLANS
  7. Slide/Page #7 of 141 Reports (+) Comparison Analysis Coefficient of

    Variation Trend Analysis Proportion of Scores Deviation from Mean Pareto Analysis Complete Data Export Standard Professional Pro Features (+) Team Collaboration & Add Users (Team size limited to 25 users) Team size can be extended on additional cost Synopsis Question Bank Social Share Net Promoter Scores SURVEY PLANS SURVEY PLANS Remember: A Standard User will only have the limit to create 5 surveys
  8. Slide/Page #8 of 141 SURVEY FRAMEWORK SURVEY FRAMEWORK Name of

    University/Institute/College/School/Organization Post Sign In / Sign Up Single Line Text Box Upload Logo Browse Logo Logo Image Image Next >> For Pro Users Analyze Results Collect Responses Design Survey Summary For any type of inputs, an advance editor will be used with options to modify text. These options will be, bold, italics, underline, strike through, subscript, superscript, font, font size, text colour, table, insert link/hyperlink, insert image, insert audio/video, alignments (left, center, right, justify), bullets, numbering, undo, redo, clear formatting, Tex maths (to add mathematics functions). Important Please refer to Slide #84
  9. Slide/Page #9 of 141 SURVEY FRAMEWORK SURVEY FRAMEWORK Survey Title

    Single Line Text Box Survey Sub-Title Single Line Text Box Description Multiple Line Text Box This is Optional This is Optional Next >> << Back Analyze Results Collect Responses Design Survey Summary Add Common Fields This is Optional Customize Field Name Single Line Text Box Field Type Select Field Type Add a new field 1 2
  10. Slide/Page #10 of 141 SURVEY FRAMEWORK SURVEY FRAMEWORK Add Common

    Fields This is Optional Customize Field Type Select Field Type 1 2 To add some fields which are common for each data row, choose Add Common Fields. For example, in a survey conducted by University for their teachers, the common fields can be the department, program, academic year etc. to survey a particular set of people. Same as, in manufacturing company the capacity, size, installation to survey a particular set of product line. While adding a common field, it will be required to define a field type for system to identify the data type. For example, a department can be a text, whereas an academic year can be a date or numeric and capacity/size can be numeric. The common field types in use are: Text, Date, From Date – To Date, Month, From Month – To Month, Year, From Year – To Year, Integer, Float, Boolean Y/N, Boolean T/F. While a Field Name could be any name given to a field; however please remember the following before selecting a Field Name 1) A Field Name should be case sensitive and will always contain lower-case letters 2) A Field Name can contain letters and numerics; however will not start with a numeric value 3) A Field Name cannot contain a space or spaces 4) A Field Name cannot contain special characters other than an underscore (i.e., _ ).
  11. Slide/Page #11 of 141 1 SURVEY FRAMEWORK SURVEY FRAMEWORK Analyze

    Results Collect Responses Design Survey Summary BUILDER Multiple Choice Drop Down Star Rating Matrix / Rating Scale Ranking THEMES LOGICS OPTIONS HANDLERS PRO FEATURES Preview & Test Page 1 SURVEY TITLE SURVEY SUB-TITLE DESCRIPTION + Add Page Title and Description Page Actions Simply drag and drop the type of question from Builder that you want to add - or - Click the below button to add a question by selecting its type Add a new question Submit Finished adding questions Powered By uNext Technologies © 2014 U18 All rights reserved Hide Footer Pro Feature 2 3 4 5 6  + New Page PAGE / SURVEY TITLE
  12. Slide/Page #12 of 141 1 + Add Page Title and

    Description SURVEY FRAMEWORK SURVEY FRAMEWORK Adding a page title provides a page alias, for easy remembrance. This also helps in defining page logics, as it will be easier to define a logic to a specific page title than a generic page. One may also add some description while defining a page title for their self reference. Analyze Results Collect Responses Design Survey Summary Page 1 + Add Page Title and Description Page Title Single Line Text Box This is Optional Page Description Multiple Line Text Box This is Optional Cancel Save Page Actions 2 Page Actions will help in defining actions on a specific page, the page actions normally incorporate action like, copy page, edit page, required questions. With a click on Page Actions a drop-down menu will help in defining these actions. / SURVEY TITLE
  13. Slide/Page #13 of 141 Use this option, to copy a

    page and paste it at a specific location (aka, duplicate page). One may either paste a a page at first/last position, before current page, after current page or before/after a specific page title/number. SURVEY FRAMEWORK SURVEY FRAMEWORK Analyze Results Collect Responses Design Survey Summary Page 1 + Add Page Title and Description Page Actions Copy Page Edit Page Required Questions Delete Page Paste Page Select Cancel Save Page copied! Where would you like to paste it? Make it first page Make it last page Paste before current page Paste after current page Paste at specific location While all the other options are self explanatory, Paste at specific location will ask to select a page title/ number before/after one would like to paste the page. / SURVEY TITLE
  14. Slide/Page #14 of 141 SURVEY FRAMEWORK SURVEY FRAMEWORK Before /

    After Select Before After Select Page General Questionnaire Customer Satisfaction Page 3 Page 4 This option will be used to edit the current page. This option will be used to mark all the questions on current page as required. This may further handle the error message that appears, if any question is left unanswered. Error Message Single Line Text Box Cancel Save Would you like to define a error message? This option will be used to delete the current page.
  15. Slide/Page #15 of 141 Preview & Test 3 SURVEY FRAMEWORK

    SURVEY FRAMEWORK Preview & Test will show the design of survey as it appears to the customers. This will be a testing interface and no responses will be captured. The featured menu, will help in defining features of a survey. The feature menu contains both standard and professional features, which will be linked to the account settings. The professional features will only be active for those accounts, who paid for it. The featured menu will contain various features to build a survey questionnaire with added logics, handlers and design. Lets understand these feature one-by-one. BUILDER Builder will help the designers to choose the type of questions they would like to incorporate in their survey. A builder contains various standard and professional question types. Below are the types of questions to be incorporated in Builder, along with their explanation, examples and categorization. PS: Several options can be added with each question, such as, required question, change layout (i.e., placement, spacing and size), randomize and sort questions (to reduce order bias) etc. Let's now understand the various types of questions and how they can be categorized.
  16. Slide/Page #16 of 141 SURVEY FRAMEWORK SURVEY FRAMEWORK QUESTION TYPES

    Multiple Choice To choose one or multiple answers from the list of answer choices. This question type will mandatory contain two options, but will keep them optional; 1) Allow more than one answer (specifically for multiple choices) 2) Require an answer (specifically, when survey cannot move forward without answering the question). This question type will provide the count of options and will be associates with graphs representing bars, lines, stack etc. Hence, this question type will be defined under count and rate category. Specifically for multiple choices Specifically, when survey cannot move forward without answering the question Display answers randomly 1 2 3 Dragging & sizing features (WYSIWYG)
  17. Slide/Page #17 of 141 SURVEY FRAMEWORK SURVEY FRAMEWORK Comment Field

    Label Please specify a label Size Single line of text Single line of text Multiple lines of text | Characters Validation Don't validate this answer Don't validate this answer Make sure it's a specific length Make sure it's a whole number Make sure it's a decimal number Make sure it's a date (MM/DD/YYYY) Make sure it's a date (DD/MM/YYYY) Make sure it's an email address Add a comment field [This will be common for all question types wherever the comment field will be added] 1
  18. Slide/Page #18 of 141 SURVEY FRAMEWORK SURVEY FRAMEWORK Comment Field

    Label Please specify a label Size Single line of text Single line of text Multiple lines of text | Characters Validation Don't validate this answer Don't validate this answer Make sure it's a specific length Make sure it's a whole number Make sure it's a decimal number Make sure it's a date (MM/DD/YYYY) Make sure it's a date (DD/MM/YYYY) Make sure it's an email address
  19. Slide/Page #20 of 141 SURVEY FRAMEWORK SURVEY FRAMEWORK Q1: Who

    amongst the below is your favourite teacher? O N K Singh O R Sharma O P Sinha Q1: Who amongst the below is your favourite teacher? O N K Singh O R Sharma O P Sinha Change the layout to display answer choice (i.e., horizontal or vertical) / Output 2 Horizontal Layout Vertical Layout Enable question text A/B test 3 □ Enable question text A/B test  Start your A/B test by adding your question text variations. Edit question text A/B test → This option is used to check question variance on same options. This feature allows you to assign a percentage to each question. Questions percentages must total 100%.
  20. Slide/Page #21 of 141 SURVEY FRAMEWORK SURVEY FRAMEWORK Enter your

    question Q1: Multiple choice A/B test Answer Choices Ο O O Enter an answer choice Enter an answer choice Enter an answer choice Enter your question A B 50 50 % % □ Options Allow more than one answer to this question □ Add a comment Field □ Require an answer to this question □ Change the layout to display answer choices (i.e., horizontal or vertical) □ Randomize answer choices (to remove answer bias) □ Adjust question layout (i.e., placement, spacing and size of the question) Question text A/B test
  21. Slide/Page #22 of 141 SURVEY FRAMEWORK SURVEY FRAMEWORK Dropdown To

    choose one out of multiple answer choices. This question type will mandatory contain one option, but will keep it optional; 1) Require an answer (specifically, when survey cannot move forward without answering the question). This question type will provide the count of options and will be associates with graphs representing bars, lines, stack etc. Hence, this question type will be defined under count and rate category. Specifically, when survey cannot move forward without answering the question Display answers randomly Dragging & sizing features (WYSIWYG) Please refer to Slide #17, #18 and #19 Please refer to Slide #20 and #21
  22. Slide/Page #23 of 141 SURVEY FRAMEWORK SURVEY FRAMEWORK Star Rating

    To scale the question on defined icons. This question may contain various icon styles, such as star, heart, thumbs, smileys etc. Each icon will contain a count of one, hence if user selects three icons that will be equal to the count of three. This question must contain the number of symbols (i.e., minimum two and maximum ten) to be used for rating along with the shape that user wants to choose. This question type will mandatory contain one option, but will keep it optional; 1) Require an answer (specifically, when survey cannot move forward without answering the question). This question type will provide the count of options and will be associates with graphs representing bars, lines, stack etc. Hence, this question type will be defined under count and rate category. Output Q1: Whom would you select as your favourite teacher? --- Please Choose --- --- Please Choose --- N K Singh R Sharma P Sinha
  23. Slide/Page #24 of 141 SURVEY FRAMEWORK SURVEY FRAMEWORK 1 Specifically,

    when survey cannot move forward without answering the question Dragging & sizing features (WYSIWYG) Please refer to Slide #17, #18 and #19 Please refer to Slide #20 and #21 Output Q1: How many Stars would you give to Quality of Service provided by University?
  24. Slide/Page #25 of 141 SURVEY FRAMEWORK SURVEY FRAMEWORK Add ranking

    label 1 Add ranking label | 1 Star 2 Star 3 Star 4 Star 5 Star | | | | 1 2 3 4 5 Weight Matrix / Rating Scale To apply the same measurement when answering several related questions. A matrix can be set to collect multiple answers or only one answer per row. The matrix questions can be switched into a rating scale in order to assign weights to the answers. This question type will mandatory contain three options, but will keep them optional; 1) Use weights (the per choice weight will be made custom, of no custom weight is given the sequential weight will start from 1 and will continue till last choice) 2) Forced ranking (i.e., one response per column) (specifically, when survey cannot move forward without selecting a choice per column) 3) Require an answer (specifically, when survey cannot move forward without answering the question). This question type will provide the count/weight of options and will be associates with graphs representing bars, lines, stack etc. Hence, this question type will be defined under count and rate category.
  25. Slide/Page #26 of 141 SURVEY FRAMEWORK SURVEY FRAMEWORK 1 2

    Specifically, when survey cannot move forward without answering the question Dragging & sizing features (WYSIWYG) Please refer to Slide #17, #18 and #19 Please refer to Slide #20 and #21 †† Display answers randomly †† “Enable question text A/B test” will only work with “Single row rating scale” Please also refer to for this. 1
  26. Slide/Page #27 of 141 SURVEY FRAMEWORK SURVEY FRAMEWORK Make this

    a single row rating scale (remove row choices) 1 Allow multiple responses per row (uses checkboxes) 2
  27. Slide/Page #28 of 141 SURVEY FRAMEWORK SURVEY FRAMEWORK Outputs Q1:

    How would you rate the knowledge level of teacher? N K Singh R Sharma P Sinha Poor-(1) Average-(2) Good-(3) Excellent-(4) O O O O O O O O O O O O Q1: How would you rate the infrastructure of University? Poor-(1) Average-(2) Good-(3) Excellent-(4) O O O O Q1: Who amongst the below teachers have the following skill set? Strong concept knowledge Regular follow-up on progress Presence in class N K Singh R Sharma P Sinha □ □ □ □ □ □ □ □ □
  28. Slide/Page #29 of 141 Ranking To rank the list of

    options in desired ranking scale. This question type will mandatory contain one option, but will keep it optional; 1) Require an answer (specifically, when survey cannot move forward without answering the question). This question type will provide the count of options and will be associates with graphs representing bars, lines, stack etc. Hence, this question type will be defined under count and rate category. This question will also keep a check on user's choice to ensure no duplicate ranking. SURVEY FRAMEWORK SURVEY FRAMEWORK Specifically, when survey cannot move forward without answering the question Dragging & sizing features (WYSIWYG) Please refer to Slide #20 and #21 Display answers randomly
  29. Slide/Page #30 of 141 SURVEY FRAMEWORK SURVEY FRAMEWORK Output Q1:

    How would you rate the knowledge level of following teachers? N K Singh R Sharma P Sinha 3 1 2 1 2 3 No two ranks will be similar, i.e., the user cannot select same rank for different ranking choices. Note: Single Text Box To add a single text-box for respondents to write in a short text or numerical answer to the question. The answers can be assigned a specific answer length, and require and validate a number value, date format, or email address. This question type will mandatory contain two options, but will keep them optional; 1) Validation (specifically, to set a validation for text, numeric, date, e-mail address etc.) 3) Require an answer (specifically, when survey cannot move forward without answering the question). This question type can input various values and will be associates with various graphs. Hence, this question type will be defined under all the categories.
  30. Slide/Page #31 of 141 SURVEY FRAMEWORK SURVEY FRAMEWORK Specifically, when

    survey cannot move forward without answering the question Please refer to Slide #19 for validation Dragging & sizing features (WYSIWYG) Please refer to Slide #20 and #21 Output Q1: What would be your dream industry to work with? | Comment Box To collect an open ended written feedback. This question type will mandatory contain one option, but will keep it optional; 1) Require an answer (specifically, when survey cannot move forward without answering the question). This question type will not contain any calculation matric, hence will not be placed under any calculative category; however will be put under general category. Specifically, when survey cannot move forward without answering the question Dragging & sizing features (WYSIWYG) Please refer to Slide #20 and #21
  31. Slide/Page #32 of 141 SURVEY FRAMEWORK SURVEY FRAMEWORK Output Q1:

    Please spread some words about University? | Contact Information To collect the relevant contact information, including name, company, address, email, and phone number. It's more like a contact form. This question type will mandatory contain one option, but will keep it optional; 1) Require an answer (specifically, when survey cannot move forward without answering the question). This question type will not contain any calculation matric, hence will not be placed under any calculative category; however will be put under general category.
  32. Slide/Page #33 of 141 SURVEY FRAMEWORK SURVEY FRAMEWORK Specifically, when

    survey cannot move forward without answering the question Dragging & sizing features (WYSIWYG) The validations are already set on Email and Phone to capture the relevant data. Note:
  33. Slide/Page #34 of 141 SURVEY FRAMEWORK SURVEY FRAMEWORK Output Q1:

    Please share the following details (your information will be kept private): | Complete Name Email Address Phone Number | | Date / Time To collect specific date/time. This question type will mandatory contain one option, but will keep it optional; 1) Require an answer (specifically, when survey cannot move forward without answering the question). This question type will provide the trend of options and will be associates with graphs representing bars, lines etc. Hence, this question type will be defined under count and trend category.
  34. Slide/Page #35 of 141 SURVEY FRAMEWORK SURVEY FRAMEWORK Specifically, when

    survey cannot move forward without answering the question Dragging & sizing features (WYSIWYG) Please refer to Slide #20 and #21 Output Q1: What Date & Time would you prefer for the event? MM Date Time DD / YYYY / HH MM : AM AM PM
  35. Slide/Page #36 of 141 Text This is not a question

    type, but the part of builder, to input text anywhere on the survey page. Image This is not a question type, but the part to builder, to Insert an image by uploading a file or specifying the URL of an image on the web. This option will contain an alternate name of image for internal use. SURVEY FRAMEWORK SURVEY FRAMEWORK Dragging & sizing features (WYSIWYG) Output Organization Name Organization tag line goes here
  36. Slide/Page #37 of 141 SURVEY FRAMEWORK SURVEY FRAMEWORK Dragging &

    sizing features (WYSIWYG) Output Organization Name Organization tag line goes here
  37. Slide/Page #38 of 141 Advance Matrix / Rating Scale This

    question type is just like Matrix / Rating Scale; with a difference to place two columns for advance calculation(s). To apply the same measurement when answering several related questions over two column categories. An advance matrix can be set to collect multiple answers or only one answer per row. The advance matrix questions can be switched into a rating scale in order to assign weights to the answers. This question type will mandatory contain three options, but will keep them optional; 1) Use weights (the per choice weight will be made custom, of no custom weight is given the sequential weight will start from 1 and will continue till last choice) 2) Forced ranking (i.e., one response per column) (specifically, when survey cannot move forward without selecting a choice per column) 3) Require an answer (specifically, when survey cannot move forward without answering the question). This question type will provide the count/weight of options and will be associates with graphs representing bars, lines, stack etc. Hence, this question type will be defined under count and rate category. SURVEY FRAMEWORK SURVEY FRAMEWORK
  38. Slide/Page #39 of 141 SURVEY FRAMEWORK SURVEY FRAMEWORK Specifically, when

    survey cannot move forward without answering the question Dragging & sizing features (WYSIWYG)
  39. Slide/Page #40 of 141 SURVEY FRAMEWORK SURVEY FRAMEWORK Outputs Q1:

    Categorize the use of following: Magazine Television Internet Home Work Others □ □ □ □ □ □ □ □ □ Morning Afternoon Evening □ □ □ □ □ □ □ □ □ Location of use Time of use Q1: Rate the following amongst teachers. Concept knowledge Follow-up on progress Presence in class Poor-(1) Average-(2) Good-(3) Excellent-(4) O O O O O O O O O O O O Poor-(1) Average-(2) Good-(3) Excellent-(4) O O O O O O O O O O O O N K Singh R Sharma
  40. Slide/Page #41 of 141 Drop Down Matrix To apply the

    same measurement when answering several related questions. A matrix can be set to collect one answer per row in the form of a scaled drop down. The matrix questions can be switched into a rating scale in order to assign weights to the answers. This question type will mandatory contain three options, but will keep them optional; 1) Use weights (the per choice weight will be made custom, of no custom weight is given the sequential weight will start from 1 and will continue till last choice) 2) Forced ranking (i.e., one response per column) (specifically, when survey cannot move forward without selecting a choice per column) 3) Require an answer (specifically, when survey cannot move forward without answering the question). This question type will provide the count/weight of options and will be associates with graphs representing bars, lines, stack etc. Hence, this question type will be defined under count and rate category. SURVEY FRAMEWORK SURVEY FRAMEWORK
  41. Slide/Page #42 of 141 SURVEY FRAMEWORK SURVEY FRAMEWORK Specifically, when

    survey cannot move forward without answering the question Dragging & sizing features (WYSIWYG) Please refer to Slide #17, #18 and #19 Display answers randomly
  42. Slide/Page #43 of 141 SURVEY FRAMEWORK SURVEY FRAMEWORK Outputs Q1:

    How would you rate the knowledge level of teacher on following skill set? Concept knowledge Follow-up on progress Presence in class N K Singh R Sharma P Sinha Average Good Excellent Good Poor Average Excellent Poor Good Poor Average Good Excellent Q1: How would you rate the knowledge level of teacher on following skill set? Concept knowledge Follow-up on progress Presence in class N K Singh R Sharma P Sinha Average (1) Good (2) Excellent (3) Poor (0) Average (1) Poor (0) Good (2) Poor (0) Average (1) Good (2) Excellent (3)
  43. Slide/Page #44 of 141 Sliders To scale the question on

    defined slider. This question must contain the number scale (i.e., minimum one and maximum ten) to be used for rating. This question type will mandatory contain one option, but will keep it optional; 1) Require an answer (specifically, when survey cannot move forward without answering the question). This question type will provide the scale of answer from a defined range and will be associates with graphs representing bars, lines, stack etc. Hence, this question type will be defined under count and rate category. SURVEY FRAMEWORK SURVEY FRAMEWORK 1 Specifically, when survey cannot move forward without answering the question Dragging & sizing features (WYSIWYG) Please refer to Slide #20 and #21
  44. Slide/Page #45 of 141 SURVEY FRAMEWORK SURVEY FRAMEWORK Adjust slider

    scale 1 □ Adjust slider scale  Scale Range 0 10 to Steps 2 Start Position Left Left Center Right Define steps to jump between range. For example, if steps is 2, the slider will jump 5 times from the range of 0 to 10. i.e., at positions 2, 4, 6, 8, 10 Important: The value of steps must not be greater than maximum range of scale or less than minimum range of scale and must be evenly divisible Output Q1: How would you rate the Quality of Service provided by University between a scale of 0 to 10? 0 10
  45. Slide/Page #46 of 141 Multiple Text Box To add multiple

    text-boxes for respondents to write in a short text or numerical answer to the question. The answers can be assigned a specific answer length, and require and validate a number value, date format, or email address. This question type will mandatory contain two options, but will keep them optional; 1) Validation (specifically, to set a validation for text, numeric, date, e-mail address etc.) 3) Require an answer (specifically, when survey cannot move forward without answering the question). This question type can input various values and will be associates with various graphs. Hence, this question type will be defined under all the categories. SURVEY FRAMEWORK SURVEY FRAMEWORK 1 Specifically, when survey cannot move forward without answering the question Dragging & sizing features (WYSIWYG) Please refer to Slide #19 Please refer to Slide #20 and #21
  46. Slide/Page #47 of 141 SURVEY FRAMEWORK SURVEY FRAMEWORK Only allow

    numerical data 1 □ Only allow numerical data  When the answer is not a number, display this error message. Please enter a positive number □ Require a fixed sum / percentage  Sum of all answers = | When the answers do not add up correctly, display the following error. The choices need to add up to [enter sum/percentage here] Output Q1: What is you net income per month? 60000 Q2: How much percentage of your net income do you spend on the following? | Shopping Investment Saving | | 100 + + = % OR | %
  47. Slide/Page #48 of 141 Text A/B Test and Image A/B

    Test To learn the reaction on two or more different text passages/images. This question type will mandatory contain one option, but will keep it optional; 1) Require an answer (specifically, when survey cannot move forward without answering the question). This question type will provide the percentage of reaction captured over choices and will be associates with graphs representing bars, lines, stack etc. Hence, this question type will be primarily defined under rate category; however, it may also be defined under count category. SURVEY FRAMEWORK SURVEY FRAMEWORK Specifically, when survey cannot move forward without answering the question Dragging & sizing features (WYSIWYG)
  48. Slide/Page #49 of 141 SURVEY FRAMEWORK SURVEY FRAMEWORK Specifically, when

    survey cannot move forward without answering the question Dragging & sizing features (WYSIWYG)
  49. Slide/Page #50 of 141 SURVEY FRAMEWORK SURVEY FRAMEWORK How the

    text/image A/B test works? 100% Samples Divisibility defined while creating survey questions
  50. Slide/Page #51 of 141 SURVEY FRAMEWORK SURVEY FRAMEWORK Output Text/Image

    A/B Test Would you like to attend the school this summer? Out of 100 % Samples If the divisibility is 50% for two questions 50% will see this and 50% will see this How about schooling this summer for some vocational studies? What if we treat you with a Vanilla Chocolate Berry every Friday? What if we treat you with a Butter Scotch every Friday?
  51. Slide/Page #52 of 141 SURVEY FRAMEWORK SURVEY FRAMEWORK THEMES CUSTOM

    TEAM SIMPLE create a new theme based on their own settings. The settings available for professional users will be to change the effects of background, title, sub-title, options etc. Below is the list of items that can be changed by professional users. Name To change the name of a pre-defined theme or to define a name to some new theme Colors To set/define colors to survey elements. These elements are: • Survey Title • Survey Title Background • Survey Logo Background • Survey Background • Page Title • Page Title Background • Page Description Themes Different set of themes can be made available for both standard users and professional users. A limited set of themes can be made available for standard users with no customization; however the complete customized themes can be made available for professional users. Moreover the functionality to set-up different themes for teams can be made available. For example, setting up a different theme for department A, department B can be made available under team settings. The professional users will be able to customize theme under the option CUSTOM; wherein they can make changes to pre-defined themes or can
  52. Slide/Page #53 of 141 SURVEY FRAMEWORK SURVEY FRAMEWORK • Question

    Text • Answer Text • Answer Text Highlight • Required Asterisk • Error Text • Progress Bar Indicator • Progress Bar Text • Progress Bar Border • Progress Bar Background The color box (please refer to the color options on slide #56) will contain the options to • Set color from defined color palette • Make custom color • Define color using RGB and CMYK inputs • Set gradients • Change background image, either from defined images or browse for an image Typography To change font style, font size and define effects like bold, italics, underline etc. The typography will contain the following elements: • Default Font • Survey Title • Page Title • Page Description • Progress Bar
  53. Slide/Page #54 of 141 SURVEY FRAMEWORK SURVEY FRAMEWORK • Question

    Text • Answer Text • Exit Link • Error Text Background Image To change the pre-defined background image or set a new background image. The background image will contain the following scaling: • Full Screen • Tiled While standard users will only see the option to apply theme, the professional users will see the options to apply, customize, edit and delete theme. STANDARD USERS PROFESSIONAL USERS Apply Theme Apply Theme Customize Theme Edit Theme Delete Theme New Theme PROFESSIONAL USERS V S
  54. Slide/Page #55 of 141 SURVEY FRAMEWORK SURVEY FRAMEWORK TEAM To

    designate a specific theme for team specific surveys. For example, theme A for department A and theme B for department B. This is most useful for organizations working with different set of clients/customers based on their departmental work. This will be a professional feature and will be linked with survey distribution.
  55. Slide/Page #57 of 141 SURVEY FRAMEWORK SURVEY FRAMEWORK PAGE Page

    Page contains the options to set an introduction page, a new page and/or set a page break. All these features are different to each other. Intro Page An Intro Page will contain a page title and a page description. If an intro page is created, it will be the first page to display. The intro page will always contain a button to move forward to the first page of survey. Intro Page New Page Page Break New Page A New Page will be created to split the survey into various pages. The placement of buttons on a new page depends upon the position of the page. If there is no intro page and the new page is the first page, it will only contain a button to move to next page, else if it's a last page of survey, it will contain two buttons (i.e., to move to the previous page and to exit the survey), else if it's a middle page, it will contain two buttons (i.e., to move to the previous page and to move to the next page). Note: We will talk more about exit survey button in the Exit Link.
  56. Slide/Page #59 of 141 SURVEY FRAMEWORK SURVEY FRAMEWORK Page Break

    A Page Break is splitting the page into two parts. The difference between a page break and a new page is the page title and page description. Every new page contains a page title and a page description; however a page break shares the page title and page description of its parent page. The page break will have a common behaviour of a middle page or a last page and will contain two buttons based on its position. If a page split through page break is a middle page, it will contain Previous and Next buttons, else if a page split through page break is a last page, it will contain Previous and Exit buttons. LOGICS Question & Page Skip Logic Question & Answer Piping Page Randomization Logics These are the set of logics that can be applied to perform a specific task based on various choices. The documentation below defines the usage and procedure of these logics. Question & Page Skip Logic This logic is defined to skip to a particular page on receiving specific answer of a question. This logic can only be applied to question(s) with one answer choice. In other words, the logic will not work for questions with multiple answers. Following is the list of questions on which this logic can be applied: Multiple Choice (only if the option to allow more than one answer is unchecked), Drop Down, Star Rating, Matrix / Rating Scale (only if it's a single row rating scale and multiple responses are not allowed), Ranking, Slider and Text / Image A/B Test. There are different ways to apply this logic depending on question choice. Next few pages define the figures as to how this logic can be applied on different questions.
  57. Slide/Page #65 of 141 SURVEY FRAMEWORK SURVEY FRAMEWORK Question &

    Answer Piping Question & Answer Piping works the similar way as Question & Page Skip Logic while the only difference is in the skip methodology. Question & Page Skip Logic uses the logic to skip to a particular page on receiving an answer choice, wherein Question & Answer Piping uses the logic to skip to a particular question of specific page on receiving an answer choice. Hence, every component of Question & Answer Piping will remain the same as of Question & Page Skip Logic, whereas the Skip to component will change its behaviour and will ask the user to select a Specific Page and Specific Question. Also, though the IF question type will be limited (i.e., selected questions as in Question & Page Skip Logic), but the Skip to question choice could be any question of a specific page. This will be the only difference from Question & Page Skip Logic
  58. Slide/Page #66 of 141 SURVEY FRAMEWORK SURVEY FRAMEWORK Page Randomization

    Page Randomization is just a script to randomize specific or all pages. This will help to avoid input bias. Once the pages are selected for randomization, the page order will continuously keep on changing. Note: This will have a direct impact on page numbers; hence, it will always be a good idea to inform the users about the same. Moreover, the page randomization will not work with page breaks. For example, if there are a total of four pages in a survey; wherein page numbers 1 & 3 are parent and page number 2 holds a page-break component converting it into two pages (i.e., 2.a → parent and 2.b → child), the page randomization will impact the order of page numbers 1, 2 & 3, but will not impact the order of page numbers 2.a and 2.b. Page randomization will be a simple switch, once the page randomization will be set to ON state, it will then ask for the set of pages to be randomize. Once the switch is ON, it will only show the pages on which the randomization can be possible.
  59. Slide/Page #67 of 141 SURVEY FRAMEWORK SURVEY FRAMEWORK Options Options

    are some additional switches that can be used to switch-on / switch-off various survey components. While most of these switches are for display functionality; Custom Footer and Exit Link will contain some further options for customization. Note: The options displayed will be based on user-account. For example, if user has not signed-in as a professional user, then pro-features will not be displayed (i.e., Logo, Custom Footer, Multi-Language Support and Exit Link). By default all these options are set to be displayed; however, the user will have all rights to hide these components by switching them off.
  60. Slide/Page #68 of 141 SURVEY FRAMEWORK SURVEY FRAMEWORK A pro-feature

    to change the default footer. A pro-feature to make a re-direct as soon as the exit survey button is pressed. Multi-Language Support A Multi-Language Support is a pro-feature which will enable the survey to be featured and filled in multiple languages. This pro-feature can be utilized to capture the global market. A multi-language support function may use google APIs to convert the survey in various languages. Moreover, once a multi- language support is switched on, it will capture the user IP and will ask the user permission to automatically convert the survey in the language captured through user IP. Based on user IP, it may display a dialogue window to get user permission.
  61. Slide/Page #69 of 141 SURVEY FRAMEWORK SURVEY FRAMEWORK HANDLERS Handlers

    Handlers are logical and are used to add additional logics on surveys. The Handlers provide custom controls in order to manage survey directions based on responses and user choices. The two important elements of Handlers are Quota and Custom Variables. Quota Custom Variables Quota Quota enables you to automatically close the survey once the survey reaches a certain ratio of qualified responses. In order to assign a quota, three elements are important; 1) qualifying question 2) qualifying answer and 3) total number of qualified responses required. Once the qualified responses are received, the Quota can be set to perform a choice based action. The actions to be performed once a Quota is achieved are pre-populated and are limited to three. 1) End the survey: To end the survey, with a default message 2) Display a custom message: To end the survey, with a custom message 3) Re-direct to your own website / web-link: To re-direct the survey to a defined URL/web-link/website. Note: ➔ The quota can be applied to a minimum of 1 question and a maximum of 3 questions ➔ When a quota is applied to a survey that has already collected some responses, the quota will not be applied to existing responses ➔ The quota can only be applied to the question(s) with one answer choice.
  62. Slide/Page #70 of 141 SURVEY FRAMEWORK SURVEY FRAMEWORK The Quota

    can only be applied to question(s) with one answer choice. In other words, the Quota will not work for questions with multiple answers. Following is the list of questions on which the Quota can be applied: Multiple Choice (only if the option to allow more than one answer is unchecked), Drop Down, Star Rating, Matrix / Rating Scale (only if it's a single row rating scale and multiple responses are not allowed), Ranking, Slider and Text / Image A/B Test. Pre-populated answers, already defined by user. Combination logic Quota / Total number of qualified responses (only positive integer value, greater than 0). Action to be implemented upon achieving the required quota.
  63. Slide/Page #71 of 141 SURVEY FRAMEWORK SURVEY FRAMEWORK HANDLERS Custom

    Variables Custom Variables is an advance logic that allows you to track data about respondents by passing one or more values through a survey link and into your survey results. Though there is no limit on the number of variable; however keep it below universal URL length, which is below 2000 characters to ensure it is adapted by web browsers. In order to avoid the clash in variable, some of the variables are restricted and the system Quota Custom Variables Once the default action is selected other than End the survey the survey system will perform further actions based on user choice. Below see the inputs required in order to perform these actions. will display an error as an when a clash is observed. Remember: While creating a custom variable, please remember the following: 1) Custom variables are case sensitive and will always contain lower-case letters 2) Custom variables can contain letters and numerics; however will not start with a numeric value 3) Custom variable cannot contain a space or spaces 4) Custom variables cannot contain special characters other than an underscore (i.e., _ ).
  64. Slide/Page #72 of 141 SURVEY FRAMEWORK SURVEY FRAMEWORK Using custom

    variables is a 4-steps process. 1) Define custom variables 2) Extract web-link 3) Replace the bracketed values with custom values that should be passed through URL 4) Send the link to respondents
  65. Slide/Page #73 of 141 SURVEY FRAMEWORK SURVEY FRAMEWORK For example,

    Let's say you want to send out a short employee survey to the members of your research department. Instead of asking each respondent to fill out there names, department and title in the survey itself, you want to track this information through the survey link using custom variables. Here's how would you do this: Step 1: Create custom variable, let's say: Variable Name: ename Label: Employee Name Variable Name: deptt Label: Department Variable Name: etitle Label: Title Step 2: Once the variables are defined, extract the web-link. The web-link template will look like: https://www.<survey-site-name>.com/s_ref/?ename=[ename_value]&deptt=[deptt_value]&etitle=[etitle_value] Here, survey-site-name is the name of the website on which the survey is hosted and s_ref is the survey title.
  66. Slide/Page #74 of 141 SURVEY FRAMEWORK SURVEY FRAMEWORK Step 3:

    Replace the bracketed values with custom values that should be passed through URL, for example, https://www.unext-survey.com/travel-survey/?ename=P%20%Sinha&deptt=Research&etitle=Analyst https://www.unext-survey.com/travel-survey/?ename=M%20%Das&deptt=Research&etitle=Analyst https://www.unext-survey.com/travel-survey/?ename=Govind%20%D&deptt=Research&etitle=Sr%20%Analyst https://www.unext-survey.com/travel-survey/?ename=R%20%Narang&deptt=Research&etitle=Sr%20%Analyst https://www.unext-survey.com/travel-survey/?ename=S%20%Shanthi&deptt=Research&etitle=Manager https://www.unext-survey.com/travel-survey/?ename=M%20%Michael&deptt=Research&etitle=Manager Remember: While replacing the custom values, always use %20% instead of spaces. This will help the browsers to read the URL properly, also this will avoid any vague outputs. Step 4: Send the link to respondents. Once the survey link is sent to respondents, it will capture the individual results from the questions asked in survey and will display the results once the responses will be collected. This will show as follows: ename deptt etitle what is your favourite travel destination in India? If given a choice how many day can you spend at your favourite destination? P Sinha Research Analyst Kerala Forever M Das Research Analyst Goa Forever Govind D Research Sr Analyst Nainital Not more than 2 months R Narang Research Sr Analyst Other Forever S Shanthi Research Manager Kerala Not more than 1 month M Michael Research Manager Other Not more than 2 months
  67. Slide/Page #75 of 141 SURVEY FRAMEWORK SURVEY FRAMEWORK Pro Features

    Pro Features are professional features only licensed to specific account with rights to access them. The professional features hold various components in order to enhance user experience, such as, question bank, teams, social share, NPS and APIs etc. We will take a close look on these features to understand how these will be designed for a better output. Question Bank Question Bank is the library of questions specifically or pre-designed for various organizations or organizational research. The question bank holds a variety of questions for these segments. The segments are Community, Customer Feedback, Customer Satisfaction, Demographics, Education, Events, Health Care, Human Resources, Industry Specific, Fun Questions, Market Research, Non-Profit, Political etc. There is no limit of questions in question bank and the question bank keeps adding as and when a new question is identified. The Question Bank is a separate object in OOP (Object Oriented Programming) and must be dealt with separately. The database structure of a question bank will hold various fields, these are: qid, qtype, preques, preansc1, preansc2, preansc3, …, preanscn, qcat, qtag, qbadge. We will discuss more about the database structure and schemas in Design. As and when the user will select a question to be added on the survey, the question will show the tags and badges for the users to remark the same. Remember: The category and badges are same. Badges are just the graphical representation of categories. Also, the categories/badges are required to categories the NPS questions separately. Also, Note if a question choice is NPS, the answer choice will not change, else there will be no relevance of NPS questions.
  68. Slide/Page #77 of 141 Net Promoter Score (NPS) While several

    questions can be placed under each categories and further more categories can be defined, we now need to understand as to what the Net Promoter Score is and how it is calculated? The Net Promoter Score is a management tool that can be used to gauge the loyalty of a firm's customer relationships. It serves as an alternative to traditional customer satisfaction research and claims to be correlated with revenue growth. NPS can be as low as −100 (everybody is a detractor) or as high as +100 (everybody is a promoter). An NPS that is positive (i.e., higher than zero) is felt to be good, and an NPS of +50 is excellent. The questions underlying the Net Promoter Score can be based on values and follow the likelihood of customers. These questions can be stratified to product-line. The calculation of questions underlying Net Promoter Score is most often based on a scale of 0 to 10. Those who respond with a score of 9 -10 are called Promoters, and are considered likely to exhibit value- creating behaviours, such as buying more, remaining customers for longer, and making more positive referrals to other potential customers. Those who respond with a score of 0 to 6 are labelled Detractors, and they are believed to be less likely to exhibit the value-creating behaviours. Responses of 7 and 8 are labelled Passives, and their behaviour falls in the middle of Promoters and Detractors. The Net Promoter Score is calculated by subtracting the percentage of customers who are Detractors from the percentage of customers who are Promoters. For purposes of calculating a Net Promoter Score, Passives count towards the total number of respondents, but do not directly affect the overall net score. For questions with choice to rate from 0 to 6, those who respond with a score 5-6 are called Promoters, those who respond with score 4 are called Passives and those who respond with score 0-3 are called Detractors. For questions with choice to rate from 0 to 5, those who respond with a score 4-5 are called Promoters, those who respond with score 3 are called Passives and those who respond with score 0-2 are called Detractors. SURVEY FRAMEWORK SURVEY FRAMEWORK
  69. Slide/Page #78 of 141 SURVEY FRAMEWORK SURVEY FRAMEWORK 7 0

    9 1 2 3 4 5 8 10 4 0 5 1 2 3 6 3 0 4 1 2 5 Detractors Passives Promoters Scale 10 Scale 06 Scale 05 Total Number of Promoters Total Number of Detractors Total Number of Respondents Total Number of Respondents Percentage(%) of Promoters Percentage(%) of Detractors i.e., Example, Surveys Delivered.......: 100 Surveys Responded...: 45 Rated 9-10.............................: 15 Rated 6-8................................: 10 Rate 0-5...................................: 20 Response Rate: (45 ÷ 100) x 100 = 45% NPS = ((15 ÷ 45) x 100) - ((20 ÷ 45) x 100) NPS = 33 - 44 x100 x100 NPS = -11 Surveys Responded Surveys Delivered x100 6
  70. Slide/Page #79 of 141 SURVEY FRAMEWORK SURVEY FRAMEWORK Benchmarkable Questions

    Underlying Net Promoter Score (NPS) While the pro-feature Question Bank will populate all the questions listed under various categories (including the questions to gauge Net Promoter Score), the Net Promoter Score will only populate the questions that can be used for benchmarking under various categories. These questions will then be used to evaluate the performance against category's benchmark and industry average. To make it an easy understand, please refer to the example below. NPS Q1 NPS Q2 Category: Education Institute 1 NPS Q1 NPS Q2 Institute 2 NPS Q1 NPS Q2 Institute 3 NPS:15 NPS:-5 NPS:10 NPS:20 NPS:-15 NPS:2 Benchmark – NPS Q1: 15 Average – NPS Q1: 3 Benchmark - NPS Q2: 20 Average – NPS Q2: 6 Benchmarking: NPS Q1 Benchmark Your NPS You Industry Average NPS Q2 Benchmark Your NPS Industry Average
  71. Slide/Page #80 of 141 Team Collaboration & Add Users Users

    are added to create multiple accounts within an organization. This is also required for departments to create surveys for departmental input from customers. For example, if three departments in an organization have direct interaction with customers for departmental needs, the organization may create three users and assign them certain roles. Wherein, the organization/project head will be the Primary Administrator and three additional users can either be on administrator or user role. We can hence create three role assignments: • Primary Administrator / Account Owner • Administrator • User Though all the three roles will handle some specific functions; however the Primary Administrator will have all the options available. All the users irrespective of their role or account, will have a My Account section to administer their account. The option Team Collaboration & Add Users will only be visible and specific to roles Primary Administrator / Account Owner or Administrator. The role User will not able to see this option or may be the option can be made disabled. The main function of this option is to add users and assign them their specific roles. The Primary Administrator can use this option to create Administrator and/or Users, whereas the Administrator can use this option to create Users (only if an Administrator is assigned). An Administrator cannot create another user with Administrator rights. SURVEY FRAMEWORK SURVEY FRAMEWORK
  72. Slide/Page #81 of 141 SURVEY FRAMEWORK SURVEY FRAMEWORK Once the

    Primary Administrator / Administrator thinks about creating a team, the first option visible is to Start Creating a Team. As soon as an Administrator account is created, the Administrator can then create other Users. Since, the Primary Administrator holding the Owner rights, can have access to create/edit/view/delete/suspend the Administrator(s) and/or User(s); however the Administrator can only have access to create/edit/view/delete/suspend the Users created by her/him. Options available for Primary Administrator / Account Owner Options available for Administrator
  73. Slide/Page #82 of 141 More users can be added by

    clicking the Add button; likewise the Minus and Edit buttons can be used to delete a user and/or to edit the user details (i.e., email address and user name). Through the Team Collaboration & Add User, the Primary Administrator and Administrator(s) can only administer the accounts created by them; however, since the Primary Administrator / Account Owner holding the owner rights, can view/edit/delete/suspend all the available user(s) and administrator(s) through My Account option. While every new user is created, a Send Invite button will be visible, which can be clicked to send an invitation e-mail to the user. Once the user acknowledges and clicks the URL for approval a My Account page will be created for user, with all the professional features to create Surveys (depending on the account type, i.e., an administrator account or user account). In case, of any manual glitch the option to edit, delete and resend invite is available in order to correct the manual glitch and resend the invite. Remember: There is a difference between Suspend User and Delete User. The Delete User or Minus button, once clicked will delete the user database from records, which means that all the Surveys, Library Shared Items and/or any team relationship created by User will be deleted. In case, you would like to delete the user to free the Team Size (i.e., 25 Users) and keep the relationship intact, it is recommended to Suspend User. The Suspend User button once clicked, will free the team time by one user and will keep the relationship of suspended user intact. Let's now see what all functions will be available for Primary Administrator, Administrators and Users for both Professional and Standard Accounts. SURVEY FRAMEWORK SURVEY FRAMEWORK
  74. Slide/Page #83 of 141 SURVEY FRAMEWORK SURVEY FRAMEWORK Features Administrator

    User Edit & Manage All Accounts Edit & Manage Team Billing Add/Edit/Delete Users Share Survey with Collaborators Edit the Team Name Send copies of Survey to all the Team Members Add Items to Team Library Primary Administrator Add/Edit/Delete Administrators & Users Access to My Team Page Who are Collaborators? Collaborators are the members of same team. For example, Administrator (A01) created three Users (U01, U02, U03); hence all the three Users created under Administrator (A01) are Collaborators. Analyze Results Collect Responses Design Survey Summary My Account – User Name Click My Account to see the User Options
  75. Slide/Page #84 of 141 SURVEY FRAMEWORK SURVEY FRAMEWORK Once a

    user sign-up for a survey account (either Standard or Professional Account), the My Account page will be created. The only difference is, the Standard User will not have access to professional features. Before a User (Standard / Professional) is able to create a survey, a sign-up / sign-in process is required to generate user details and/or provide further account options.
  76. Slide/Page #85 of 141 SURVEY FRAMEWORK SURVEY FRAMEWORK Primary Administrator

    – My Account Page – My Account All Accounts Profile Share Surveys My Library My Team Team Billing Social Share General Preferences Name Username Password Email Demo Account [email protected] •••••••••••••• [email protected] Contact Number 9999999999 Edit Edit Edit Edit Edit Edit Role Primary Administrator / Owner These options are one-click edit, like uploading a new photograph or changing the user details. Remember, the role cannot be edited.
  77. Slide/Page #86 of 141 SURVEY FRAMEWORK SURVEY FRAMEWORK Primary Administrator

    – My Account Page – My Account All Accounts Profile Share Surveys My Library My Team Team Billing Social Share General Preferences Plan Team Size Users Assigned Total Billed Professional 25 Users (Including Primary Administrator) 25 USD 59.99 / Year Payment Date MM/DD/YYYY Edit Plan Active Till MM/DD/YYYY Users Available 0 Add Users Payment Mode Auto Renewal Edit The plan can be degraded or upgraded (any time), the Users can be added at an additional cost and the Payment Mode can be changed to either Auto Renewal or Manual Payment.
  78. Slide/Page #87 of 141 SURVEY FRAMEWORK SURVEY FRAMEWORK Primary Administrator

    – My Account Page – My Account All Accounts Profile Share Surveys My Library My Team Team Billing Social Share General Preferences Demo Account [email protected] Primary Administrator Admin Account 1 [email protected] Administrator Admin Account 2 [email protected] Administrator User Account 1 usr1account@un User User Account 1 [email protected] User User Account 2 [email protected] User User Account 3 [email protected] User User Account 4 [email protected] User User Account 1 [email protected] User User Account 2 [email protected] User User Account 3 [email protected] User User Account 4 [email protected] User By clicking a Username, the Primary Administrator can view / edit / delete user details.
  79. Slide/Page #88 of 141 SURVEY FRAMEWORK SURVEY FRAMEWORK Primary Administrator

    – My Account Page – My Account All Accounts Profile Share Surveys My Library My Team Team Billing Social Share General Preferences Demo Account [email protected] Primary Administrator Admin Account 1 [email protected] Administrator Admin Account 2 [email protected] Administrator User Account 1 usr1account@un User By clicking a Username, the Primary Administrator can view / edit / delete user details.
  80. Slide/Page #89 of 141 SURVEY FRAMEWORK SURVEY FRAMEWORK Primary Administrator

    – My Account Page – My Account All Accounts Profile Share Surveys My Library My Team Team Billing Social Share General Preferences Select from the below Survey(s) that you wish to share (S001) – About University (S002) – About Teachers (S003) – Engagement Quiz (S004) – Customer Satisfaction (S005) – Custom NPS □ □ □ □  □  Share Share with User Account 1 (A01U01) Admin Account 1 (A01) User Account 1 (A01U01) User Account 2 (A01U02) User Account 3 (A01U03) User Account 4 (A01U04) Admin Account 2 (A02) User Account 1 (A02U01) User Account 2 (A02U02) User Account 3 (A02U03) User Account 4 (A02U04) Use Ctrl+Click to select multiple users Share Survey(s) Survey(s) Shared
  81. Slide/Page #90 of 141 SURVEY FRAMEWORK SURVEY FRAMEWORK Primary Administrator

    – My Account Page – My Account All Accounts Profile Share Surveys My Library My Team Team Billing Social Share General Preferences You shared the following survey(s) (S001) – About University (S002) – About Teachers □ □ Share Select user(s) Admin Account 1 (A01) User Account 1 (A01U01) User Account 2 (A01U02) User Account 3 (A01U03) User Account 4 (A01U04) Admin Account 2 (A02) User Account 1 (A02U01) User Account 2 (A02U02) User Account 3 (A02U03) User Account 4 (A02U04) Use Ctrl+Click to select multiple users Share Survey(s) Survey(s) Shared Shared with User Account 1 (A01U01) Shared with User Account 1 (A01U01) Select from above survey(s) that you wish to share with
  82. Slide/Page #91 of 141 SURVEY FRAMEWORK SURVEY FRAMEWORK Primary Administrator

    – My Account Page – My Account All Accounts Profile Share Surveys My Library My Team Team Billing Social Share General Preferences Images Documents Reports Music Videos By selecting any of the above categories, will populate the stored library of Images, Documents, Reports, Music and/or Videos. The Primary Administrator and/or Administrator(s) will have the right to share the library item(s) with their down line either by selecting one item or multiple items. The selection process is simple and is same for all the categories. Let's see an example of selecting Images in the next slide.
  83. Slide/Page #92 of 141 SURVEY FRAMEWORK SURVEY FRAMEWORK Primary Administrator

    – My Account Page – My Account All Accounts Profile Share Surveys My Library My Team Team Billing Social Share General Preferences Images Documents Reports Music Videos □ □ Image Image Name Share With Type Man_Laptop PNG Share Select user(s) □ Blue_Back JPG Select user(s) □ Office_Space JPG Select user(s) □ Office_Space1 JPG Select user(s) □ Office_Space2 JPG Select user(s) Admin Account 1 (A01) User Account 1 (A01U01) User Account 2 (A01U02) User Account 3 (A01U03) User Account 4 (A01U04) Admin Account 2 (A02) User Account 1 (A02U01) User Account 2 (A02U02) User Account 3 (A02U03) User Account 4 (A02U04) Use Ctrl+Click to select multiple users
  84. Slide/Page #93 of 141 SURVEY FRAMEWORK SURVEY FRAMEWORK Primary Administrator

    – My Account Page – My Account All Accounts Profile Share Surveys My Library My Team Team Billing Social Share General Preferences Now link your social accounts and do a one-click share of reports Update Save This button will change to in case no account is linked Linked Link Link Linked As soon as the linking is initiated, a new browser window will open for the service demanded and will take user permission to access particular account. Once the linking is successful this button will change to Linked Linked as Unextt, India Not linked Not linked Linked as @Unextt Remove Link Remove Link Remove Link Remove Link
  85. Slide/Page #94 of 141 SURVEY FRAMEWORK SURVEY FRAMEWORK Primary Administrator

    – My Account Page – My Account All Accounts Profile Share Surveys My Library My Team Team Billing Social Share General Preferences Language Time Zone Survey Alerts Unextt Newsletter English (UTC+05:30) Kolkata/India Alerts are ON for Existing & New Surveys Subscribed Edit Edit Edit Edit While all the general preferences are self explanatory, the Survey Alerts will send an e-mail notification as soon as a response is captured. Once the Edit button is hit for Survey Alerts, it will show two editable check boxes for receiving alerts on Existing and/or New Surveys.
  86. Slide/Page #95 of 141 SURVEY FRAMEWORK SURVEY FRAMEWORK Administrator –

    My Account Page – My Account Profile Share Surveys My Library My Team Team Billing General Preferences Name Username Password Email Admin Account [email protected] •••••••••••••• [email protected] Contact Number 9999999999 Edit Edit Edit Edit Edit Edit Role Administrator These options are one-click edit, like uploading a new photograph or changing the user details. Remember, the role can only be edited by Primary Administrator.
  87. Slide/Page #96 of 141 SURVEY FRAMEWORK SURVEY FRAMEWORK Administrator –

    My Account Page – My Account Profile Share Surveys My Library My Team Team Billing General Preferences Plan Team Size Users Assigned Professional 25 Users (Including Primary Administrator) 25 Users Available 0 An administrator can only view these options, but will not have the rights to edit them.
  88. Slide/Page #97 of 141 SURVEY FRAMEWORK SURVEY FRAMEWORK Administrator –

    My Account Page – My Account Profile Share Surveys My Library My Team Team Billing General Preferences Admin Account [email protected] Administrator User Account 1 [email protected] User User Account 2 [email protected] User User Account 3 usr3account@un User By clicking a Username, the Administrator can view / edit / delete user details.
  89. Slide/Page #98 of 141 SURVEY FRAMEWORK SURVEY FRAMEWORK Administrator –

    My Account Page – My Account Profile Share Surveys My Library My Team Team Billing General Preferences Select from the below Survey(s) that you wish to share (S001) – About University (S002) – About Teachers (S003) – Engagement Quiz (S004) – Customer Satisfaction (S005) – Custom NPS □ □ □ □  □  Share Share with User Account 1 (A01U01) User Account 1 (A01U01) User Account 2 (A01U02) User Account 3 (A01U03) User Account 4 (A01U04) Use Ctrl+Click to select multiple users Share Survey(s) Survey(s) Shared An Administrator can only share the surveys with his/her downline.
  90. Slide/Page #99 of 141 SURVEY FRAMEWORK SURVEY FRAMEWORK Administrator –

    My Account Page – My Account Profile Share Surveys My Library My Team Team Billing General Preferences You shared the following survey(s) (S001) – About University (S002) – About Teachers □ □ Share Select user(s) User Account 1 (A01U01) User Account 2 (A01U02) User Account 3 (A01U03) User Account 4 (A01U04) Use Ctrl+Click to select multiple users Share Survey(s) Survey(s) Shared Shared with User Account 1 (A01U01) Shared with User Account 1 (A01U01) Select from above survey(s) that you wish to share with An Administrator can only share the surveys with his/her downline.
  91. Slide/Page #100 of 141 SURVEY FRAMEWORK SURVEY FRAMEWORK Administrator –

    My Account Page – My Account Profile Share Surveys My Library My Team Team Billing General Preferences Images Documents Reports Music Videos By selecting any of the above categories, will populate the stored library of Images, Documents, Reports, Music and/or Videos. The Administrator(s) will have the right to share the library item(s) with their down line either by selecting one item or multiple items. The selection process is simple and is same for all the categories. Let's see an example of selecting Images in the next slide.
  92. Slide/Page #101 of 141 SURVEY FRAMEWORK SURVEY FRAMEWORK Administrator –

    My Account Page – My Account Profile Share Surveys My Library My Team Team Billing General Preferences Images Documents Reports Music Videos □ □ Image Image Name Share With Type Man_Laptop PNG Share Select user(s) □ Blue_Back JPG Select user(s) □ Office_Space JPG Select user(s) □ Office_Space1 JPG Select user(s) □ Office_Space2 JPG Select user(s) User Account 1 (A01U01) User Account 2 (A01U02) User Account 3 (A01U03) User Account 4 (A01U04) Use Ctrl+Click to select multiple users
  93. Slide/Page #102 of 141 SURVEY FRAMEWORK SURVEY FRAMEWORK Administrator –

    My Account Page – My Account Profile Share Surveys My Library My Team Team Billing General Preferences Language Time Zone Survey Alerts Unextt Newsletter English (UTC+05:30) Kolkata/India Alerts are ON for Existing & New Surveys Subscribed Edit Edit Edit Edit While all the general preferences are self explanatory, the Survey Alerts will send an e-mail notification as soon as a response is captured. Once the Edit button is hit for Survey Alerts, it will show two editable check boxes for receiving alerts on Existing and/or New Surveys.
  94. Slide/Page #103 of 141 SURVEY FRAMEWORK SURVEY FRAMEWORK User –

    My Account Page – My Account Profile Share Surveys My Library General Preferences Name Username Password Email User Account [email protected] •••••••••••••• [email protected] Contact Number 9999999999 Edit Edit Edit Edit Edit Edit Role User These options are one-click edit, like uploading a new photograph or changing the user details. Remember, the role can either be edited by Primary Administrator or Administrator.
  95. Slide/Page #104 of 141 SURVEY FRAMEWORK SURVEY FRAMEWORK User –

    My Account Page – My Account Profile Share Surveys My Library General Preferences Select from the below Survey(s) that you wish to share (S001) – About University (S002) – About Teachers (S003) – Engagement Quiz (S004) – Customer Satisfaction (S005) – Custom NPS □ □ □ □  □  Share Share with Use Ctrl+Click to select multiple users Share Survey(s) Survey(s) Shared A User can only share the surveys within his/her administrator's team. User Account 1 (A01U02) Admin Account 1 (A01) User Account 1 (A01U01) User Account 2 (A01U02) User Account 3 (A01U03) User Account 4 (A01U04)
  96. Slide/Page #105 of 141 SURVEY FRAMEWORK SURVEY FRAMEWORK User –

    My Account Page – My Account Profile Share Surveys My Library General Preferences You shared the following survey(s) (S001) – About University (S002) – About Teachers □ □ Share Use Ctrl+Click to select multiple users Share Survey(s) Survey(s) Shared Shared with User Account 1 (A01U01) Shared with User Account 1 (A01U01) Select from above survey(s) that you wish to share with Select user(s) Admin Account 1 (A01) User Account 1 (A01U01) User Account 2 (A01U02) User Account 3 (A01U03) User Account 4 (A01U04) A User can only share the surveys within his/her administrator's team.
  97. Slide/Page #106 of 141 SURVEY FRAMEWORK SURVEY FRAMEWORK User –

    My Account Page – My Account Profile Share Surveys My Library General Preferences Images Documents Reports Music Videos By selecting any of the above categories, will populate the stored library of Images, Documents, Reports, Music and/or Videos. The users will have the right to share the library item(s) within their administrator's team either by selecting one item or multiple items. The selection process is simple and is same for all the categories. Let's see an example of selecting Images in the next slide.
  98. Slide/Page #107 of 141 SURVEY FRAMEWORK SURVEY FRAMEWORK User –

    My Account Page – My Account Profile Share Surveys My Library General Preferences Images Documents Reports Music Videos □ □ Image Image Name Share With Type Man_Laptop PNG Share Select user(s) □ Blue_Back JPG Select user(s) □ Office_Space JPG Select user(s) □ Office_Space1 JPG Select user(s) □ Office_Space2 JPG Use Ctrl+Click to select multiple users Select user(s) Admin Account 1 (A01) User Account 1 (A01U01) User Account 2 (A01U02) User Account 3 (A01U03) User Account 4 (A01U04)
  99. Slide/Page #108 of 141 SURVEY FRAMEWORK SURVEY FRAMEWORK User –

    My Account Page – My Account Profile Share Surveys My Library General Preferences Language Time Zone Survey Alerts English (UTC+05:30) Kolkata/India Alerts are ON for Existing & New Surveys Edit Edit Edit While all the general preferences are self explanatory, the Survey Alerts will send an e-mail notification as soon as a response is captured. Once the Edit button is hit for Survey Alerts, it will show two editable check boxes for receiving alerts on Existing and/or New Surveys.
  100. Slide/Page #109 of 141 SURVEY FRAMEWORK SURVEY FRAMEWORK Standard User

    – My Account Page – My Account Profile Account Details General Preferences Name Username Password Email Standard Account [email protected] •••••••••••••• [email protected] Contact Number 9999999999 Edit Edit Edit Edit Edit Edit Role Individual These options are one-click edit, like uploading a new photograph or changing the user details. Remember, the role cannot be edited and will only change to Primary Administrator / Owner only if an Individual buys a Professional Plan.
  101. Slide/Page #110 of 141 SURVEY FRAMEWORK SURVEY FRAMEWORK Standard User

    – My Account Page – My Account Profile Account Details General Preferences Plan Team Size Users Assigned Total Billed Standard 1 User 1 USD 0.00 / Year Upgrade Plan Active Till NaN Users Available 0 A Standard plan can be upgraded to Professional Plan (any time) Survey Limit 5 Surveys Created 4 Available Surveys 1 Upgrade
  102. Slide/Page #111 of 141 SURVEY FRAMEWORK SURVEY FRAMEWORK Standard User

    – My Account Page – My Account Profile Account Details General Preferences Language Time Zone Survey Alerts Unextt Newsletter English (UTC+05:30) Kolkata/India Alerts are ON for Existing & New Surveys Subscribed Edit Edit Edit While all the general preferences are self explanatory, the Survey Alerts will send an e-mail notification as soon as a response is captured. Once the Edit button is hit for Survey Alerts, it will show two editable check boxes for receiving alerts on Existing and/or New Surveys. Remember: Standard Plan does not support Multi-language, hence the language cannot be changed.
  103. Slide/Page #112 of 141 SURVEY FRAMEWORK SURVEY FRAMEWORK Once a

    survey is created, it is saved in Drafts unless a user moves further to collect responses. The reports can be generated any time after the responses are collected unless a survey is deleted. Any user once logged out of survey system/software; has to re-login again. The user post re-login will see the survey(s) summary to make further modifications or to choose next course of action. In case, no surveys are created by user, the user should forcefully see an option to create survey (as explained from Slide #8). Survey Summary once a user re-login to Survey System/Software ALL SURVEYS 320 07-Jul-2016 S001 – About University Created 03-Jul-2016 TITLE MODIFIED RESPONSES EDIT COLLECT ANALYZE 1236 23-Aug-2016 S002 – About Teacher Created 16-Aug-2016 0 - S003 – Engagement Quiz Created 30-Aug-2016 0 - S004 – Customer Satisfaction Created 06-Sep-2016 0 - S005 – Custom NPS Created 16-Sep-2016 Add a New Survey Add a New Survey will work the same as explained from Slide #9
  104. Slide/Page #113 of 141 SURVEY FRAMEWORK SURVEY FRAMEWORK Selecting a

    Survey Title or hitting the Edit button will take a user to Survey Design page. Once a survey is designed and responses are collected, the collect image will be disabled, else if the responses are not yet collected the collect image will be enabled. Similarly, if the responses have been collected, the Analyze button will be enabled else disabled. Once the surveys are designed the next step is to collect the responses; hence it makes it equally important to understand the ways of collecting these responses. The responses can be collected in any of the ways given below: 1) Email 2) Web link 3) Social Media 4) Website Embedding 5) Mobile App Embedding Hence, once a user moved to collect responses, he will get these options to choose from. Remember: A Standard User will only have the option to collect the responses through email. Let's see as to how all these options work … Once a user hits on Collect Responses or the collect image, the following options will populate ...
  105. Slide/Page #114 of 141 SURVEY FRAMEWORK SURVEY FRAMEWORK Every collection

    method has it's own use and representation. In the next few slides we will see as to how these options will be used to collect responses. Remember: The Standard Users will only have the option to collect responses by email. Analyze Results Collect Responses Design Survey Summary / SURVEY TITLE How would you like to collect responses to your survey? Send by Email Get Web Link Post on Social Media Embed on Website Embed on Mobile App Create custom email invitations to collect responses. Send follow up reminders to those who haven’t responded. Share a web link through email or post on social media / website. This option is most useful. Post your surveys on linked / unlinked social media accounts, such as Facebook, LinkedIn, Twitter etc. Embed your surveys on your websites Embed your surveys on your mobile applications, i.e., both iOS or Android Manual Data Entry To enter the responses manually
  106. Slide/Page #115 of 141 SURVEY FRAMEWORK SURVEY FRAMEWORK Sending a

    survey through email involves but not limited to three options, 1) Permission to connect a custom email client with survey framework 2) Adding the list of recipients 3) Sending the surveys either through custom email client or default survey client In order to connect a custom email client with survey framework, it is important to capture permission from user to use the preferred email client to send surveys. The permission can be captured for various email clients individually, such as Gmail, Yahoo, Outlook or by using POP/IMAP/SMTP etc. Once the permission(s) is/are captured, the custom email client can then be used to send surveys to collect responses. In addition to capture permission, it is equally important to get the list of recipients. The list of recipients can either be added manually or may be uploaded using the Comma Separated Value (CSV) file. In case the user wanted to use the default survey client to collect responses, the user may do so. In such cases, the email will show the survey received from unextt.com and unextt.com will not be responsible for any surveys landing in recipients spam folders. Send by Email Create custom email invitations to collect responses. Send follow up reminders to those who haven’t responded.
  107. Slide/Page #116 of 141 SURVEY FRAMEWORK SURVEY FRAMEWORK Send by

    Email Create custom email invitations to collect responses. Send follow up reminders to those who haven’t responded. Please choose an email client to send surveys OR USE Default How would you like to add the list of recipients? OR Send to: Enter email addresses separated by comma Subject: We want your opinion! Message: We're running a survey and would love your input. Please let us know what you think below. Thanks for participating! How would you rate us? How likely is it that you would recommend us to a friend or colleague? This will be replaced with CSV Uploaded in case the recipients list is added through CSV. Hitting this will take the recipient to a Web Link
  108. Slide/Page #117 of 141 SURVEY FRAMEWORK SURVEY FRAMEWORK Get Web

    Link Share a web link through email or post on social media / website. This option is most useful. In case a user wish to share a link/URL with recipients to visit and provide feedback or refer to, the web link is an easy option. The web link is also a most useful option for users to get feedback through email, social media or website. The Web Link will be automatically generated (once the Generate button is clicked) based on the survey title and/or unique reference given to survey that user wishes to share. For example, https://www.unext-survey.com/travel-survey/ Please also refer to Web Link defined in Custom Variable on Slide #71. Web Link: Generate https://www.unextt-survey.com/travel-survey/ Web Link: Generate Copy the above Web Link to share it across.
  109. Slide/Page #118 of 141 SURVEY FRAMEWORK SURVEY FRAMEWORK Posting the

    surveys on social media is another great utility that can be used by users. This option automatically checks for linked social media accounts (linked by Primary Administrator / Owner and as explained in Slide #93). The user will have the option to post the surveys either on linked or non linked social media accounts. Post on Social Media Post your surveys on linked / unlinked social media accounts, such as Facebook, LinkedIn, Twitter etc. Linked as Unextt, India Linked as @Unextt Share https://www.unextt-survey.com/travel-survey/ Web Link: Can you spare a few moments to take my survey? Headline: Please take the survey titled "Travel Survey". Your feedback is important! Message: Share with Linked Social Media: OR □ □ Share with Non Linked Social Media from below:
  110. Slide/Page #119 of 141 SURVEY FRAMEWORK SURVEY FRAMEWORK Embedding the

    survey on website is a scripting tool and the script depends on the language used to create survey system. The script to embed a survey can be written in any language and the same can be made available for users to embed the script code in their website to embed the desired survey. Copy Code Script: <Script = Java Script/PHP or any other language> : : Embed = Survey Title / Unique Reference : : </Script> Please copy and paste the above script at the desired section of your website. Embed on Website Embed your surveys on your websites
  111. Slide/Page #120 of 141 SURVEY FRAMEWORK SURVEY FRAMEWORK Embedding the

    survey in mobile app requires an Android or iOS SDK along with survey hash. The survey hash can be generated and pasted into the Xcode or Android Studio project, where the SDK is initialized. The next step is to collect responses. In case the responses have to be collected online the above five mediums are useful; however to post the manual entries please see the following slide for Manual Data Entry. Generate Hash Step 1: Download the Survey iOS SDK or Android SDK Step 2: Generate a survey hash below and paste it into your Xcode or Android Studio Project, where you initialized the SDK JTHYBPG Embed on Mobile App Embed your surveys on your mobile applications, i.e., both iOS or Android
  112. Slide/Page #121 of 141 SURVEY FRAMEWORK SURVEY FRAMEWORK For places

    where data has already been collected on paper surveys and the reports or graphs have to be automated, the manual data entry will be the best option. In order to do a manual data entry, the questions have to be formed and once the Manual Data Entry collector is selected, it will flash these questions to add choices or answers. Post collecting the responses through desired medium, it's time to circulate reports and create charts/graphs to represent the data. Let's see... + New Response Manual Data Entry To enter the responses manually Please click + New Response to enter manual responses from the paper version of this survey. Please Ensure that the survey is closed for further additions. S001 – Travel Survey Date Collected Date Modified Status Date Modified Mon 26-Sep-16 14:55 Mon 26-Sep-16 14:57 Finished Edit | Delete Mon 26-Sep-16 14:57 Mon 26-Sep-16 14:57 Finished Edit | Delete Mon 26-Sep-16 14:58 - Finished Edit | Delete Mon 26-Sep-16 14:59 - Finished Edit | Delete 4 Responses Collected
  113. Slide/Page #122 of 141 The entire survey system holds various

    modules and/or sub-modules. Each module and/or sub-module holds its own set of functions. To set an object oriented approach, it is important to understand the modular programming. The basic approach to get the modular programming functioning is by creating primary and secondary masters aka, parent-child relationship. Let's start understanding: 1) The required number of masters 2) Parent-Child relationship 3) Operation of Parent-Child relationship Also remember, that a unique key must be defied in order to act as a common medium to communicate between masters. The list of masters: • User Account Master • Plan Master • Features Master • Survey Title Master • Common Fields Master • Organization Master • Response Master • Organization Standard User Master • Organization Primary Admin Master • Organization Primary Admin Admin Master • Organization Primary Admin User Master • Library Master UNDERSTANDING MASTERS & DATABASE SCHEME UNDERSTANDING MASTERS & DATABASE SCHEME
  114. Slide/Page #123 of 141 • Library Image Master • Library

    Documents Master • Library Reports Master • Library Music Master • Library Videos Master • Questions Bank Master • Net Promoters Score Master • Team Collaboration Master • Total Users Master • Add Users Master • Social Master • Page Master • Page Title Master • Page Action Master • Question Master • Theme Master • Default Theme Master • Custom Theme Master • Team Theme Master • Logic Master • Question Piping Skip Logic Master • Question Answer Piping Master • Page Randomization Master • Options Master • Handlers Master • Quota Master UNDERSTANDING MASTERS & DATABASE SCHEME UNDERSTANDING MASTERS & DATABASE SCHEME
  115. Slide/Page #124 of 141 • Custom Variable Master • Graphs

    Master • Reports Master • Pro Features Master • Trends Master • Comparison Master • Deviation Master • Pareto Master • Coefficient Master • Proportion Master • Data Export Master • Pie Chart Master • Bar Chart Master • Line Chart Master • Stack 100 Bar Chart Master • Stack Bar Chart Master • Stack 100 Area Chart Master • Stack Area Chart Master • Waterfall Chart Master • Tree Map Chart Master • Scatter Bubble Chart Master • Response Email Master • Response Weblink Master • Response Social Media Master • Response Website Master UNDERSTANDING MASTERS & DATABASE SCHEME UNDERSTANDING MASTERS & DATABASE SCHEME
  116. Slide/Page #125 of 141 • Response Mobile Master • Response

    Manual Master • Question Choice Master • Question Choice Allow More Than One Answer Master • Question Choice Allow Multiple Responses Master • Question Choice Adjust Question Layout Master • Question Choice Add Comments Master • Question Choice Required Answer Master • Question Choice Change Layout Master • Question Choice Random Answers Master • Question Choice Enable Question AB Test Master • Question Choice Add Rating Label Master • Question Choice Valid Answer Master • Question Choice Use Weight Master • Question Choice Force Rank Master • Question Choice Adjust Slider Scale Master • Question Choice Only Numeric Master • Question Multiple Choice Master • Question Drop Down Master • Question Star Rating Master • Question Matrix Rating Scale Master • Question Ranking Master • Question Single Text Master • Question Comment Master • Question Contact Master UNDERSTANDING MASTERS & DATABASE SCHEME UNDERSTANDING MASTERS & DATABASE SCHEME
  117. Slide/Page #126 of 141 • Question Date Time Master •

    Question Text Master • Question Image Master • Question Drop Down Matrix Master • Question Slider Master • Question Multiple Text Master • Question Text AB Test Master • Question Image AB Test Master • Question Advance Matrix Rating Scale Master Each master holds its own set of values and will have its own function, collaboratively with other masters in order to form an object oriented schema. Since we now have a view of masters and our approach, let's now see how these masters form a parent- child relationship. We probably can also set up a Visitors Master to capture the data of visitors by tracking their IPs to identify the major traffic trends or Subscriber Master to get the list of subscribers who would like to get the news about latest events or functions of our survey system, by capturing the e-mail addresses of subscribers and their IPs to identify the subscribers traffic. These masters can have a relationship set-up with Account Master to identify the visitors/subscribers who actually created an account on Survey System to identify its trend. Let’s see the graphical outlier of this relationship in following slides. UNDERSTANDING MASTERS & DATABASE SCHEME UNDERSTANDING MASTERS & DATABASE SCHEME
  118. Slide/Page #127 of 141 UNDERSTANDING MASTERS & DATABASE SCHEME UNDERSTANDING

    MASTERS & DATABASE SCHEME UID user_id sysdb_user_acc Data captured from Sign-up Page UID user_id plan_code sysdb_user_plan Data captured from Plan type chosen By customer UID user_id plan_code survey_code sysdb_survey_title Data captured from Summary Page UID survey_code cfield_code sysdb_common_fields Data captured from Summary Page UID user_id plan_code survey_code response_code sysdb_response Data captured from Response Page UID survey_code user_id plan_code org_code sysdb_org Data captured from User Profile Page UID survey_code user_id plan_code org_code admin_code sysdb_org_stduser Data captured from User Profile Page UID survey_code user_id plan_code org_code admin_code sysdb_org_padmin_u Data captured from User Profile Page UID survey_code user_id plan_code org_code admin_code sysdb_org_padmin_a Data captured from User Profile Page UID survey_code user_id plan_code org_code admin_code sysdb_org_padmin Data captured from User Profile Page UID survey_code user_id plan_code org_code admin_code lib_code sysdb_library Data captured from Library Page UID survey_code user_id plan_code org_code admin_code lib_code, lib_rpts_code sysdb_lib_rpts Data captured from Library Page UID survey_code user_id plan_code org_code admin_code lib_code, lib_msc_code sysdb_lib_msc Data captured from Library Page UID survey_code user_id plan_code org_code admin_code lib_code, lib_vid_code sysdb_lib_vid Data captured from Library Page UID survey_code user_id plan_code org_code admin_code lib_code, lib_img_code sysdb_lib_img Data captured from Library Page UID survey_code user_id plan_code org_code admin_code lib_code, lib_docs_code sysdb_lib_docs Data captured from Library Page UID user_id plan_code survey_code feature_code sysdb_feature Internal Data based on sysdb_user_plan UID user_id plan_code survey_code feature_code page_code sysdb_page Data captured from Survey Design Page UID user_id plan_code survey_code feature_code page_code question_code sysdb_question Data captured from Survey Design Page UID user_id plan_code survey_code feature_code page_code theme_code sysdb_theme Data captured from Survey Design Page UID user_id plan_code survey_code feature_code page_code logic_code sysdb_logic Data captured from Survey Design Page UID user_id plan_code survey_code feature_code page_code options_code sysdb_options Data captured from Survey Design Page UID user_id plan_code survey_code feature_code page_code handlers_code sysdb_handlers Data captured from Survey Design Page UID user_id plan_code survey_code feature_code page_code graph_code sysdb_graphs Data captured from Survey Design Page UID user_id plan_code survey_code feature_code page_code report_code sysdb_report Data captured from Survey Design Page UID user_id plan_code survey_code feature_code page_code profeature_code sysdb_profeature Data captured from Survey Design Page UID user_id plan_code survey_code feature_code page_code page_title_code sysdb_page_title Data captured from Page Design Page UID user_id plan_code survey_code feature_code page_code page_action_code sysdb_page_action Data captured from Page Design Page A UID user_id plan_code survey_code feature_code page_code theme_code default_thm_code sysdb_default_thm Data captured from Theme Page UID user_id plan_code survey_code feature_code page_code theme_code custom_thm_code sysdb_custom_thm Data captured from Theme Page UID user_id plan_code survey_code feature_code page_code theme_code team_thm_code sysdb_team_thm Data captured from Theme Page UID user_id plan_code survey_code feature_code page_code logic_code qpsl_code sysdb_qpsl Data captured from Logic Page UID user_id plan_code survey_code feature_code page_code logic_code qap_code sysdb_qap Data captured from Logic Page UID user_id plan_code survey_code feature_code page_code logic_code pr_code sysdb_pr Data captured from Logic Page UID user_id plan_code survey_code feature_code page_code handlers_code quota_code sysdb_quota Data captured from Handlers Page UID user_id plan_code survey_code feature_code page_code handlers_code cvariable_code sysdb_cvariable Data captured from Handlers Page B C D E UID user_id plan_code survey_code feature_code page_code profeature_code qbank_code sysdb_qbank Data captured from Pro Features Page UID user_id plan_code survey_code feature_code page_code profeature_code nps_code sysdb_nps Data captured from Pro Features Page UID user_id plan_code survey_code feature_code page_code profeature_code teamcollab_code sysdb_teamcollab Data captured from Pro Features Page UID user_id plan_code survey_code feature_code page_code profeature_code totaluser_code sysdb_totaluser Data captured from Pro Features Page UID user_id plan_code survey_code feature_code page_code profeature_code adduser_code sysdb_adduser Data captured from Pro Features Page UID user_id plan_code survey_code feature_code page_code profeature_code social_code sysdb_social Data captured from Pro Features Page D
  119. Slide/Page #128 of 141 UNDERSTANDING MASTERS & DATABASE SCHEME UNDERSTANDING

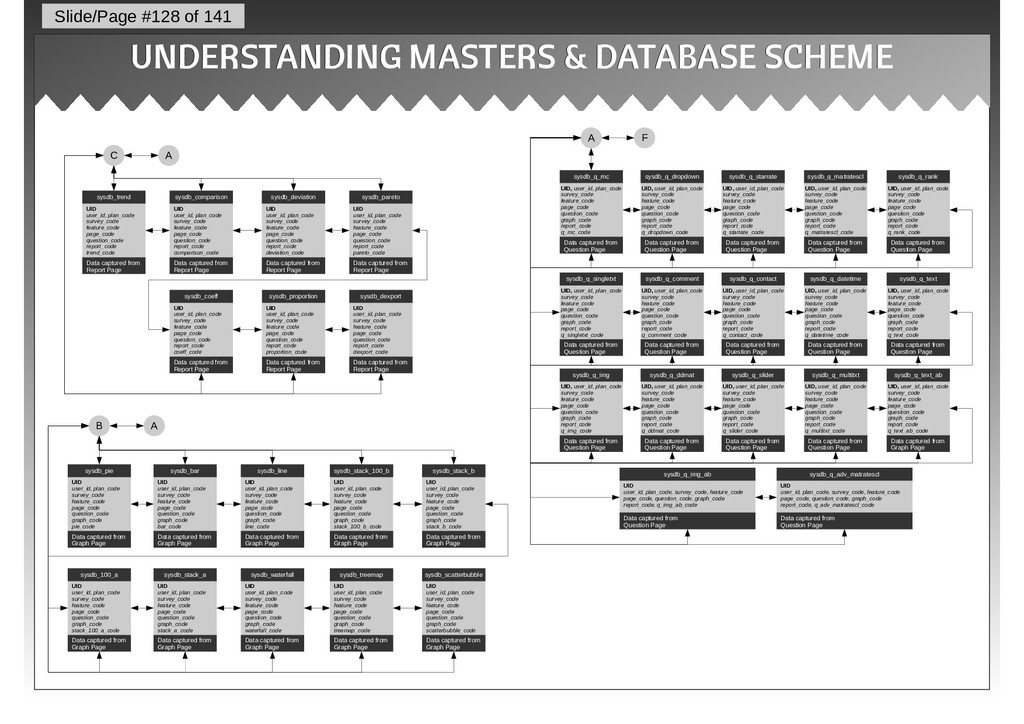
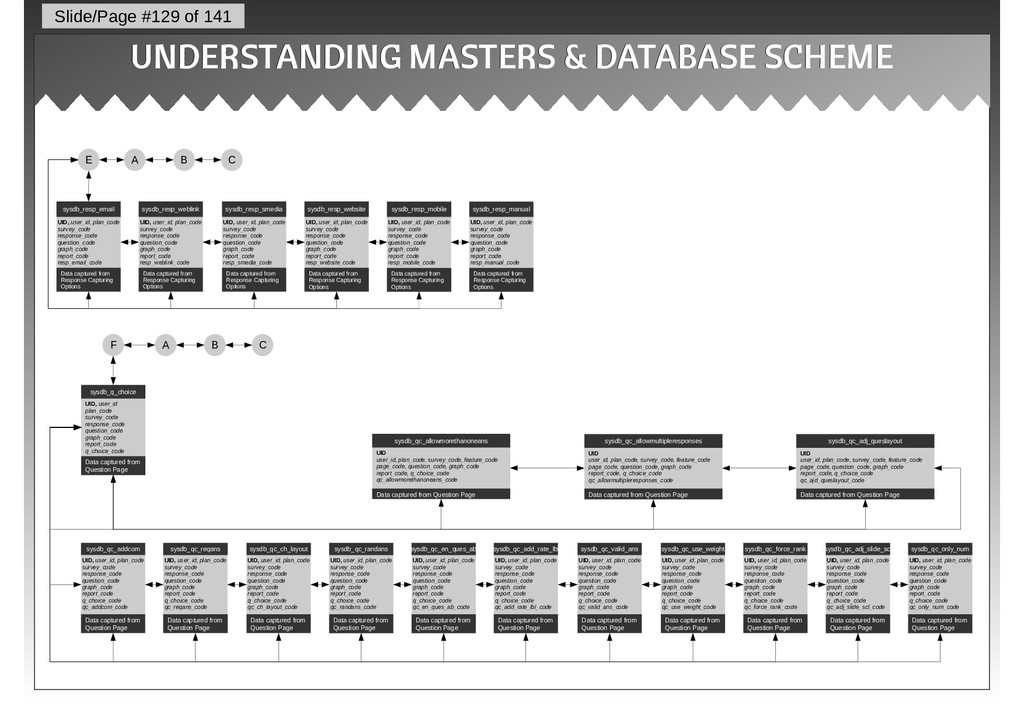
    MASTERS & DATABASE SCHEME UID user_id, plan_code survey_code feature_code page_code question_code report_code trend_code sysdb_trend Data captured from Report Page UID user_id, plan_code survey_code feature_code page_code question_code report_code comparison_code sysdb_comparison Data captured from Report Page UID user_id, plan_code survey_code feature_code page_code question_code report_code deviation_code sysdb_deviation Data captured from Report Page UID user_id, plan_code survey_code feature_code page_code question_code report_code pareto_code sysdb_pareto Data captured from Report Page UID user_id, plan_code survey_code feature_code page_code question_code report_code coeff_code sysdb_coeff Data captured from Report Page UID user_id, plan_code survey_code feature_code page_code question_code report_code proportion_code sysdb_proportion Data captured from Report Page UID user_id, plan_code survey_code feature_code page_code question_code report_code dexport_code sysdb_dexport Data captured from Report Page C A UID user_id, plan_code survey_code feature_code page_code question_code graph_code pie_code sysdb_pie Data captured from Graph Page UID user_id, plan_code survey_code feature_code page_code question_code graph_code bar_code sysdb_bar Data captured from Graph Page UID user_id, plan_code survey_code feature_code page_code question_code graph_code line_code sysdb_line Data captured from Graph Page UID user_id, plan_code survey_code feature_code page_code question_code graph_code stack_100_b_code sysdb_stack_100_b Data captured from Graph Page UID user_id, plan_code survey_code feature_code page_code question_code graph_code stack_b_code sysdb_stack_b Data captured from Graph Page UID user_id, plan_code survey_code feature_code page_code question_code graph_code stack_100_a_code sysdb_100_a Data captured from Graph Page UID user_id, plan_code survey_code feature_code page_code question_code graph_code stack_a_code sysdb_stack_a Data captured from Graph Page UID user_id, plan_code survey_code feature_code page_code question_code graph_code waterfall_code sysdb_waterfall Data captured from Graph Page UID user_id, plan_code survey_code feature_code page_code question_code graph_code treemap_code sysdb_treemap Data captured from Graph Page UID user_id, plan_code survey_code feature_code page_code question_code graph_code scatterbubble_code sysdb_scatterbubble Data captured from Graph Page B A UID, user_id, plan_code survey_code feature_code page_code question_code graph_code report_code q_mc_code sysdb_q_mc Data captured from Question Page UID, user_id, plan_code survey_code feature_code page_code question_code graph_code report_code q_dropdown_code sysdb_q_dropdown Data captured from Question Page UID, user_id, plan_code survey_code feature_code page_code question_code graph_code report_code q_starrate_code sysdb_q_starrate Data captured from Question Page UID, user_id, plan_code survey_code feature_code page_code question_code graph_code report_code q_matratescl_code sysdb_q_matratescl Data captured from Question Page UID, user_id, plan_code survey_code feature_code page_code question_code graph_code report_code q_rank_code sysdb_q_rank Data captured from Question Page UID, user_id, plan_code survey_code feature_code page_code question_code graph_code report_code q_singletxt_code sysdb_q_singletxt Data captured from Question Page UID, user_id, plan_code survey_code feature_code page_code question_code graph_code report_code q_comment_code sysdb_q_comment Data captured from Question Page UID, user_id, plan_code survey_code feature_code page_code question_code graph_code report_code q_contact_code sysdb_q_contact Data captured from Question Page UID, user_id, plan_code survey_code feature_code page_code question_code graph_code report_code q_datetime_code sysdb_q_datetime Data captured from Question Page UID, user_id, plan_code survey_code feature_code page_code question_code graph_code report_code q_text_code sysdb_q_text Data captured from Question Page UID, user_id, plan_code survey_code feature_code page_code question_code graph_code report_code q_img_code sysdb_q_img Data captured from Question Page UID, user_id, plan_code survey_code feature_code page_code question_code graph_code report_code q_ddmat_code sysdb_q_ddmat Data captured from Question Page UID, user_id, plan_code survey_code feature_code page_code question_code graph_code report_code q_slider_code sysdb_q_slider Data captured from Question Page UID, user_id, plan_code survey_code feature_code page_code question_code graph_code report_code q_multitxt_code sysdb_q_multitxt Data captured from Question Page UID, user_id, plan_code survey_code feature_code page_code question_code graph_code report_code q_text_ab_code sysdb_q_text_ab Data captured from Graph Page UID user_id, plan_code, survey_code, feature_code page_code, question_code, graph_code report_code, q_img_ab_code sysdb_q_img_ab Data captured from Question Page UID user_id, plan_code, survey_code, feature_code page_code, question_code, graph_code report_code, q_adv_matratescl_code sysdb_q_adv_matratescl Data captured from Question Page A F
  120. Slide/Page #129 of 141 UNDERSTANDING MASTERS & DATABASE SCHEME UNDERSTANDING

    MASTERS & DATABASE SCHEME UID, user_id, plan_code survey_code response_code question_code graph_code report_code resp_email_code sysdb_resp_email Data captured from Response Capturing Options E A B C UID, user_id, plan_code survey_code response_code question_code graph_code report_code resp_weblink_code sysdb_resp_weblink Data captured from Response Capturing Options UID, user_id, plan_code survey_code response_code question_code graph_code report_code resp_smedia_code sysdb_resp_smedia Data captured from Response Capturing Options UID, user_id, plan_code survey_code response_code question_code graph_code report_code resp_website_code sysdb_resp_website Data captured from Response Capturing Options UID, user_id, plan_code survey_code response_code question_code graph_code report_code resp_mobile_code sysdb_resp_mobile Data captured from Response Capturing Options UID, user_id, plan_code survey_code response_code question_code graph_code report_code resp_manual_code sysdb_resp_manual Data captured from Response Capturing Options UID user_id, plan_code, survey_code, feature_code page_code, question_code, graph_code report_code, q_choice_code qc_allowmultipleresponses_code sysdb_qc_allowmultipleresponses Data captured from Question Page UID user_id, plan_code, survey_code, feature_code page_code, question_code, graph_code report_code, q_choice_code qc_allowmorethanoneans_code sysdb_qc_allowmorethanoneans Data captured from Question Page UID, user_id, plan_code survey_code response_code question_code graph_code report_code q_choice_code qc_addcom_code sysdb_qc_addcom Data captured from Question Page UID, user_id, plan_code survey_code response_code question_code graph_code report_code q_choice_code qc_reqans_code sysdb_qc_reqans Data captured from Question Page UID, user_id, plan_code survey_code response_code question_code graph_code report_code q_choice_code qc_ch_layout_code sysdb_qc_ch_layout Data captured from Question Page UID, user_id, plan_code survey_code response_code question_code graph_code report_code q_choice_code qc_randans_code sysdb_qc_randans Data captured from Question Page UID, user_id, plan_code survey_code response_code question_code graph_code report_code q_choice_code qc_en_ques_ab_code sysdb_qc_en_ques_ab Data captured from Question Page UID, user_id, plan_code survey_code response_code question_code graph_code report_code q_choice_code qc_add_rate_lbl_code sysdb_qc_add_rate_lbl Data captured from Question Page UID, user_id, plan_code survey_code response_code question_code graph_code report_code q_choice_code qc_valid_ans_code sysdb_qc_valid_ans Data captured from Question Page UID, user_id, plan_code survey_code response_code question_code graph_code report_code q_choice_code qc_use_weight_code sysdb_qc_use_weight Data captured from Question Page UID, user_id, plan_code survey_code response_code question_code graph_code report_code q_choice_code qc_force_rank_code sysdb_qc_force_rank Data captured from Question Page UID, user_id, plan_code survey_code response_code question_code graph_code report_code q_choice_code qc_adj_slide_scl_code sysdb_qc_adj_slide_scl Data captured from Question Page UID, user_id, plan_code survey_code response_code question_code graph_code report_code q_choice_code qc_only_num_code sysdb_qc_only_num Data captured from Question Page UID user_id, plan_code, survey_code, feature_code page_code, question_code, graph_code report_code, q_choice_code qc_ajd_queslayout_code sysdb_qc_adj_queslayout Data captured from Question Page UID, user_id plan_code survey_code response_code question_code graph_code report_code q_choice_code sysdb_q_choice Data captured from Question Page F A B C
  121. Slide/Page #130 of 141 DATA STRUCTURE, CALCULATIONS & VISUALIZATION DATA

    STRUCTURE, CALCULATIONS & VISUALIZATION Before we start circulating reports and/or start creating charts/graphs, it is important to understand as to what all is needed from the data collected through various mediums? Below we will understand the data structure, calculations and visualization. Data Structure, Calculations & Visualization Remember the surveys circulated will not populate the group results, but an individual result, which would have to be stored in a database. We might possibly need to work with multiple databases to populate result and perform calculations. As an Individual survey, we will receive the data either in absolute numbers or binary (depending on the question type) as elaborated in the below tables. We might also receive the values in the form of text, real numbers and/or date & time. Note: It is important to replace all empty values with 0 (i.e., Zero) Who amongst the below is your favourite teacher? N K Singh R Sharma P Sinha 1 0 0 0 1 0 1 0 0 1 0 0 0 0 1 0 0 1 0 1 0 1 0 0 1 0 0 How would you rate these teachers based on their professional skills? N K Singh R Sharma P Sinha 5 4 1 1 2 3 3 1 4 3 1 5 2 5 3 2 1 4 1 2 3 5 1 2 4 3 1
  122. Slide/Page #131 of 141 Since we'll work on varied question

    types, it is important to understand as to how the data will be stored in database for various question types. It will not be an ideal structure to create multiple databases for each and every question type. Hence, we'll modulate the question type to form a common database structure. Post receiving the responses of individual surveys, we would require further operation to populate calculative results. The surveys circulated will primarily populate the results either in Count or Sum, which can then be expanded for further calculations (i.e., Rate, Mean, Std. Deviation, Coeff of Variation etc.). Hence, all we need is count/sum of three important factors: Count/Sum of options provided in question type Count of questions (if not mandatory) / surveys delivered Count of questions (if not mandatory) / surveys responded While above three are the important factors, sometimes we might also need to calculate the Actual Responses and Possible Responses. PS: It is recommended to get the count of both questions and surveys (delivered & responded). Viz-a-viz, every question options should be made countable. Apart from calculations, it is also important for us to understand the visualization of data before we start complex calculations. We also need to understand this in order to identify as to what visualization is compatible with question type. DATA STRUCTURE, CALCULATIONS & VISUALIZATION DATA STRUCTURE, CALCULATIONS & VISUALIZATION
  123. Slide/Page #132 of 141 The visualization is categorized as following

    and each category contains its own charts/graphs: 1. Comparison 2. Relationship 3. Distribution 4. Composition Each visualization uses the following graphs to visualize the data. 1) Comparison Bar Chart [Horizontal / Vertical] Variable Width Chart Line Chart Circular Area Chart 2) Relationship Scatter Plot Scatter Plot Bubble Size 3) Distribution Bar Histogram Line Histogram 4) Composition Stacked [Bar Chart / 100% Bar Chart] Stacked [Area Chart / 100% Area Chart] Pie Chart Waterfall Chart Tree Map DATA STRUCTURE, CALCULATIONS & VISUALIZATION DATA STRUCTURE, CALCULATIONS & VISUALIZATION
  124. Slide/Page #133 of 141 Remember: Survey System does not use

    all the above graphs to visualize data. Most of the surveys work on Comparison and Composition visualization; however may use Distribution and Relationship. Hence, we will create a system to use these visualizations as per their demand. The next slides show a quick example, as to how we fetch results, modulate data structure, and create visualizations. DATA STRUCTURE, CALCULATIONS & VISUALIZATION DATA STRUCTURE, CALCULATIONS & VISUALIZATION
  125. Slide/Page #134 of 141 Multiple Choice (Single Selection) In the

    above example, we must count the selection made for N K Singh or R Sharma or P Sinha (i.e., options) along with the total number of questions/surveys delivered and responded. This can be expanded as below: Question Options Response Count Surveys Delivered Surveys Responded Who amongst the below is your favourite teacher? N K Singh 35 100 75 Who amongst the below is your favourite teacher? R Sharma 15 100 75 Who amongst the below is your favourite teacher? P Sinha 25 100 75 This can be further expanded by adding two extra columns of calculation in the above table and by calculating the following in each row: Rate of likes to N K Singh = 35 / 75 = 47 % Rate of likes to R Sharma = 15 / 75 = 20 % 100 % of Surveys Responded Rate of likes to P Sinha = 25 / 75 = 33 % Q1: Who amongst the below is your favourite teacher? O N K Singh O R Sharma O P Sinha DATA STRUCTURE, CALCULATIONS & VISUALIZATION DATA STRUCTURE, CALCULATIONS & VISUALIZATION
  126. Slide/Page #135 of 141 47% 20% 33% Who amongst the

    below is your favourite teacher? N K Singh R Sharma P Sinha 47% 20% 33% Who amongst the below is your favourite teacher? N K Singh R Sharma P Sinha And, The Rate of Surveys Responded = 75 / 100 = 75 % » To be added in each row of a new column Please see the below table. Let us see as to what all graphs can be prepared through above data with single selection of a multiple choice question type? Individual Response Rate Doughnut Chart Pie Chart Vertical Bar Graph Horizontal Bar Graph Question Options N K Singh 35 75 100 47% 75% R Sharma 15 75 100 20% 75% P Sinha 25 75 100 33% 75% Individual Response Count Count of Surveys Responded Count of Surveys Delivered Individual Response Rate Survey Response Rate Who amongst the below is your favourite teacher? Who amongst the below is your favourite teacher? Who amongst the below is your favourite teacher? DATA STRUCTURE, CALCULATIONS & VISUALIZATION DATA STRUCTURE, CALCULATIONS & VISUALIZATION N K Singh R Sharma P Sinha 0% 5% 10% 15% 20% 25% 30% 35% 40% 45% 50% 47% 20% 33% Who amongst the below is your favourite teacher? Response Rate N K Singh R Sharma P Sinha 0% 5% 10% 15% 20% 25% 30% 35% 40% 45% 50% 47% 20% 33% Who amongst the below is your favourite teacher? Response Rate
  127. Slide/Page #136 of 141 Individual Response Count Vs. Count of

    Surveys Delivered and/or Responded N K Singh R Sharma P Sinha 0% 5% 10% 15% 20% 25% 30% 35% 40% 45% 50% 47% 20% 33% Who amongst the below is your favourite teacher? Response Rate N K Singh R Sharma P Sinha 0% 5% 10% 15% 20% 25% 30% 35% 40% 45% 50% 47% 20% 33% Who amongst the below is your favourite teacher? Response Rate N K Singh R Sharma P Sinha 0% 50% 47% 20% 33% Who amongst the below is your favourite teacher? Response Rate Area Graph Line Graph Net Graph N K Singh R Sharma P Sinha 0 20 40 60 80 100 120 100 100 100 75 75 75 35 15 25 Who amongst the below is your favourite teacher? (Response Count Vs. Delivered and Responded) Surveys Delivered Surveys Responded Response Count Vertical Bar Graph N K Singh R Sharma P Sinha 0 50 100 150 200 250 100 100 100 75 75 75 35 15 25 Who amongst the below is your favourite teacher? (Response Count Vs. Delivered and Responded) Response Count Surveys Responded Surveys Delivered Vertical Stack Graph N K Singh R Sharma P Sinha 0 20 40 60 80 100 120 100 100 100 75 75 75 35 15 25 Who amongst the below is your favourite teacher? (Response Count Vs. Delivered and Responded) Surveys Delivered Surveys Responded Response Count Horizontal Bar Graph Horizontal Stack Graph N K Singh R Sharma P Sinha 0 50 100 150 200 250 100 100 100 75 75 75 35 15 25 Who amongst the below is your favourite teacher? (Response Count Vs. Delivered and Responded) Response Count Surveys Responded Surveys Delivered DATA STRUCTURE, CALCULATIONS & VISUALIZATION DATA STRUCTURE, CALCULATIONS & VISUALIZATION
  128. Slide/Page #137 of 141 Rate of Surveys Responded Vs. Individual

    Response Rate Doughnut Chart Stack Area Graph Line Graph Column & Line Chart 100 100 100 75 75 75 35 15 25 Who amongst the below is your favourite teacher? (Response Count Vs. Delivered and Responded) N K Singh R Sharma P Sinha N K Singh R Sharma P Sinha 0 50 100 150 200 250 100 100 100 75 75 75 35 15 25 Who amongst the below is your favourite teacher? (Response Count Vs. Delivered and Responded) Response Count Surveys Responded Surveys Delivered N K Singh R Sharma P Sinha 0 20 40 60 80 100 120 100 100 100 75 75 75 35 15 25 Who amongst the below is your favourite teacher? (Response Count Vs. Delivered and Responded) Surveys Delivered Surveys Responded Response Count N K Singh R Sharma P Sinha 0 20 40 60 80 100 120 100 100 100 75 75 75 35 15 25 Who amongst the below is your favourite teacher? (Response Count Vs. Delivered and Responded) Count of Surveys Delivered Count of Surveys Responded Vertical Bar Graph Vertical Stack Graph Horizontal Bar Graph Horizontal Stack Graph N K Singh R Sharma P Sinha 0% 10% 20% 30% 40% 50% 60% 70% 80% 75% 75% 75% 47% 20% 33% Who amongst the below is your favourite teacher? (Rate of Surveys Responded Vs. Individual Response Rate) Survey Response Rate Individual Response Rate N K Singh R Sharma P Sinha 0% 20% 40% 60% 80% 100% 120% 140% 75% 75% 75% 47% 20% 33% Who amongst the below is your favourite teacher? (Rate of Surveys Responded Vs. Individual Response Rate) Survey Response Rate Individual Response Rate N K Singh R Sharma P Sinha 0% 10% 20% 30% 40% 50% 60% 70% 80% 75% 75% 75% 47% 20% 33% Who amongst the below is your favourite teacher? (Rate of Surveys Responded Vs. Individual Response Rate) Survey Response Rate Individual Response Rate N K Singh R Sharma P Sinha 0% 20% 40% 60% 80% 100% 120% 140% 75% 75% 75% 47% 20% 33% Who amongst the below is your favourite teacher? (Rate of Surveys Responded Vs. Individual Response Rate) Survey Response Rate Individual Response Rate DATA STRUCTURE, CALCULATIONS & VISUALIZATION DATA STRUCTURE, CALCULATIONS & VISUALIZATION
  129. Slide/Page #138 of 141 Above are the basic graphs acquired

    through some small calculations of identifying rate of responses (i.e., individual or survey). Let's now move forward to identify some complex calculations based on the data acquired through various mediums. The first one we will talk about Mean (aka, Average). The Mean will be calculated on data with variable inputs rather than a constant input. Hence, to make it simple understand, if a question is made mandatory there is no need to calculate the Mean of Survey Response Rate, as the Mean in that case will be equal to Survey Response Rate of individual data points. Hence in such a scenario we will calculate the Mean of Individual Response Rate. In scenario other than this where the question is not made mandatory, we would have to calculate the mean of both Individual Response Rate and Survey Response Rate. Hence, the best practice would be to calculate the Mean of both Individual Response Rate and Survey Response Rate; however, the visualization will only be done for Mean of data with variable inputs rather than constant inputs. Doughnut Chart Stack Area Graph Line Graph Column & Line Chart 75% 75% 75% 47% 20% 33% Who amongst the below is your favourite teacher? (Rate of Surveys Responded Vs. Individual Response Rate) N K Singh R Sharma P Sinha N K Singh R Sharma P Sinha 0% 20% 40% 60% 80% 100% 120% 140% 75% 75% 75% 47% 20% 33% Who amongst the below is your favourite teacher? (Rate of Surveys Responded Vs. Individual Response Rate) Survey Response Rate Individual Response Rate N K Singh R Sharma P Sinha 0% 10% 20% 30% 40% 50% 60% 70% 80% 75% 75% 75% 47% 20% 33% Who amongst the below is your favourite teacher? (Rate of Surveys Responded Vs. Individual Response Rate) Survey Response Rate Individual Response Rate N K Singh R Sharma P Sinha 0% 10% 20% 30% 40% 50% 60% 70% 80% 0% 10% 20% 30% 40% 50% 60% 70% 80% 75% 75% 75% 47% 20% 33% Who amongst the below is your favourite teacher? (Rate of Surveys Responded Vs. Individual Response Rate) Survey Response Rate Individual Response Rate DATA STRUCTURE, CALCULATIONS & VISUALIZATION DATA STRUCTURE, CALCULATIONS & VISUALIZATION
  130. Slide/Page #139 of 141 While calculating Mean, it is also

    important to calculate the Difference from Mean of the individual data point, as it helps in visualizing the positive/negative differences more clearly. The Mean and Difference from Mean can then be used to visualize average values over a Bar Graphs. Just as you calculate Mean, there are certain pre-build functions in almost all the programming languages to calculate, Std. Deviation, Coefficient of Variance on the individual data points. These calculations, apparently, work on the data collected and the type of presentation required from the data. Hence, can vary for different question types. DATA STRUCTURE, CALCULATIONS & VISUALIZATION DATA STRUCTURE, CALCULATIONS & VISUALIZATION
  131. Slide/Page #140 of 141 Please see the following table to

    understand as to what type of charts/graphs can be used for varied question types. Creating charts/graphs can be made drag & drop for users to easily relate the data points; however, it will be a complex programming. Icon Chart Type Question Type Donut Chart Pie Chart Horizontal or Vertical Bar Graph Closed ended questions with a single answer choice allowed. Not available when a Compare Rule is applied. Closed ended questions with a single answer choice allowed. Not available when a Compare Rule is applied. All closed ended questions. Stacked Horizontal or Vertical Bar Graph All closed ended questions. Line Graph Closed ended questions where depth is set to Distribution. Area Graph Closed ended questions where depth is set to Distribution. Gauge Chart Unique to the NPS questions. DATA STRUCTURE, CALCULATIONS & VISUALIZATION DATA STRUCTURE, CALCULATIONS & VISUALIZATION
  132. Thank YOU Thank YOU In case you stuck at any

    point, please feel free to comment below or write to me at [email protected]