Upgrade to Pro — share decks privately, control downloads, hide ads and more …

Project 01: Improvement in Sales Productivity

Punit Patpatia
February 19, 2019

Project 01: Improvement in Sales Productivity

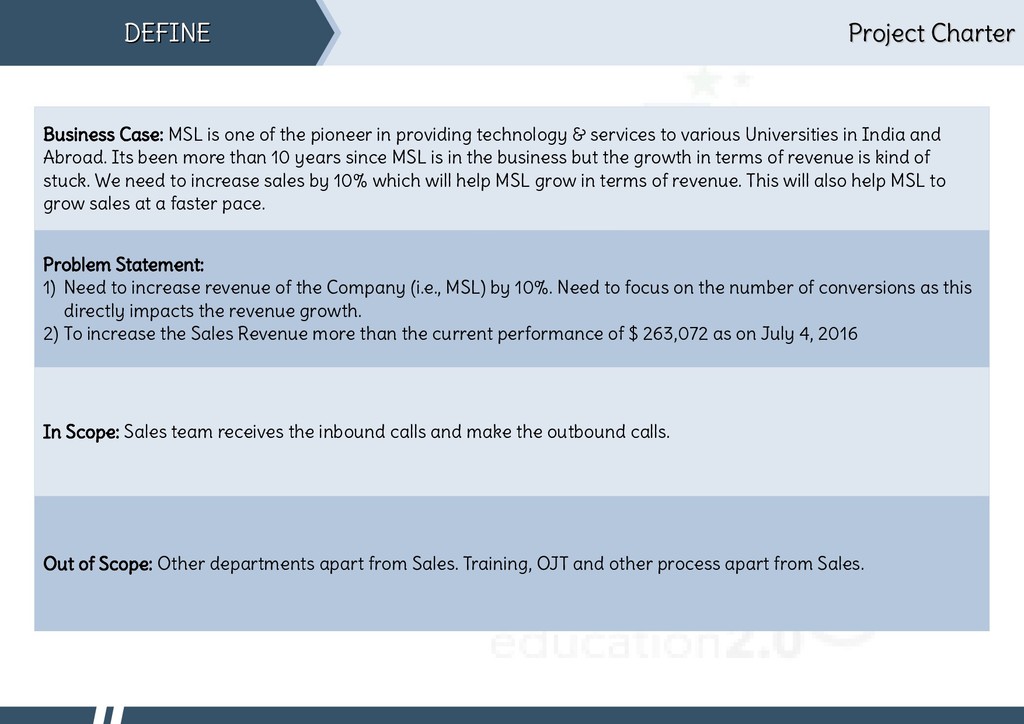
Improvement in Sales Productivity is a full-length DMAIC project for MSL Learning Systems Pvt. Ltd. The Company (a.k.a. MSL) is one of the pioneers in providing technology & services to various Universities in India and abroad. Its been more than 10 years since the Company is in the business but the growth in terms of revenue is kind of stuck. We need to increase sales by 10% which will help the Company grow in terms of revenue. This will also help the Company to grow sales at a faster pace.

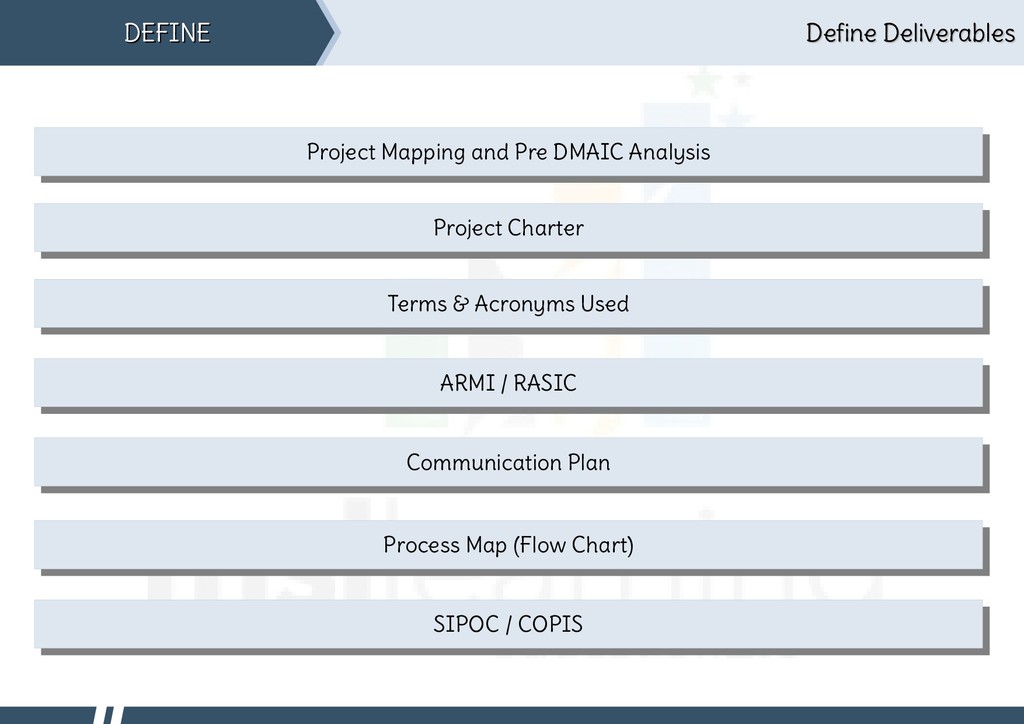
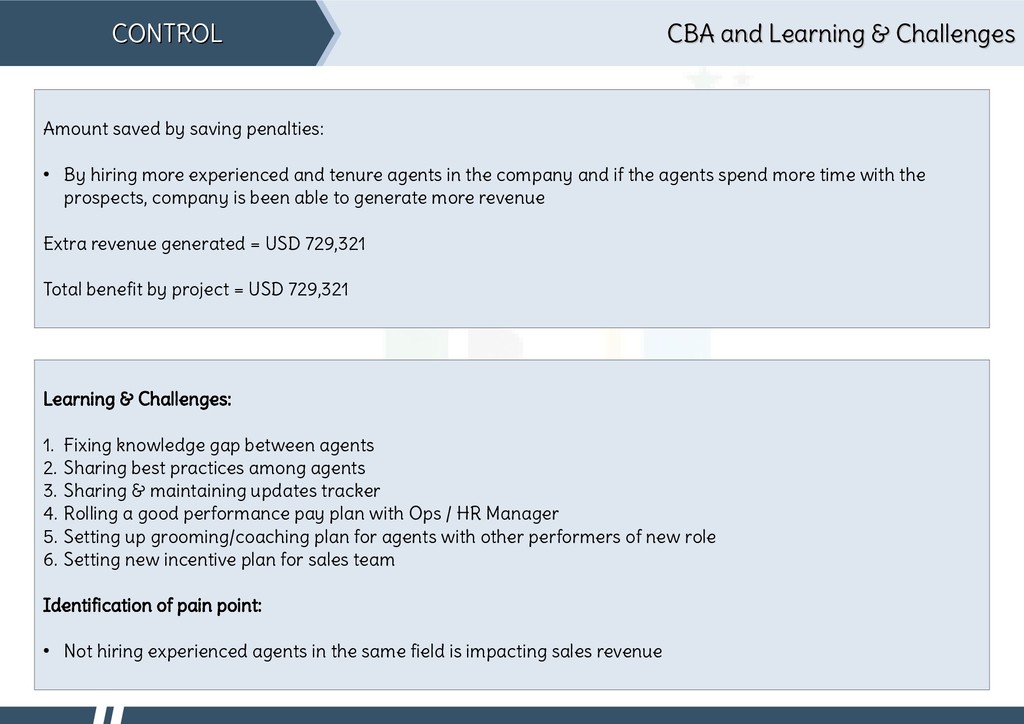
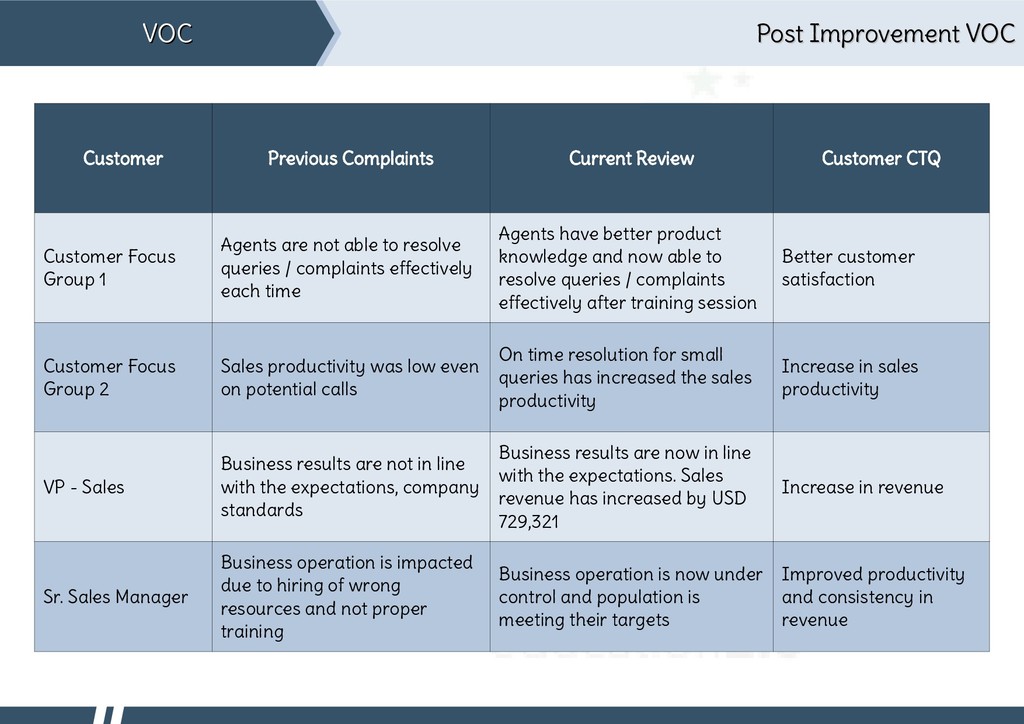
The projects talk about the problem statement, the ways to measure the impact of the problem, analyzing the problem in depth, providing improvement inputs, and putting stringent controls.

Punit Patpatia

February 19, 2019
Tweet

More Decks by Punit Patpatia

Other Decks in Research

Transcript

  1. MSL Learning Systems Pvt. Ltd. MSL Learning Systems Pvt. Ltd.

    Project Project Improvement in Sales Productivity Improvement in Sales Productivity Project Owner Project Owner Punit Patpatia Punit Patpatia Lean Six Sigma Black Belt Lean Six Sigma Black Belt
  2. Define Deliverables Define Deliverables DEFINE DEFINE Project Mapping and Pre

    DMAIC Analysis Project Mapping and Pre DMAIC Analysis Project Charter Project Charter Terms & Acronyms Used Terms & Acronyms Used ARMI / RASIC ARMI / RASIC Communication Plan Communication Plan Process Map (Flow Chart) Process Map (Flow Chart) SIPOC / COPIS SIPOC / COPIS
  3. Project Mapping Project Mapping DEFINE DEFINE Customer Comments Key Output

    Characteristics Important to Customer (CTQ’s) Raunak Singh Ahluwalia (CEO) The objective is to maximize sales in terms of revenue, keeping quality in adherence. • Need to improve sales by 10% • Quality Mumtaz Begum (VP - Sales) I am looking forward to improve sales by 10%. This project will lead to increasing the productivity / efficiency / agent / utilization / FCR. • Improvement in productivity • FCR • Agent Utilization Sr. Sales Manager Sales revenue need to be increased as it’s lower than process capability • Increasing Sales Revenue
  4. Data/Graphical Summary Data/Graphical Summary DEFINE DEFINE Summary of Revenue by

    Agent ($) Anderson-Darling Normality Test A-Squared 3.22 P-Value < 0.005 6000 9000 12000 15000 18000 21000 24000 95% Confidence Intervals 11000 11500 12000 12500 13000 Mean Median Mean 12193 StDev 4480 Variance 20074312 Skewness 0.14563 Kurtosis -1.02496 N 300 Minimum 5178 1st Quartile 8342 Median 12013 3rd Quartile 15864 Maximum 25000 95% Confidence Interval for Mean 11684 12702 95% Confidence Interval for Median 11213 12896 95% Confidence Interval for StDev 4148 4871
  5. Project Charter Project Charter DEFINE DEFINE Business Case: MSL is

    one of the pioneer in providing technology & services to various Universities in India and Abroad. Its been more than 10 years since MSL is in the business but the growth in terms of revenue is kind of stuck. We need to increase sales by 10% which will help MSL grow in terms of revenue. This will also help MSL to grow sales at a faster pace. Problem Statement: 1) Need to increase revenue of the Company (i.e., MSL) by 10%. Need to focus on the number of conversions as this directly impacts the revenue growth. 2) To increase the Sales Revenue more than the current performance of $ 263,072 as on July 4, 2016 In Scope: Sales team receives the inbound calls and make the outbound calls. Out of Scope: Other departments apart from Sales. Training, OJT and other process apart from Sales.
  6. Graphical Summary Graphical Summary DEFINE DEFINE Months Month 1 Month

    2 Month 3 Month 4 Month 5 Weeks Week 1 Week 2 Week 3 Week 4 Week 5 Week 6 Week 7 Week 8 Week 9 Week 10 Week 11 Week 12 Week 13 Week 14 Week 15 Week 16 Week 17 Week 18 Week 19 Week 20 Week 21 Dates 11-Jul-16 18-Jul-16 25-Jul-16 1-Aug-16 8-Aug-16 15-Aug-16 22-Aug-16 29-Aug-16 5-Sep-16 12-Sep-16 19-Sep-16 26-Sep-16 3-Oct-16 10-Oct-16 17-Oct-16 24-Oct-16 31-Oct-16 7-Nov-16 14-Nov-16 21-Nov-16 28-Nov-16 Define M1 Measure M2 Analyse M3 Improve M4 Control M5 M1 Close Define Phase M2 Close Measure Phase M3 Close Analyse Phase M4 Close Improve Phase M5 Close Control Phase
  7. Terms & Acronyms Used Terms & Acronyms Used DEFINE DEFINE

    Indicators Definition Sales Converting a prospect to a University student Follow-ups Making outbound calls to the leads even if no $ revenue is generated Team Leader Name of the team leaders who are handling sales Trainer Name of the trainer responsible for conducting trainings & OJT FCR Giving First Call Resolution to prospects Quality Following the set parameters defined by the Quality AHT Average Handling Time Sales Process Defined Sales Process & Guidelines HR Human Resource team responsible for hiring agents Marketing Marketing team responsible for leads generation ACW After Call Work MSL MSL Learning Systems Pvt. Ltd. (a.k.a. the Company)
  8. ARMI ARMI Approver | Resource | Member | Interested Party

    Approver | Resource | Member | Interested Party DEFINE DEFINE Key Stakeholders Define Measure Analyse Improve Control Raunak Singh Ahluwalia (CEO) I I I I I Mumtaz Begum (VP - Sales) I & A I & A I I I Sr. Sales Manager I & R I I I I BB R & M R & M R & M A A Manager & Other Stakeholders I & M I & M I M M When populating the stakeholders, consider the ARMI A = Approver of the team decisions R = Resource / Subject Matter Expert M = Member of the team I = Interested Party who is needed to be kept informed
  9. RASIC RASIC Responsible | Approve | Support | Inform |

    Consult Responsible | Approve | Support | Inform | Consult DEFINE DEFINE RASIC Chart for Define & Measure Activities CEO VP SME Black Belt MIS Team Pre DMAIC Collect VOC from all Stakeholders - I I S S I S R I Conduct Stakeholder Analysis - I I A, I & C S I I R I & S Collect data from the last 12 months - - - R S & C - - S R Analysis of data - I I C & I S - - R - Report out on the Pre DMAIC analysis - I I A & C I - - R - Define Create Project Charter - I A R I - - S - Send Charter for executive approval - - - R I - - S - Approve Charter - R R I I - - I - Build SIPOC - - - R R - - C - Build Process Map - - - R R - - C & S - Measure Build Data Collection Plan - - - - I - - R - Get the DCP approve - - - - - - - R - Approve DCP - - - I I - - I - Collect data - - - I I - - R S Validate data - - - I I - - R S Publish next step to stakeholders - I I I & S I & S I I R - Team Member Sr. Sales Manager Quality Team Training Manager R A S I C Responsible: Solely & directly responsible of the activity (owner) – includes approving authority (A) Approve: Reviews & assures that the activity is being done as per expectations Support: Provides the help & support to the owner Inform: Is to be kept informed of the status/progress being made Consult: Is to be consulted for this activity for inputs
  10. Communication Plan Communication Plan DEFINE DEFINE Message Audience Media Who

    When Project Charter Key Stakeholders, Team Members Email Project Leader July 11, 2016 Team Meeting All Team Members Email Project Leader Every Week Project Progress All Team Members & Stakeholders Email Project Leader End of each phase Toll Gate Review Approvers Email, Official Reviews Project Leader End of each phase Technology Changes Technology Team, Approvers & Stakeholders Email, Discussion Project Leader As & when discovered Process Changes Key Stakeholders Email, Training Project Leader As & when discovered
  11. COPIS / SIPOC COPIS / SIPOC DEFINE DEFINE Customer Output

    Process Input Supplier Prospect’s on boarding Sale Confirmed Prospect being called basis interest Required details confirmed Prospect Qualification Confirmed Counselling of courses basis qualification Information of fee basis interest Prospect fills an online application form & upload the documents Application Confirmed Application sent for review & approval
  12. Basic Process Map Basic Process Map DEFINE DEFINE Start Calling

    Leads Received Call Prospect Confirm Interest Is Interested? Help with Online Application Application Confirmed Application Reviewed & Approved On boarding Stop Yes No
  13. Measure Deliverables Measure Deliverables MEASURE MEASURE Data Collection Plan Data

    Collection Plan Measurement System Analysis Measurement System Analysis Process Capability Process Capability
  14. Data Collection Plan Data Collection Plan MEASURE MEASURE Y Operational

    Definition Defect Definition Performance Standard Opportunity Sales productivity Monthly Mode of collecting data Specification Limit LSL/USL Improvement in sales productivity It is the dollar ($) value of the total revenue gained per calendar month by MSL Sales performance is 60% at the moment 60% is LSL USL is NA Y Data Type Unit of Measurement Decimal Places Database Container Discrete 2 decimal places Excel Yes N/A Already started Existing / New Database If new, when would the database be ready Planned Start Date for Data Collection Improvement in sales productivity in monthly target Total sales done per day, week, month for all the teams Data Items Needed Formula to be Used Responsibility Training Need Operator Information Equipment Used for Measurement Equipment Calibration Info
  15. Process Capability Process Capability MEASURE MEASURE Process Capability of Revenue

    by Agent ($) Using Box-Cox Transformation With Lambda = 0.5 Transformed Data 60 75 90 105 120 135 150 LSL Potential (Within) Capability Z.Bench 1.75 Z.LSL 1.75 Z.USL * Cpk 0.58 Overall Capability Z.Bench 1.81 Z.LSL 1.81 Z.USL * Ppk 0.60 Cpm * Within Overall Process Data LSL 5000 Target * USL * Sample Mean 12192.8 Sample N 300 StDev(Within) 4640.01 StDev(Overall) 4480.44 After Transformation LSL* 70.7107 Target* * USL* * Sample Mean* 108.451 StDev(Within)* 21.5654 StDev(Overall)* 20.8017 Observed Performance PPM < LSL 0.00 PPM > USL * PPM Total 0.00 Exp. Within Performance PPM < LSL* 40056.75 PPM > USL* * PPM Total 40056.75 Exp. Overall Performance PPM < LSL* 34817.42 PPM > USL* * PPM Total 34817.42 Zlt is 1.75, hence Zst is 1.75+1.5 = 3.25
  16. Analyse Deliverables Analyse Deliverables ANALYZE ANALYZE Identify Potential Factors Identify

    Potential Factors Fishbone Fishbone DCP for Potential Factors DCP for Potential Factors Basic Analysis for Project Y Basic Analysis for Project Y Checking for Impact of Factors on Y Checking for Impact of Factors on Y Hypothesis Summary Hypothesis Summary MSA Results of Impacting Factors MSA Results of Impacting Factors
  17. Cause & Effect Diagram Cause & Effect Diagram ANALYZE ANALYZE

    Increasing Sales Productivity Sales Process Price Agent Productivity System/Software External Factors Customer Requirement Process Complexity FCR Documentation Duplicate Leads High Program Cost Easy Instalments Refund Policy Refund TAT Process Knowledge Communication Skills Agent Tenure Total Revenue Generated Bonus/Incentive Scholarship Skilled Courses CSAT AHT Promotions Total Calls Taken Complex Design Multiple Applications Calendar Integration For Follow-ups
  18. DCP for Potential Xs DCP for Potential Xs ANALYZE ANALYZE

    Potential Cause Ops Definition Type of Data Collection Method Test to be Used Visualization Plot Used FCR First Call Resolution Discrete MIS Team Mann Whitney/ 2 Variance Box Plot Process Complexity Process which is being followed is complex due to various integrations for fetching data from different places and documentation on external sheets Discrete Sales Manual 1 Way ANOVA/ Moods Median Box Plot/Interval Plot Promotions Promotional Discounts & Offers Discrete MIS Team Mann Whitney/ 2 Variance Box Plot/Interval Plot Customer Experience Experience of the customer to gauge satisfaction Discrete (Ordinal) MIS Team Mann Whitney/ 2 Variance Box Plot/Interval Plot AHT Average Handling Time Continuous MIS Team Correlation & Regression Scatter Plot Agent Tenure Agent Total Work Experience Continuous MIS Team Correlation & Regression Scatter Plot Agent Satisfaction Agents Job Satisfaction Discrete HR Team Survey Mann Whitney/ 2 Variance Box Plot/Interval Plot Total Calls Taken Total Number of Calls taken per Agent per Month Continuous MIS Team Correlation & Regression Scatter Plot
  19. Big Data Analysis for Project Y Big Data Analysis for

    Project Y ANALYZE ANALYZE Run Chart of Revenue by Agent ($) Number of runs about median: 154 Expected number of runs: 151.0 Longest run about median: 8 Approx P-Value for Clustering: 0.636 Approx P-Value for Mixtures: 0.364 1 20 40 60 80 100 120 140 160 180 200 220 240 260 280 300 5000 10000 15000 20000 25000 Revenue by Agent ($) Observation Number of runs up or down: 216 Expected number of runs: 199.7 Longest run up or down: 5 Approx P-Value for Trends: 0.968 Approx P-Value for Oscillations: 0.012 Randomness Study Probability Plot of Revenue by Agent ($) Mean 12193 StDev 4480 N 300 AD 3.218 P-Value <0.005 5000 10000 15000 20000 25000 Percent Revenue by Agent ($) 0.1 5 10 20 30 40 50 60 70 80 90 95 99 97 99.9 Normal Normality Study Randomness & Shape Study
  20. Big Data Analysis for Project Y Big Data Analysis for

    Project Y ANALYZE ANALYZE Spread Study Central Tendency Study Spread & Central Tendency Study Histogram of Revenue by Agents ($) Mean 12193 StDev 4480 N 300 Frequency Revenue by Agent ($) Normal 6000 9000 12000 15000 18000 21000 24000 Boxplot of Revenue by Agent ($) 5000 10000 15000 20000 25000 R evenue by A gent ($)
  21. Checking for Impact of AHT on Y Checking for Impact

    of AHT on Y ANALYZE ANALYZE Graphical Depiction Hypothesis Result Statistical Interpretation of Relationship Scatterplot of Revenue by Agents ($) vs AHT 5000 10000 15000 20000 25000 Revenue by Agent ($) 0 200 400 600 800 1000 1200 1400 1600 1800 AHT Interface: Here P value is 0, i.e., smaller than 0.05; hence hA is true and AHT is impacting the revenue. Regression Analysis: Revenue by Agent ($) versus AHT The regression equation is Revenue by Agents ($) = 10463 + 3.19 AHT Predictor Coef SE Coef T P Constant 10463.5 413.6 25.30 0.000 AHT 3.1860 0.6097 5.23 0.000 S = 4295.47 R-Sq = 8.4% R-Sq(adj) = 8.1% Analysis of Variance Source DF SS MS F P Regression 1 503804718 503804718 27.30 0.000 Residual Error 298 5498414542 18451056 Total 299 6002219260 Unusual Observations AHT Residual Plots for Revenue by Agents ($)
  22. Checking for Impact of TOS on Y Checking for Impact

    of TOS on Y ANALYZE ANALYZE Graphical Depiction Hypothesis Result Statistical Interpretation of Relationship Interface: Here P value is 0.50, i.e., greater than 0.05; hence H0 is true, henceforth no impact of TOS on Sales Productivity. TOS: Time on System Regression Analysis: Revenue by Agent ($) versus TOS The regression equation is Revenue by Agents ($) = 16313 – 24.2 TOS Predictor Coef SE Coef T P Constant 16313 6173 2.64 0.009 TOS -24.19 36.20 -0.67 0.505 S = 4484.59 R-Sq = 0.1% R-Sq(adj) = 0.0% Analysis of Variance Source DF SS MS F P Regression 1 8975671 8975671 0.45 0.505 Residual Error 298 5993243589 20111556 Total 299 6002219260 Revenue by Obs TOS Agent ($) Fit SE Fit Residual St Resid R denotes an observation with a large standardized residual. X denotes an observation whose X value gives it large leverage. Residual Plots for Revenue by Agents ($) Scatterplot of Revenue by Agents ($) vs TOS 5000 10000 15000 20000 25000 Revenue by Agent ($) 160 170 180 190 200 TOS
  23. Checking for Impact of Age on Y Checking for Impact

    of Age on Y ANALYZE ANALYZE Graphical Depiction Hypothesis Result Statistical Interpretation of Relationship Interface: Here P value is 0.297, i.e., greater than 0.05; hence Age is not impacting Sales Productivity. Scatterplot of Revenue by Agents ($) vs Age 5000 10000 15000 20000 25000 Revenue by Agent ($) 21 22 23 24 25 Age 26 27 28 Regression Analysis: Revenue by Agent ($) versus Age The regression equation is Revenue by Agents ($) = 14992 – 120 Age Predictor Coef SE Coef T P Constant 14992 2691 5.57 0.000 Age -120.1 114.9 -1.05 0.297 S = 4479.74 R-Sq = 0.4% R-Sq(adj) = 0.0% Analysis of Variance Source DF SS MS F P Regression 1 21926119 21926119 1.09 0.297 Residual Error 298 5980293141 20068098 Total 299 6002219260 R denotes an observation with a large standardized residual. Residual Plots for Revenue by Agents ($)
  24. Checking for Impact of Typing Speed on Y Checking for

    Impact of Typing Speed on Y ANALYZE ANALYZE Graphical Depiction Hypothesis Result Statistical Interpretation of Relationship Interface: Here P value is 0.239, i.e., Pv value is greater than 0.05; hence Typing Speed has no significant impact on Sales Productivity. Scatterplot of Revenue by Agents ($) vs Typing Speed 5000 10000 15000 20000 25000 Revenue by Agent ($) 20 30 40 Typing Speed 50 60 Regression Analysis: Revenue by Agent ($) versus Typing Speed The regression equation is Revenue by Agents ($) = 13515 – 42.3 Typing Speed Predictor Coef SE Coef T P Constant 13515 1150 11.75 0.000 Typing Speed -42.29 35.83 -1.18 0.239 S = 4477.49 R-Sq = 0.5% R-Sq(adj) = 0.1% Analysis of Variance Source DF SS MS F P Regression 1 27928852 27928852 1.39 0.239 Residual Error 298 5974290408 20047954 Total 299 6002219260 Unusual Observations X denotes an observation whose X value gives it large leverage. Residual Plots for Revenue by Agents ($)
  25. Checking for Impact of Total Calls Taken on Y Checking

    for Impact of Total Calls Taken on Y ANALYZE ANALYZE Graphical Depiction Hypothesis Result Statistical Interpretation of Relationship Interface: Here P value is 0.538, i.e., greater than 0.05; hence H0 is true, henceforth, total calls does not impact Sales Productivity. Scatterplot of Revenue by Agents ($) vs Total Calls 5000 10000 15000 20000 25000 Revenue by Agent ($) 600 700 800 Total Calls 900 1000 Regression Analysis: Revenue by Agent ($) versus Total Calls The regression equation is Revenue by Agents ($) = 11125 – 1.34 Total Calls Predictor Coef SE Coef T P Constant 11125 1750 6.36 0.000 Total Calls 1.341 2.174 0.62 0.538 S = 4485.08 R-Sq = 0.1% R-Sq(adj) = 0.0% Analysis of Variance Source DF SS MS F P Regression 1 7659164 7659164 0.38 0.538 Residual Error 298 5994560097 20115973 Total 299 6002219260 Unusual Observations R denotes an observation with a large standardized residual. Residual Plots for Revenue by Agents ($)
  26. Checking for Impact of FCR on Y Checking for Impact

    of FCR on Y ANALYZE ANALYZE Graphical Depiction Hypothesis Result Statistical Interpretation of Relationship Interface: Here P value is 0.750, i.e., greater than 0.05; hence H0 is true, henceforth, FCR does not make significant impact on Sales Productivity. Scatterplot of Revenue by Agents ($) vs FCR 5000 10000 15000 20000 25000 Revenue by Agent ($) 0.0 0.2 0.4 FCR 0.6 1.0 0.8 Regression Analysis: Revenue by Agent ($) versus FCR The regression equation is Revenue by Agents ($) = 12296 – 169 FCR Predictor Coef SE Coef T P Constant 12295.7 413.1 29.77 0.000 FCR -169.5 530.3 -0.32 0.750 S = 4487.18 R-Sq = 0.0% R-Sq(adj) = 0.0% Analysis of Variance Source DF SS MS F P Regression 1 2056005 2056005 0.10 0.750 Residual Error 298 6000163256 20134776 Total 299 6002219260 Unusual Observations R denotes an observation with a large standardized residual. Residual Plots for Revenue by Agents ($)
  27. Checking for Impact of Agent Tenure on Y Checking for

    Impact of Agent Tenure on Y ANALYZE ANALYZE Graphical Depiction Hypothesis Result Statistical Interpretation of Relationship Interface: Here P value is 0.00, i.e., less than 0.05; hence hA is true, henceforth, Agent Tenure is making significant impact on Sales Productivity. Scatterplot of Revenue by Agents ($) vs Agent Tenure 5000 10000 15000 20000 25000 Revenue by Agent ($) 0 Agent Tenure 1 2 3 4 5 6 7 8 9 Regression Analysis: Revenue by Agent ($) versus Agent Tenure The regression equation is Revenue by Agents ($) = 8465 + 748 Agent Tenure Predictor Coef SE Coef T P Constant 8465.4 510.0 16.60 0.000 Agent Tenure 747.98 90.94 8.23 0.000 S = 4051.56 R-Sq = 18.5% R-Sq(adj) = 18.2% Analysis of Variance Source DF SS MS F P Regression 1 1110505285 1110505285 67.65 0.000 Residual Error 298 4891713975 16415148 Total 299 6002219260 Unusual Observations R denotes an observation with a large standardized residual. Residual Plots for Revenue by Agents ($)
  28. Checking for Impact of Agent Knowledge on Y Checking for

    Impact of Agent Knowledge on Y ANALYZE ANALYZE Graphical Depiction Hypothesis Result Statistical Interpretation of Relationship Interface: Here P value is 0.613, i.e., greater than 0.05; hence H0 is true, henceforth, Agent Knowledge is not making significant impact on Sales Productivity. Scatterplot of Revenue by Agents ($) vs Agent Knowledge 5000 10000 15000 20000 25000 Revenue by Agent ($) Agent Knowledge 70 75 80 85 100 90 95 Regression Analysis: Revenue by Agent ($) versus Agent Knowledge The regression equation is Revenue by Agents ($) = 13407 – 14.4 Agent Knowledge Predictor Coef SE Coef T P Constant 13407 2411 5.56 0.000 Agent Knowledge -14.41 28.44 -0.51 0.613 S = 4486.02 R-Sq = 0.1% R-Sq(adj) = 0.0% Analysis of Variance Source DF SS MS F P Regression 1 5165087 5165087 0.26 0.613 Residual Error 298 5997054173 20124343 Total 299 6002219260 Unusual Observations R denotes an observation with a large standardized residual. Residual Plots for Revenue by Agents ($)
  29. Checking for Impact of Gender on Y Checking for Impact

    of Gender on Y ANALYZE ANALYZE Graphical Depiction Hypothesis Result Statistical Interpretation of Relationship Interface: Here P value is 0.585, i.e., greater than 0.05; hence H0 is true, henceforth, Gender has no significant impact on Sales Productivity. Boxplot of Revenue by Agents ($) 5000 10000 15000 20000 25000 Revenue by Agent ($) Gender Female Male Mann-Whitney Test and CI: Revenue by Agent, Revenue by Agent N Median Revenue by Agents ($)_Female 134 12376 Revenue by Agents ($)_Male 166 11359 Point estimate for ETA1-ETA2 is 248 95.0 Percent CI for ETA1-ETA2 is (-689,1360) W = 20575.0 Test of ETA1 = ETA2 vs ETA1 not = ETA2 is significant at 0.5854 The test is significant at 0.5854 (adjusted for ties)
  30. Checking for Impact of Shifts on Y Checking for Impact

    of Shifts on Y ANALYZE ANALYZE Graphical Depiction Hypothesis Result Statistical Interpretation of Relationship Interface: Here P value is 0.143, i.e., greater than 0.05; hence H0 is true, henceforth, Shifts has no significant impact on Sales Productivity. Boxplot of Revenue by Agents ($) 5000 10000 15000 20000 25000 Revenue by Agent ($) Shifts Afternoon Night Evening Morning Mood Median Test: Revenue by Agent ($) versus Shift Mood median test for Revenue by Agent ($) Chi-Square = 5.42 DF = 3 P = 0.143 Individual 95.0% CIs Shift N<= N> Median Q3-Q1 -+---------+----------+---------+------- Afternoon 36 38 12485 6402 (--------*-----------) Evening 40 24 11123 6980 (---------------*------) Morning 41 46 12511 7621 (-------------*---------) Night 33 42 12426 8117 (-------------*---------) -+------------+------------+-------------+------- 9000 10500 12000 13500 Overall median = 12013
  31. Checking for Impact of Marital Status on Y Checking for

    Impact of Marital Status on Y ANALYZE ANALYZE Graphical Depiction Hypothesis Result Statistical Interpretation of Relationship Interface: Here P value is 0.4927, i.e., greater than 0.05; hence H0 is true, henceforth, Marital Status has no significant impact on Sales Productivity. Boxplot of Revenue by Agents ($) 5000 10000 15000 20000 25000 Revenue by Agent ($) Marital Status Married Unmarried Mann-Whitney Test and CI: Revenue by Agent, Revenue by Agent N Median Revenue by Agents ($)_Married 33 11519 Revenue by Agents ($)_Unmarried 267 12100 Point estimate for ETA1-ETA2 is -509 95.0 Percent CI for ETA1-ETA2 is (-2276,1066) W = 4643.5 Test of ETA1 = ETA2 vs ETA1 not = ETA2 is significant at 0.4927 The test is significant at 0.4927 (adjusted for ties)
  32. Hypothesis Summary Hypothesis Summary ANALYZE ANALYZE Summary of Impacting Factors

    S.N. Factor p-Value Graphical Tool Used Inference Next Step 1 AHT 0.000 Scatter Plot Impacting 2 TOS 0.500 Scatter Plot Not Impacting 3 Age 0.297 Scatter Plot Not Impacting 4 Typing Speed 0.239 Scatter Plot Not Impacting 5 Total Calls Taken 0.538 Scatter Plot Not Impacting 6 FCR 0.750 Scatter Plot Not Impacting 7 Age Tenure 0.000 Scatter Plot Impacting 8 Agent Knowledge 0.613 Scatter Plot Not Impacting 9 Gender 0.585 Box Plot Not Impacting 10 Shifts 0.143 Box Plot Not Impacting 11 Marital Status 0.493 Box Plot Not Impacting
  33. Improve Deliverable Improve Deliverable IMPROVE IMPROVE Screening of the Impacting

    Factors Screening of the Impacting Factors Action Plan for Improving the Factors Action Plan for Improving the Factors Basic Analysis of Improved Y Basic Analysis of Improved Y Pre-Post Analysis of Project Y Pre-Post Analysis of Project Y Pre-Post Analysis of Factor(s) Pre-Post Analysis of Factor(s) Improve Summary – Take Away Improve Summary – Take Away
  34. Improve Summary – Take Away Improve Summary – Take Away

    IMPROVE IMPROVE FACTOR SALES PRODUCTIVITY Experience of Agents Handling Time Process Knowledge Communication Skills References Willingness Pricing Follow-up Required Contributors
  35. Root Cause – Sales Productivity – Experience of Agents Root

    Cause – Sales Productivity – Experience of Agents IMPROVE IMPROVE Driver Recommendations Hiring experience agents in the same field • Hiring people who have similar experience will help • HR should hire only experience people to mitigate the impact on sales • The last round of hiring should be taken by the Sr. Sales Manager to check the experience before hiring a sales associate • Draw a transfer function of productivity and typing speed to see what is beneficial from a hiring decision perspective • If the transfer function can be made useful in hiring decision, update the same • Building an elite sales team Process Knowledge Check • PKT be designed on 60:20:20 (Process:Sub-Process:Skills) • There should be a PKT check weekly through tests There can be sessions held frequently to enhance the process knowledge of agents Skill Issues • We can conduct a ESAT survey as far as the skills are concerned • Root Cause Analysis of the core areas and then organize trainings accordingly • Process Automation • Live barging of calls of agents Training Sessions • Involving training team in a regular training weekly activity • Training sessions of agents before they are live on floor • Process Knowledge check in training before agents come on floor • Pre OJT training required for agents who come on floor • Agents should go through a process knowledge test in the end of training period • Mock test of agents should be conducted by training Typing test missing at the time of hiring • Typing test to be mandatory part of hiring • Typing test scores to be published to Ops deptt. at the time of final interview
  36. Improve Summary – Take Away Improve Summary – Take Away

    IMPROVE IMPROVE FACTOR SALES PRODUCTIVITY Experience of Agents Handling Time Process Knowledge Communication Skills References Willingness Pricing Follow-up Required Contributors
  37. Root Cause – Sales Productivity – Handling Time Root Cause

    – Sales Productivity – Handling Time IMPROVE IMPROVE Driver Recommendations Complicated cases • Look at the possibilities of allocating complicated cases to the specializes teams / Subject Matter Experts • Best practice sharing Dependency on upstream process • Pro-active availability of information from upstream • Best practices sharing • Automation possibilities • VSM to be done • DOA to be simplified Driven by statutory or regulation needs • Look for process automation Rare scenario • Find out the proportion of cases for such scenario • Decide an action plan for the same • Look for the possibility of assigning rare scenario to specialized team • Best practice sharing Lack of SOP • All new process updates to have a mandatory SOP • Train people on the updates • Effectiveness of training to be verified • SOP to be created and updated • Best practice sharing ACW for legacy cases • Bucket old calls basis ageing • Allocate to specialized teams • FCT/FTR to be promoted
  38. Root Cause – Sales Productivity – Handling Time Root Cause

    – Sales Productivity – Handling Time IMPROVE IMPROVE Driver Recommendations Lack of knowledge of shortcuts • Training of shortcuts to be conducted on defined periodicity • To be included in the training plan of new hires • Shortcut keys to be displayed on wallpaper of system and may be pasted on the agent workstation CRM not user friendly • Simplification of input provisioning • Look at streamlining business processes for handshakes and input provisioning prespective • VSM may be needed Cumbersome process • Look at fixes on DOA, decision making, CRM friendliness • Look at automation opportunities by implementing rule based steps • VSM • Creation of specialized help desk could help
  39. Improve Summary – Take Away Improve Summary – Take Away

    IMPROVE IMPROVE FACTOR SALES PRODUCTIVITY Experience of Agents Handling Time Process Knowledge Communication Skills References Willingness Pricing Follow-up Required Contributors
  40. Root Cause – Sales Productivity – Process Knowledge Root Cause

    – Sales Productivity – Process Knowledge IMPROVE IMPROVE Driver Recommendations Process Knowledge • All process updates to mandatory have DTP published • Train people on the process • Effectiveness of training to be verified • Refresher training session to be arranged • Conduct PKT on the defined frequency • Introduce R&R for better scores Lack of FCR • Process knowledge to be enhanced • DOA Alignment • Reference sheet to be made • Instant SME Support • Incentivise the FCR • Issue Charter (Every issue type to have a defined TAT of resolution) • Proactive provisioning • Automation of input provisioning • Self help toolkit to be put in place Training • Seek assistance from training team and SMEs • Create update tracker • Calibration on updates • Client update sharing process to necessitate inclusion of training team reps • Traceability doc for update and its inclusion in training manual Training process not inclusive of live scenarios • Training Manager and SME Calibration • Client and Training Manager Calibration Evaluation not done as part of training • Create training evaluation dashboard for each training type • Mandate publishing of dashboard • Evaluation score mandatory input for appraisal & go live decisions
  41. Root Cause – Sales Productivity – Root Cause – Sales

    Productivity – Process Knowledge Process Knowledge IMPROVE IMPROVE Driver Recommendations Shift hurdles • Pre-shift and post-shift hurdles to be taken for every team before and after their shifts • All updates and if agents have any process related doubts need to be clarified Ability issue of the trainer • Due Diligence at the time of hiring • Knowledge and delivery test prior to assignment of duties • Training assessment process to continually improve • Send trainer for refresher training and calibrate with SME and Client Knowledge Check • Weekly knowledge check to be conducted for every agent on floor • Calls to be monitored by every team for quality and their knowledge checks • Live barging with agents can help to know their process understanding Effectiveness of Process Training • Establish rule/result based KPIs Lack of Process Training • Send trainer for refresher training and calibrate with SME and Client
  42. Improve Summary – Take Away Improve Summary – Take Away

    IMPROVE IMPROVE FACTOR SALES PRODUCTIVITY Experience of Agents Handling Time Process Knowledge Communication Skills References Willingness Pricing Follow-up Required Contributors
  43. Root Cause – Sales Productivity – Communication Skills Root Cause

    – Sales Productivity – Communication Skills IMPROVE IMPROVE Driver Recommendations Voice and Accent Training • Voice and Accent training sessions to be conducted after process knowledge is strated • Before hiring, the HR should check if the agents are aware of phonetics and can pronounce certain process related words well • HR should make sure that the new hires have neutral accent • HR should also check their rate of speech Poor Customer Service • Soft skills training to be provided • Refer FCR fixes • Refer process knowledge fixes • Refer proactive provisioning fixes • Refer technology fixes • Refer comprehension fixes • Refer deliberate fixes Mock Calls • Mock call sessions to be conducted to make the agents familiar about the way they need to speak • Live barging session with the agents to check their understandability • Agents should be made familiar in mock call about the common process related words and their pronunciation Active listening • Agent should be a good and active listener on calls Wrong commitment made • Soft skills training to be provided • Refer FCR fixes • Refer process knowledge fixes • Refer proactive provisioning fixes • Refer technology fixes • Refer comprehension fixes • Refer deliberate fixes
  44. Improve Summary – Take Away Improve Summary – Take Away

    IMPROVE IMPROVE FACTOR SALES PRODUCTIVITY Experience of Agents Handling Time Process Knowledge Communication Skills References Willingness Pricing Follow-up Required Contributors
  45. Root Cause – Sales Productivity – References Root Cause –

    Sales Productivity – References IMPROVE IMPROVE Driver Recommendations Pre and Post Sales Service • Good pre and post sales service needed to increase references Good Customer Service • Soft skills training to be provided • Refer FCR fixes • Refer process knowledge fixes • Refer proactive provisioning fixes • Refer Technology fixes • Refer comprehension fixes • Refer deliberate fixes TAT • TAT of application review and approval should be low • TAT of refunds to be lower by 30 days from the current 60 days CSAT Survey • Sales survey for CSAT needs to be conducted frequently • Controllable areas of concerns should be worked upon • All complains should be analyzed in order to increase the CSAT Promotions for existing students • Special promotional offers for existing students to increase sales • 20% cash back in students wallet, soon as a their reference joins a program • Option to add small amount in their wallet every month, that can be used in lump-sum to pay their semester fee • Certain discount coupon codes
  46. Improve Summary – Take Away Improve Summary – Take Away

    IMPROVE IMPROVE FACTOR SALES PRODUCTIVITY Experience of Agents Handling Time Process Knowledge Communication Skills References Willingness Pricing Follow-up Required Contributors
  47. Root Cause – Sales Productivity – Willingness Root Cause –

    Sales Productivity – Willingness IMPROVE IMPROVE Driver Recommendations Sales is Incentivised • Sales should be incentivised so that the agents are motivated • There should be monthly incentives for agents • Top sellers of the month should get gift hampers which should be displayed in office reward area Poor Probing Skills • Agents should probe the prospects well and gather the required details • Agents should also build a rapport while speaking with the prospects Will Issue of Agents • Build effective R&R • Disengage persistent defaulters basis internal NPS ESAT Survey • Sales survey for ESAT needs to be conducted frequently • Areas of concerns of agents should be worked upon • All complaints should be analyzed so that the ESAT can be improved Team Bonding Activity • Team bonding activity must be conducted on floor frequently to keep the agents motivated • Team outing should be conducted once a month • Pre shift and post shift hurdles should be on a friendly and motivational sessions • Healthy competition should be there amongst the teams
  48. Improve Summary – Take Away Improve Summary – Take Away

    IMPROVE IMPROVE FACTOR SALES PRODUCTIVITY Experience of Agents Handling Time Process Knowledge Communication Skills References Willingness Pricing Follow-up Required Contributors
  49. Root Cause – Sales Productivity – Pricing Root Cause –

    Sales Productivity – Pricing IMPROVE IMPROVE Driver Recommendations Meet and Beat Policy • The company should follow the meet and beat the price policy with the competitors • Should be able to get the best deal for the prospect, by understanding the sponsorship needs clearly • Clear and transparent pricing policies Promotions for existing students • Special promotional offers for existing students to increase sales • 20% cash back in students wallet, soon as a their reference joins a program • Option to add small amount in their wallet every month, that can be used in lump-sum to pay their semester fee • Certain discount coupon codes
  50. Improve Summary – Take Away Improve Summary – Take Away

    IMPROVE IMPROVE FACTOR SALES PRODUCTIVITY Experience of Agents Handling Time Process Knowledge Communication Skills References Willingness Pricing Follow-up Required Contributors
  51. Root Cause – Sales Productivity – Follow-up Root Cause –

    Sales Productivity – Follow-up IMPROVE IMPROVE Driver Recommendations Potential Sales Call • There should be a follow-up tracker sheet for every agent • There should be a team for follow-up calls and well who can track Procedure for follow-up • There should be a follow-up TAT • 4 calls should be made minimum by the concerned team • Email to be sent to the prospects seeking their availability and gauging their interest
  52. Quality Function Deployment (QFD) Quality Function Deployment (QFD) IMPROVE IMPROVE

    Identified X’s Willingness Refreshment Update Sharing Lack of SOP Agents Incentive Total AHT 5 3 3 3 0 1 2 3 3 3 3 0 3 3 150 Tenure of the Agent 5 0 0 1 3 0 3 1 2 1 1 3 2 3 100 Total 15 15 20 15 5 25 20 25 20 20 15 25 30 Weightage of Potential X’s Hiring of experienced agents in same field Process Knowledge Test should be conducted Agent QCA Calibration Complicated Cases Up-streaming Process Lack of knowledge of shortcuts Cumbersome Process Training before agents come on floor
  53. Control Deliverable Control Deliverable CONTROL CONTROL Control Plan and FMEA

    on Control Plan Control Plan and FMEA on Control Plan Time Series Study of Y – Pre & Post Time Series Study of Y – Pre & Post Control Charts & Inference of Y – Pre & Post Control Charts & Inference of Y – Pre & Post Basic Analysis of Improved Y Basic Analysis of Improved Y Establish Process Capability Establish Process Capability Control Charts & Inference (for X1, X2, X3, ...) Control Charts & Inference (for X1, X2, X3, ...) Cost Benefit Analysis & Sign Off Cost Benefit Analysis & Sign Off
  54. Failure Mode and Effect Analysis (FMEA) Failure Mode and Effect

    Analysis (FMEA) CONTROL CONTROL Defined X's Actionable Items Failure Mode Effect Severity Occurance Detection RPN RMS RTP Responsibility Agent Training Required Experience trainer not available Training affected 10 5 10 500 Reduce Create back up Training Manager Insufficient training time Training affected 10 5 10 500 Reduce Allocate some extra time Operation Manager Non availablity of training room Training affected 9 5 10 450 Transfer Transfer to facility Facility Manager Non professional trainer Training affected 9 6 10 540 Reduce Create back up Training Manager Training material not available Training affected 10 5 10 500 Reduce Maintain update tracker Training Manager Trainer could be on leave due to illness or urgent work Training affected 10 5 10 500 Reduce Create back up Training Manager Agent Incentive Required Approval not provided on time Sales affected 9 5 10 450 Accept Transfer to HR Operation Manager Agent incentive plan not shared with the agents Sales affected 10 5 10 500 Transfer Transfer to HR Operation Manager Agent incentive not paid on time Sales affected 10 5 10 500 Transfer Transfer to HR Operation Manager Agent incentive amount is insufficient/not at par w.r.t. delivery Sales affected 9 5 10 450 Reduce Transfer to HR Operation Manager Agent/QCA/SME Calibration Calibration could not be completed on time Sales revenue affected 10 5 10 500 Reduce Send reminder prior to the end date Training Manager Calibration plan not followed Sales revenue affected 10 5 10 500 Reduce Send reminder to the trainer Training Manager Heavy call flow Sales revenue affected 10 5 10 500 Reduce Create back up Training Manager Update Sharing Agent not present in team huddle Impact on update sharing 9 5 10 450 Reduce Send reminder Operation Manager Updates and MOM are not communicated to the agents Impact on update sharing 10 5 10 500 Reduce Post sharing updates send MOM Team Lead No consolidated query tracker Impact on update sharing 10 5 10 500 Reduce Maintain query tracker in update repository Team Lead Update tracker not updated/available Impact on update sharing 9 5 10 450 Reduce Maintain query tracker in update repository Team Lead Busy training schedule Impact on update sharing 9 5 10 450 Reduce Daily query and update communication Training Manager Process Knowledge Test Process knowledge test not mandatory for the agent Impact on agents process knowledge 10 5 10 500 Reduce Process knowledge test on monthly basis Training Manager Scores not included in incentive plan Impact on agents process knowledge 10 5 10 500 Reduce Scores to be the part of incentive plan Training Manager Scores are not reported to the management Impact on agents process knowledge 10 5 10 500 Reduce Process knowledge test scores to be shared with the manage Training Manager Special Incentive Plan No special incentive plan introduced for the agents Impact on agents motivation 10 5 10 500 Transfer Transfer to HR HR Manager No agent retention plans Impact on agents motivation 9 5 10 450 Transfer Transfer to HR HR Manager No extra time payout for agent Impact on agents motivation 10 5 10 500 Transfer Transfer to HR HR Manager Agent-Agent Calibration/Discussion Agent-Agent calibration not scheduled Impact on agents process knowledge 9 5 10 450 Reduce Set calibration for QCA/SME/Trainer Training Manager Agent- Agent discussion not documented Impact on agents process knowledge 10 5 10 500 Reduce Calibration/discussion report to be document Training Manager Lack of coordination Impact on agents process knowledge 10 5 10 500 Reduce Feedback to be shared on weekly basis Training Manager Professional Certification/Refresher Training Professional certification programme not introduced Skill enhancement would be impacted 10 5 10 500 Transfer Transfer to HR HR Manager Agent not nominated for the certification Skill enhancement would be impacted 9 5 10 450 Transfer Transfer to HR HR Manager Agent could not complete the certification schedule Skill enhancement would be impacted 9 5 10 450 Transfer Transfer to HR HR Manager Required resource not available for training Skill enhancement would be impacted 10 5 10 500 Transfer Transfer to facility Facility Manager Introduce New Designation Internal job posting not approved by the operations AVP People retention plan affected 10 5 10 500 Accept Transfer to HR Operation AVP New designation not introduced People retention plan affected 19 5 10 950 Transfer Transfer to HR HR Manager Qualifying criteria not communicated People retention plan affected 10 5 10 500 Transfer Transfer to HR HR Manager
  55. Previous & Post Analysis of Sales – Pilot Result Previous

    & Post Analysis of Sales – Pilot Result CONTROL CONTROL I-MR Chart of Revenue by Agents ($) by Stages 0 10000 20000 30000 Individual Value 1 61 121 181 241 Pre Post UCL=27255 X=14624 LCL=1992 S.N. 0 10000 15000 20000 Moving Range 1 61 121 181 241 Pre Post UCL=15518 MR=4749 LCL=0 S.N. 5000 Earlier Observation: Individual Value: UCL=26113, Mean=12193, LCL=1727 Moving Range: UCL=17277, Mean=5234, LCL=0 Here we can conclude that there is increase in UCL for Individual Value and decrease in UCL for Moving Range. Mean is also increase from 12193 to 14624 for Individual Value and decreased from 5234 to 4749 for Moving Range
  56. Pre-Post Analysis of Project Y Pre-Post Analysis of Project Y

    CONTROL CONTROL Graphical Depiction Hypothesis Result Statistical Validation of Improvement Scatterplot of Improved Agent Revenue vs New Agent Tenure 5000 10000 15000 20000 25000 Improved Agent Revenue 0 New Agent Tenure 1 2 3 4 5 6 7 8 9 Regression Analysis: Improved Agent Revenue versus New Agent Tenure The regression equation is Improved Agent Revenue = 9231+995 New Agent Tenure Predictor Coef SE Coef T P Constant 9231.4 655.4 14.09 0.000 New Agent Tenure 994.9 110.2 9.03 0.000 S = 4880.19 R-Sq = 21.5% R-Sq(adj) = 21.2% Analysis of Variance
  57. Pre-Post Analysis of Project Y Pre-Post Analysis of Project Y

    CONTROL CONTROL Graphical Depiction Hypothesis Result Statistical Validation of Improvement Scatterplot of Improved Agent Revenue vs New AHT 5000 10000 15000 20000 25000 Improved Agent Revenue 0 200 400 600 800 1000 1200 1400 1600 1800 New AHT Regression Analysis: Improved Agent Revenue versus New AHT The regression equation is Improved Agent Revenue = 10360 + 5.97 AHT Predictor Coef SE Coef T P Constant 10359.6 500.2 20.71 0.000 New AHT 5.9701 0.5950 10.03 0.000 S = 4566.73 R-Sq = 25.3% R-Sq(adj) = 25.0% Analysis of Variance Source DF SS MS F P Regression 1 2099499813 2099499813 100.67 0.000 Residual Error 298 6214787463 20854991 Total 299 8314287277
  58. Basic Data Analysis of Improved Y Basic Data Analysis of

    Improved Y CONTROL CONTROL BOX PLOT BEFORE AND AFTER 5000 10000 15000 20000 25000 Data Revenue by Agent ($) Improved Agent Revenue
  59. Pilot Result Pilot Result CONTROL CONTROL Summary of Improved Agent

    Revenue Anderson-Darling Normality Test A-Squared 2.56 P-Value < 0.005 95% Confidence Intervals 14000 14500 15000 15500 16000 Mean Median Mean 14624 StDev 5273 Variance 27806981 Skewness 0.004964 Kurtosis -0.873772 N 300 Minimum 5178 1st Quartile 10396 Median 15047 3rd Quartile 18500 Maximum 25000 95% Confidence Interval for Mean 14025 15223 95% Confidence Interval for Median 14019 16054 95% Confidence Interval for StDev 4882 5733 6000 9000 12000 15000 18000 21000 24000 Null & Alternate Hypothesis: H0 – Data is Normal HA – Data is Non-Normal Normality: p=value is less than 0.005 Shape: Normal Measure of Central Tendency [Mean/Median]: Since both the values are approximately identical, so post AHT is now normal. Spread: Stability factor: Q1/Q3 Stability factor = 10396/18500 = 0.56 This indicates that variation between quarter is very low. Normality Test, p-value 0.005. Mean = 289.94 sec Median = 290 sec
  60. Pilot Result Pilot Result CONTROL CONTROL Run Chart of Revenue

    by Agent ($) Number of runs about median: 154 Expected number of runs: 151.0 Longest run about median: 8 Approx P-Value for Clustering: 0.636 Approx P-Value for Mixtures: 0.364 1 20 40 60 80 100 120 140 160 180 200 220 240 260 280 300 5000 10000 15000 20000 25000 Revenue by Agent ($) Observation Number of runs up or down: 216 Expected number of runs: 199.7 Longest run up or down: 5 Approx P-Value for Trends: 0.968 Approx P-Value for Oscillations: 0.012 Run Chart of Improved Agent Revenue Number of runs about median: 104 Expected number of runs: 151.0 Longest run about median: 22 Approx P-Value for Clustering: 0.000 Approx P-Value for Mixtures: 1.000 1 20 40 60 80 100 120 140 160 180 200 220 240 260 280 300 5000 10000 15000 20000 25000 Improved Agent Revenue Observation Number of runs up or down: 204 Expected number of runs: 199.7 Longest run up or down: 4 Approx P-Value for Trends: 0.724 Approx P-Value for Oscillations: 0.276 p-value of trends, mixture, and oscillation are more than 0.05. It also suggests that there is now no such observation exists.
  61. CBA and Learning & Challenges CBA and Learning & Challenges

    CONTROL CONTROL Amount saved by saving penalties: • By hiring more experienced and tenure agents in the company and if the agents spend more time with the prospects, company is been able to generate more revenue Extra revenue generated = USD 729,321 Total benefit by project = USD 729,321 Learning & Challenges: 1. Fixing knowledge gap between agents 2. Sharing best practices among agents 3. Sharing & maintaining updates tracker 4. Rolling a good performance pay plan with Ops / HR Manager 5. Setting up grooming/coaching plan for agents with other performers of new role 6. Setting new incentive plan for sales team Identification of pain point: • Not hiring experienced agents in the same field is impacting sales revenue
  62. Post Improvement VOC Post Improvement VOC VOC VOC Customer Previous

    Complaints Current Review Customer CTQ Customer Focus Group 1 Agents are not able to resolve queries / complaints effectively each time Agents have better product knowledge and now able to resolve queries / complaints effectively after training session Better customer satisfaction Customer Focus Group 2 Sales productivity was low even on potential calls On time resolution for small queries has increased the sales productivity Increase in sales productivity VP - Sales Business results are not in line with the expectations, company standards Business results are now in line with the expectations. Sales revenue has increased by USD 729,321 Increase in revenue Sr. Sales Manager Business operation is impacted due to hiring of wrong resources and not proper training Business operation is now under control and population is meeting their targets Improved productivity and consistency in revenue