$30 off During Our Annual Pro Sale. View Details »

Decoding Lifespan Brain Changes

Decoding Lifespan Brain Changes

Video: https://video.linux.it/w/gBD5pzc6Y26KRtofGzVLZ2?start=23m27&stop=36m45

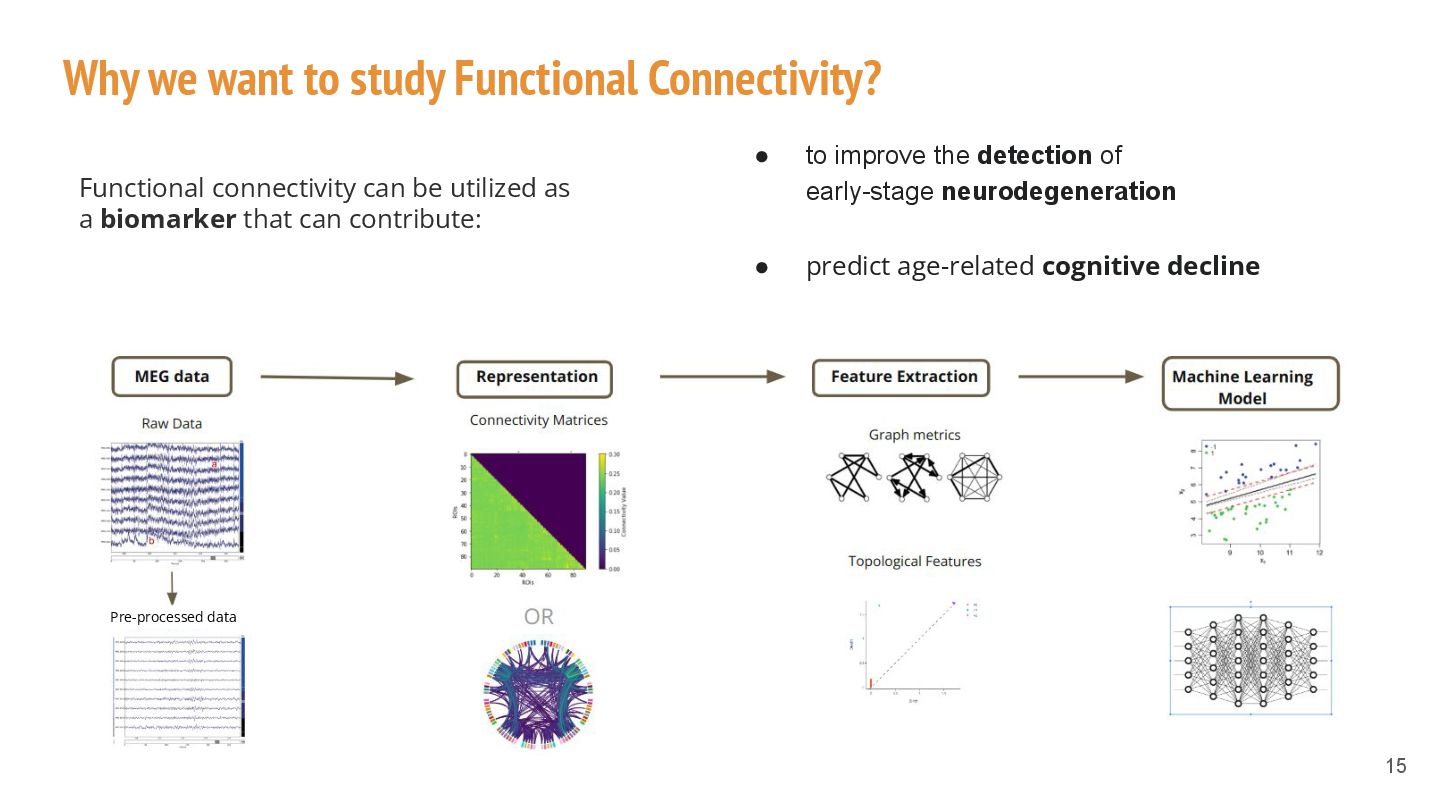
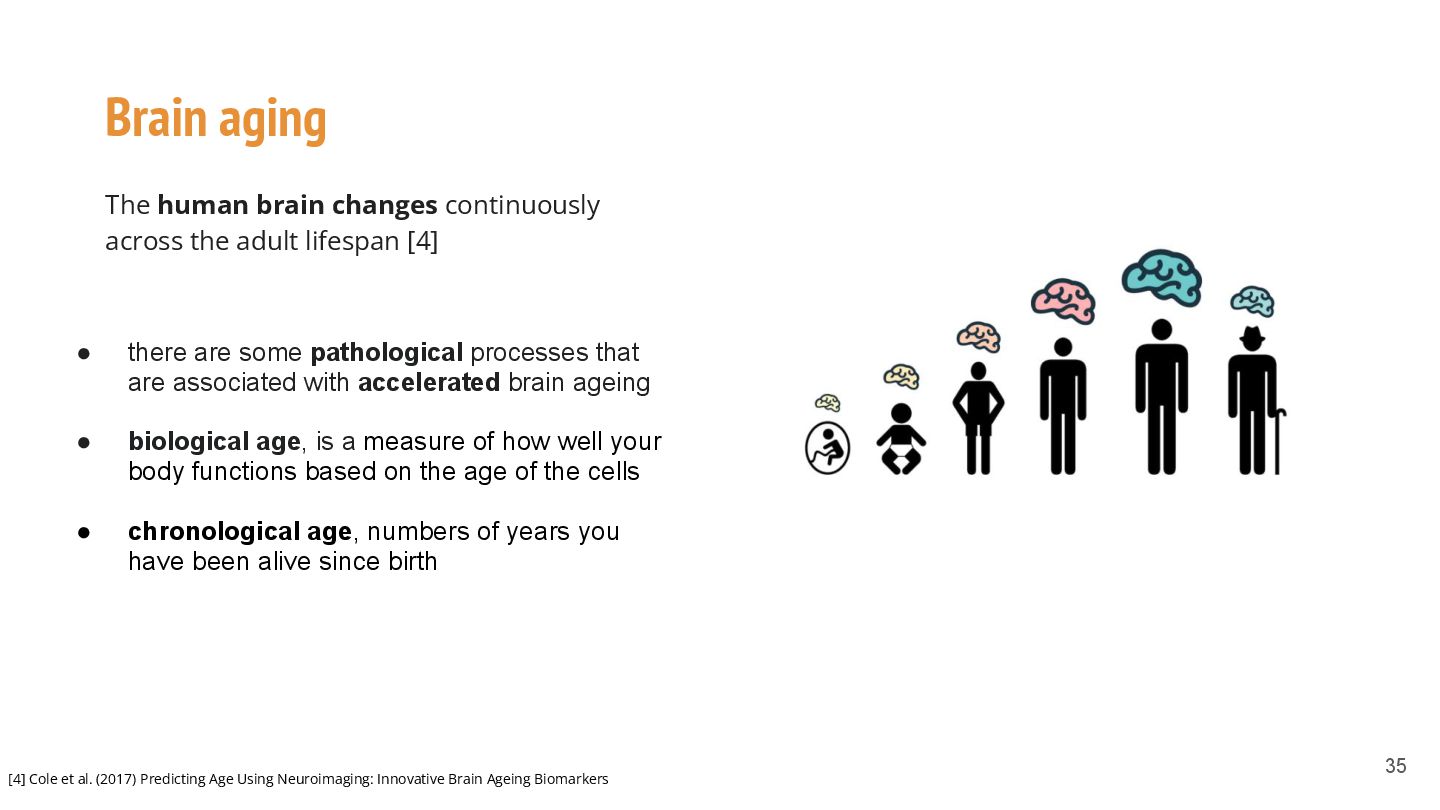
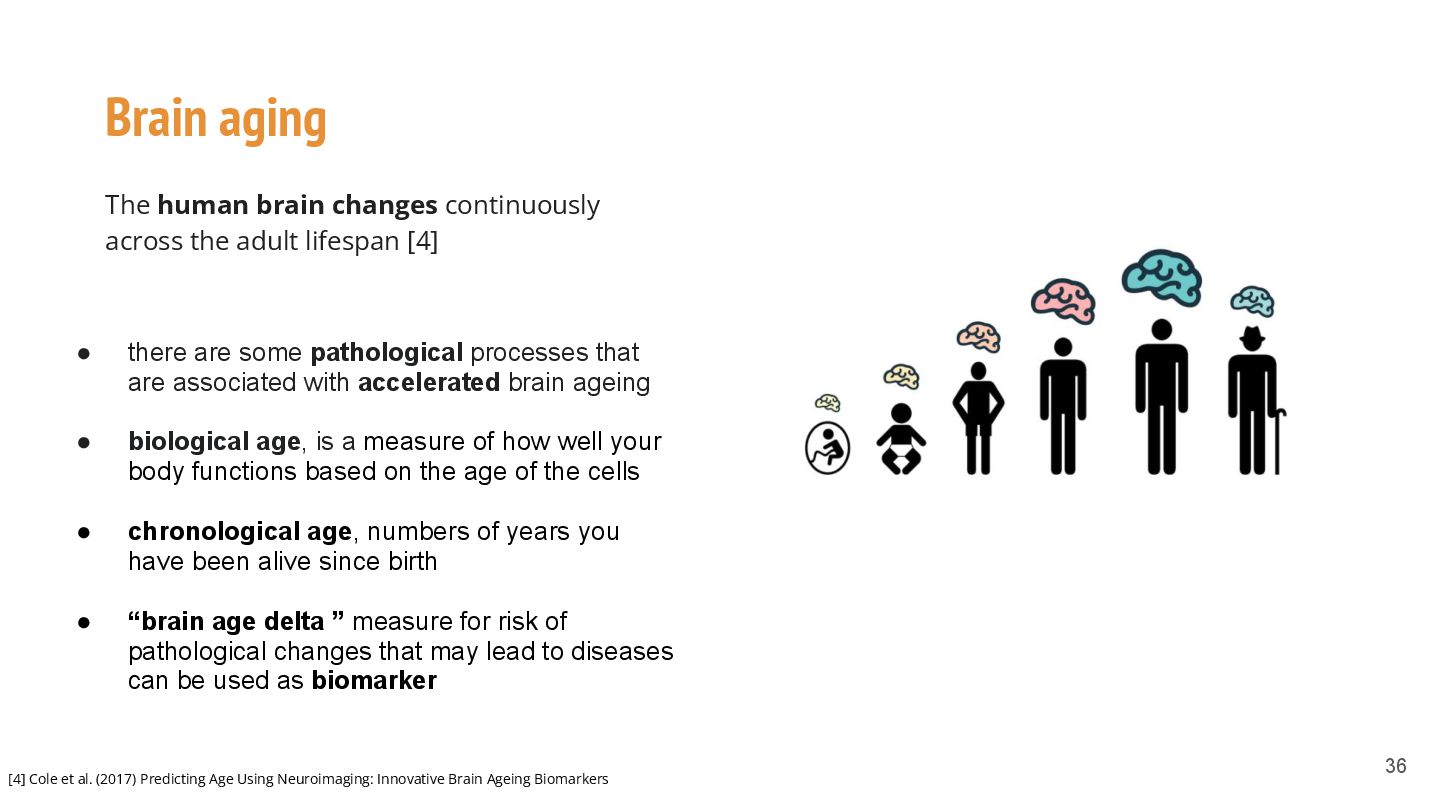
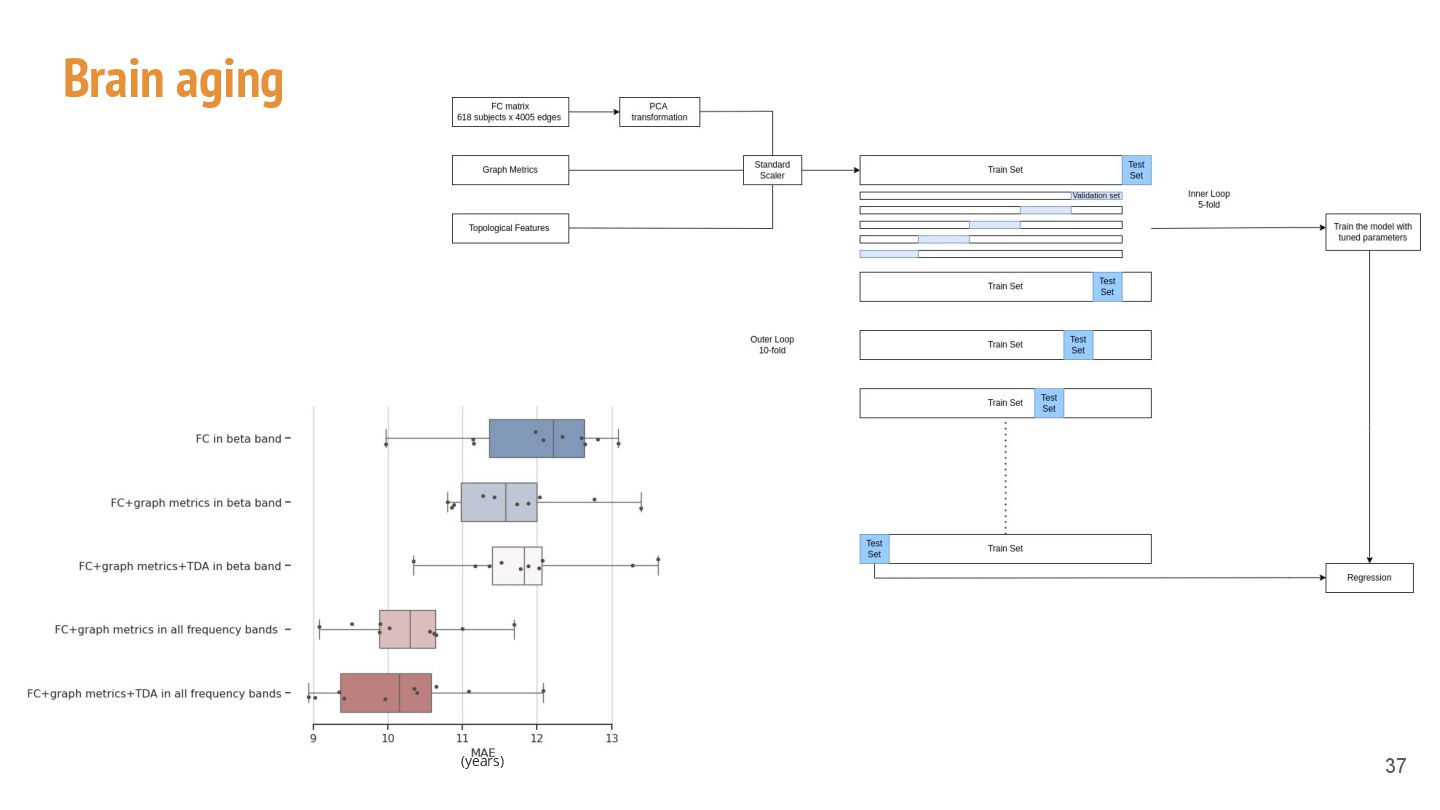
Come si può studiare l’evoluzione della connettività cerebrale di un adulto attraverso il Machine Learning? Questa presentazione esamina i cambiamenti nella connettività cerebrale nel corso della vita in adulti sani utilizzando dati di magnetoencefalografie a riposo, impiegando l'apprendimento automatico per analizzare la connettività correlata all'invecchiamento, le proprietà grafiche e i modelli predittivi dell'età cerebrale.

Carola Caivano — Laureata in fisica, appassionata di Responsible AI e di applicazioni AI che creano impatto sociale positivio, si è convertita in AI Developer con esperienza in Machine Learning e Neuroscienze Computazionali
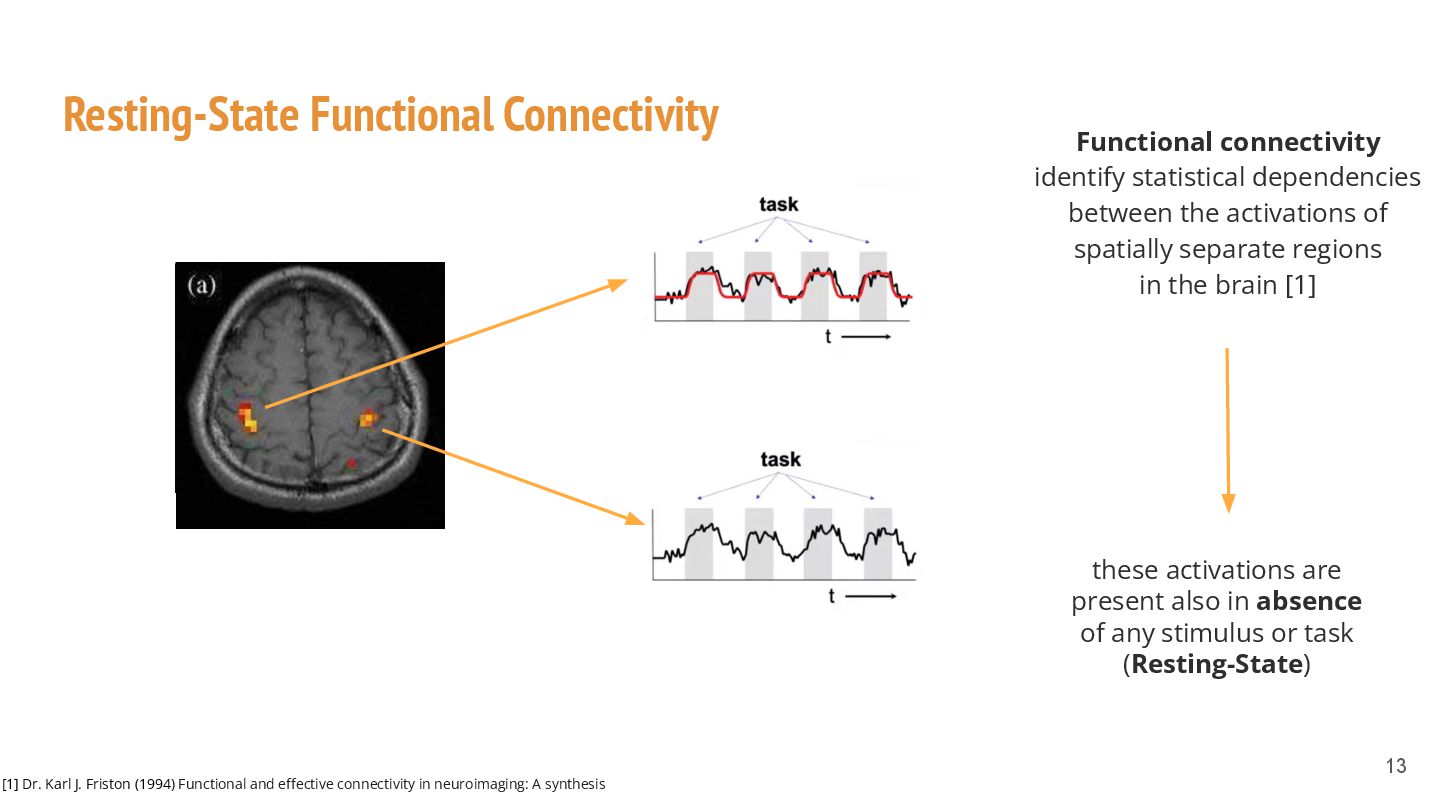
Avatar for Python Torino

Python Torino

December 18, 2024
Tweet

More Decks by Python Torino

Other Decks in Research

Transcript

  1. What is Functional Connectivity? The brain is a complex system

    of interconnected cells and brain regions How are different parts of the brain functionally related? 10
  2. Task-related activation study 11 [1] Dr. Karl J. Friston (1994)

    Functional and effective connectivity in neuroimaging: A synthesis
  3. Task-related activation study 12 [1] Dr. Karl J. Friston (1994)

    Functional and effective connectivity in neuroimaging: A synthesis
  4. Resting-State Functional Connectivity 13 Functional connectivity identify statistical dependencies between

    the activations of spatially separate regions in the brain [1] [1] Dr. Karl J. Friston (1994) Functional and effective connectivity in neuroimaging: A synthesis these activations are present also in absence of any stimulus or task (Resting-State)
  5. Why we want to study Functional Connectivity? • to improve

    the detection of early-stage neurodegeneration Functional connectivity can be utilized as a biomarker that can contribute: • predict age-related cognitive decline 14
  6. Why we want to study Functional Connectivity? • to improve

    the detection of early-stage neurodegeneration Functional connectivity can be utilized as a biomarker that can contribute: • predict age-related cognitive decline Pre-processed data 15
  7. Data for Functional Connectivity analysis Magnetoencephalography (MEG) 17 • Non-invasive

    functional brain imaging technique • Measures magnetic fields induced by neuronal activity
  8. Data for Functional Connectivity analysis Magnetoencephalography (MEG) 18 • Non-invasive

    functional brain imaging technique • Measures magnetic fields induced by neuronal activity • Excellent temporal and good spatial resolution
  9. Data for Functional Connectivity analysis Magnetoencephalography (MEG) 19 • Non-invasive

    functional brain imaging technique • Measures magnetic fields induced by neuronal activity • Excellent temporal and good spatial resolution • Suitable for studying ongoing neuronal activity across the brain regions over wide frequency range
  10. Cam-CAN dataset setup Resting-state MEG neuroimaging data from 618 healthy

    subjects, age range 18–88 years [2] Santeri Ruuskanen (2023) Resting-state functional connectivity changes over the healthy adult lifespan 20
  11. Cam-CAN dataset setup Resting-state MEG neuroimaging data from 585 healthy

    subjects, age range 18–88 years 21 MEG data Source Estimation Parcellation Functional Connectivity Features Extraction • connectivity scores • graph metrics • topological features
  12. Graph metrics Graph metrics [2] • Global Efficiency • Average

    Shortest Path • Transitivity [2] Mikail Rubinov, Olaf Sporns (2010) Complex network measures of brain connectivity: Uses and interpretations 22
  13. Graph metrics Graph metrics [2] • Global Efficiency • Average

    Shortest Path • Transitivity [2] Mikail Rubinov, Olaf Sporns (2010) Complex network measures of brain connectivity: Uses and interpretations 23
  14. Graph metrics Graph metrics [2] • Global Efficiency • Average

    Shortest Path • Transitivity [2] Mikail Rubinov, Olaf Sporns (2010) Complex network measures of brain connectivity: Uses and interpretations 24 thresholding
  15. Graph metrics Graph metrics [2] • Global Efficiency • Average

    Shortest Path • Transitivity [2] Mikail Rubinov, Olaf Sporns (2010) Complex network measures of brain connectivity: Uses and interpretations 25 thresholding binarized connectivity matrix
  16. Topological Features TDA aims to extract the underlying shape of

    data [4] [4] Chazel,Michel (2021)An Introduction to Topological Data Analysis: Fundamental and Practical Aspects for Data Scientists 26
  17. Topological Features TDA aims to extract the underlying shape of

    data [4] Persistent Homology characterizes the shape of data via holes [4] Chazel,Michel (2021)An Introduction to Topological Data Analysis: Fundamental and Practical Aspects for Data Scientists 27
  18. Topological Features TDA aims to extract the underlying shape of

    data [3] Persistent Homology characterizes the shape of data via holes We can get a shape of the data using simplicial complexes [3] Chazel,Michel (2021)An Introduction to Topological Data Analysis: Fundamental and Practical Aspects for Data Scientists 28
  19. Topological Features TDA aims to extract the underlying shape of

    data [4] Persistent Homology characterizes the shape of data via holes We can get a shape of the data using simplicial complexes [4] Chazel,Michel (2021)An Introduction to Topological Data Analysis: Fundamental and Practical Aspects for Data Scientists we can use homology groups to characterize a shape 29
  20. Topological features extraction from graphs Vietoris-Rips complex 32 Persistence diagram

    track the evolution of topological features Birth Death Persistence of a topological feature Very persistent topological features → more informative
  21. Brain aging • there are some pathological processes that are

    associated with accelerated brain ageing The human brain changes continuously across the adult lifespan [4] [4] Cole et al. (2017) Predicting Age Using Neuroimaging: Innovative Brain Ageing Biomarkers 33
  22. Brain aging • there are some pathological processes that are

    associated with accelerated brain ageing • biological age, is a measure of how well your body functions based on the age of the cells The human brain changes continuously across the adult lifespan [4] [4] Cole et al. (2017) Predicting Age Using Neuroimaging: Innovative Brain Ageing Biomarkers 34
  23. Brain aging • there are some pathological processes that are

    associated with accelerated brain ageing • biological age, is a measure of how well your body functions based on the age of the cells • chronological age, numbers of years you have been alive since birth The human brain changes continuously across the adult lifespan [4] [4] Cole et al. (2017) Predicting Age Using Neuroimaging: Innovative Brain Ageing Biomarkers 35
  24. Brain aging • there are some pathological processes that are

    associated with accelerated brain ageing • biological age, is a measure of how well your body functions based on the age of the cells • chronological age, numbers of years you have been alive since birth • “brain age delta ” measure for risk of pathological changes that may lead to diseases can be used as biomarker The human brain changes continuously across the adult lifespan [4] [4] Cole et al. (2017) Predicting Age Using Neuroimaging: Innovative Brain Ageing Biomarkers 36