Upgrade to Pro — share decks privately, control downloads, hide ads and more …

Overview of the 2014 Green-e Verification Report

Overview of the 2014 Green-e Verification Report

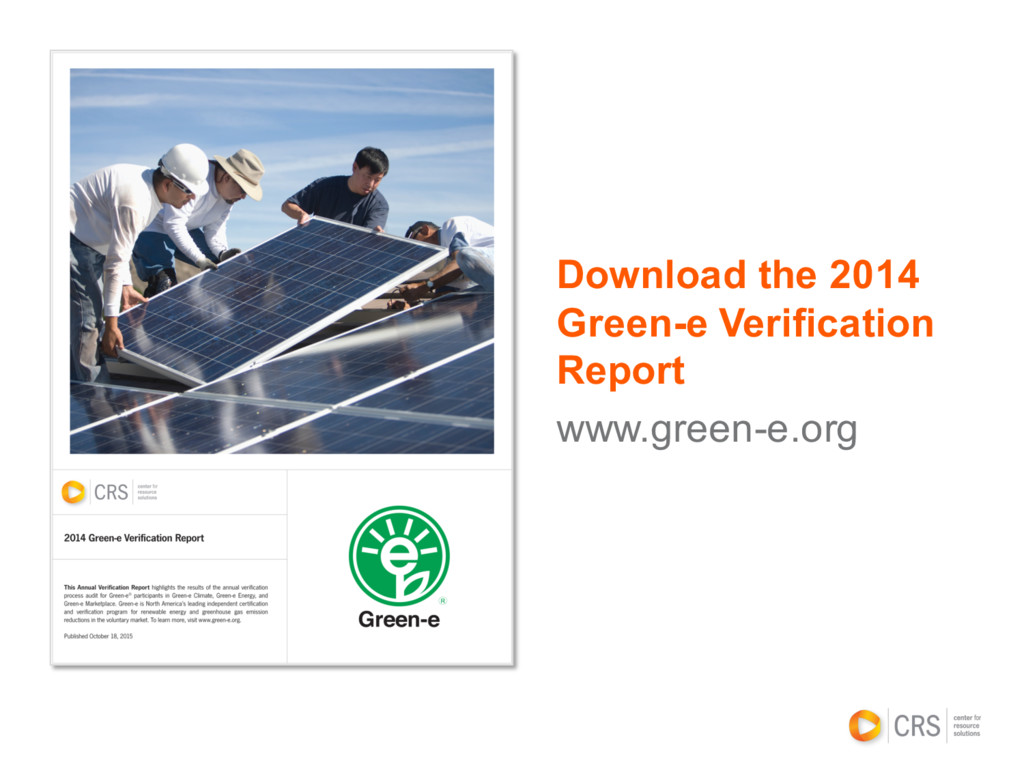
Join Green-e staff to review the results of the 2014 Green-e Verification Report, which was was released on October 19th. This webinar will cover how each program performed throughout last year, as well as an exploration of voluntary renewable energy and carbon offset markets, trends in corporate purchasing, and a look at where the market is heading. Presented on December 3, 2015

Center for Resource Solutions

December 03, 2015
Tweet

More Decks by Center for Resource Solutions

Other Decks in Business

Transcript

  1. View Slide

  2. Presenters
    Sarah Busch
    Green-e Analyst and
    Partnerships Specialist
    Orrin Cook
    Senior Manager, Green-e
    Market Development
    Maya Kelty
    Green-e Associate
    Michael Leschke
    Green-e Energy Analyst
    Jeff Swenerton
    Communications Director

    View Slide

  3. Outline
    § About Green-e and Center for Resource Solutions
    § The Year in Green-e Climate
    § The Year in Green-e Marketplace
    § The Year in Green-e Energy
    § Q&A

    View Slide

  4. Certifications
    for sellers…
    § Utility green power programs
    § Community solar
    § RECs
    § Competitive electricity products
    § Carbon offsets
    § Community choice aggregation
    § Carbon offset natural gas
    programs
    § Federally eligible RE products
    § Wind
    § Solar
    § Low-impact hydro
    § Biomass and biogas
    § Geothermal
    Certifications
    for buyers…
    § PPAs (delivered or virtual)
    § On-site power
    § Corporations using RE
    § Products manufactured w/RE
    § Conferences and trade
    shows
    § EV charging stations
    § Paper and printers

    View Slide

  5. Benefits of Green-e Certification
    § Provides risk reduction to all parties
    § Protects against double claims
    § Verifies product marketing claims
    § Meets diverse state-specific requirements
    § Demonstrates clean energy and climate leadership
    § Differentiates your company and product
    § Strengthens customer and employee loyalty
    § Integrates you into a community of leading organizations
    § Provides trusted 3rd party assurances

    View Slide

  6. View Slide

  7. Green-e Climate Growth Through 2014

    View Slide

  8. Green-e Climate RY2014 Stats
    Supply
    • 13 projects, located in the US
    • Project types: Coal mine methane capture (15%)
    Landfill gas methane capture (84%)
    Livestock Methane Capture (<1%)
    • Endorsed Programs: Climate Action Reserve (81%)
    Verified Carbon Standard (19%)
    Sales
    • Total volume of certified offsets sold = 259,410 tCO2e
    • Nearly 100% offline OTC to commercial buyers
    • One-time (84%) or multi-year (16%) sales
    • Majority of buyers located in the US. Highest sales to international
    purchasers (nearly 10,000 mT) in the history of the program.
    • Majority of sales made to Texas buyers. California had the largest number
    of customers.

    View Slide

  9. LEED Driving Demand
    Over a quarter (26%) of certified sales in 2014
    were sales for LEED green building certification.

    View Slide

  10. View Slide

  11. 500 Products. At the end of 2014, there were over
    500 products and companies certified by Green-e
    Marketplace, with new products like Kendall Jackson’s
    Avant wine brand hitting the shelves nationally.

    View Slide

  12. Green-e Events. Attracted high profile events like
    Greenbuild 2014 and Local Government Commission’s
    California Adaptation Forum

    View Slide

  13. View Slide

  14. Green-e Energy Certified Retail Sales
    by Product Type, 1998–2014 (MWh)
    Green-e Energy certified retail sales reached nearly 38 million megawatt-hours (MWh)
    in 2014, the highest number of certified retail MWh to date. Green-e Energy certified
    sales have increased at an average rate of 14% per year over the past four years.

    View Slide

  15. Sales by customer type increased for both residential and non-residential
    customers. This represents increases of 14% and 12% respectively over 2014.
    Green-e Energy Certified Sales by
    Customer Type, 1998–2014 (in MWh)

    View Slide

  16. Equivalent to powering over 1/3 of U.S. households
    for 1 Month, or 1% of the total U.S. Electricity Mix

    View Slide

  17. In 2014 there were over 836,000 retail purchasers of Green-e certified
    renewable energy, including 50,000 businesses. This represents an all-
    time high—more retail customers than ever before are purchasing
    Green-e Energy certified products.
    Number of Retail Customers
    Purchasing Green-e Energy Certified
    Products by Type, 1998–2014

    View Slide

  18. In 2014, bundled certified renewable electricity options were available in
    36 states. This geographic spread across the country means that more
    electricity customers in many parts of the United States have the option
    to purchase certified renewable electricity than ever before.

    View Slide

  19. The total volume of all Green-e Energy certified transactions in 2014
    reached over 47.7 million MWh. Removing the instances of renewable MWh
    certified by Green-e Energy at both the wholesale and retail levels, Green-e
    Energy certified sales of over 43.5 million unique MWh in 2014, an increase
    of 12% from 2013 and the highest total of certified unique MWh to date.

    View Slide

  20. Both retail customers buying Green-e Energy certified renewable
    energy and the resources available to supply those customers are
    spread out throughout the U.S.

    View Slide

  21. The difference between states with generators versus purchasers of
    renewable energy demonstrates how the market for RECs is allowing
    customers with limited access to local renewable energy products to
    support changes in generation portfolios.
    Sales: Supply:

    View Slide

  22. In 2014, Green-e Energy sales came from a range of
    resources across the United States and Canada. Output from
    over 55% of installed wind facilities in the U.S. is sold in
    Green-e Energy certified transactions, based on total capacity.

    View Slide

  23. Nearly 1,000 unique generation facilities with a total capacity of around
    39,800 MW supplied Green-e Energy certified products in 2014. Supply
    came from more solar facilities (430) than any other resource type, yet
    wind comprises about 91% of overall capacity.
    *Aggregated rooftop solar facilities are counted as 1 facility

    View Slide

  24. After a slight dip in 2013, 2014 showed an overall increase in REC sales.
    Based on the most recently available National Renewable Energy
    Laboratory (NREL) data, Green-e Energy certified sales are estimated to
    make up approximately 90% of all retail REC sales in the U.S.

    View Slide

  25. Many customers can purchase a bundled renewable electricity product
    from their local electric utility, and in 2014, these programs continued to
    grow, with an overall increase of 10% from 2013 MWh volumes.

    View Slide

  26. In states where the electricity market is deregulated, customers have
    the option to choose their electric service provider(ESP). Sales of
    certified competitive electricity products have increased for residential
    customers and decreased for non-residential customers.

    View Slide

  27. 13%
    increase in retail MWh certified to customers
    compared to 2013
    17%
    increase in # of customers buying Green-e Energy
    certified products compared to 2013
    14%
    average increase per year in total MWh certified
    since 2010

    View Slide

  28. Download the 2014
    Green-e Verification
    Report
    www.green-e.org

    View Slide

  29. Download the Green-e Verification Report
    at www.green-e.org.
    Contact us at www.green-e.org/staff.
    Learn More

    View Slide