Upgrade to Pro — share decks privately, control downloads, hide ads and more …

An Overview of Domestic Well Vulnerability in California's Central Valley

richpauloo
January 18, 2019

An Overview of Domestic Well Vulnerability in California's Central Valley

Subtitle: Opportunities for Informed Risk Assessment

Invited talk given on Jan 18, 2019 at the California Environmental Protection Agency.

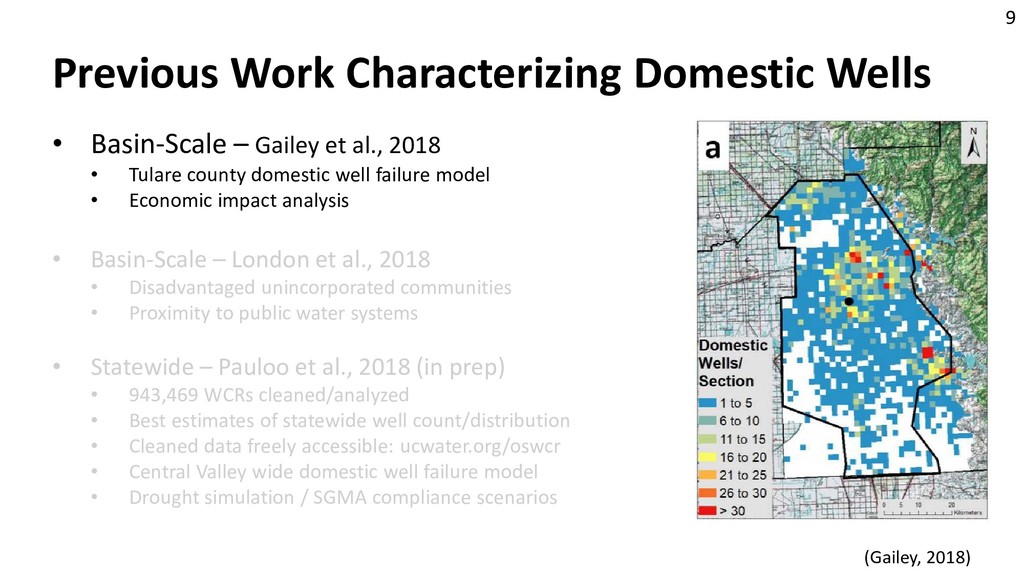
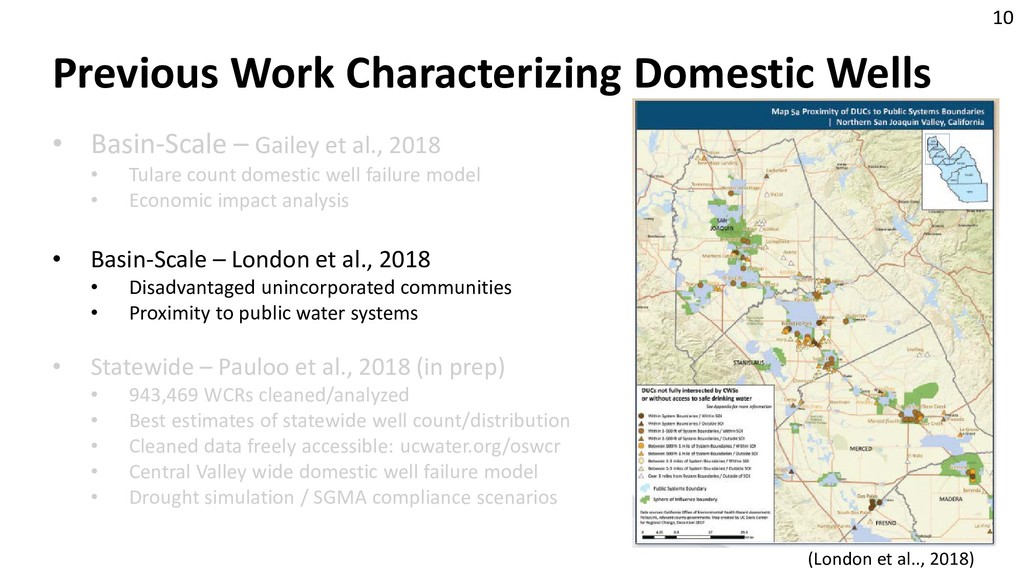
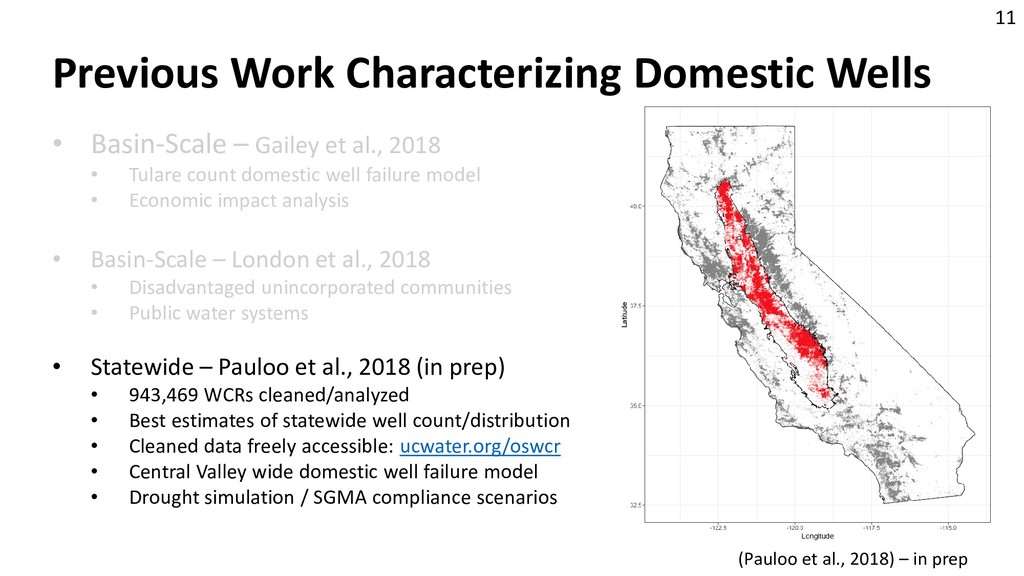
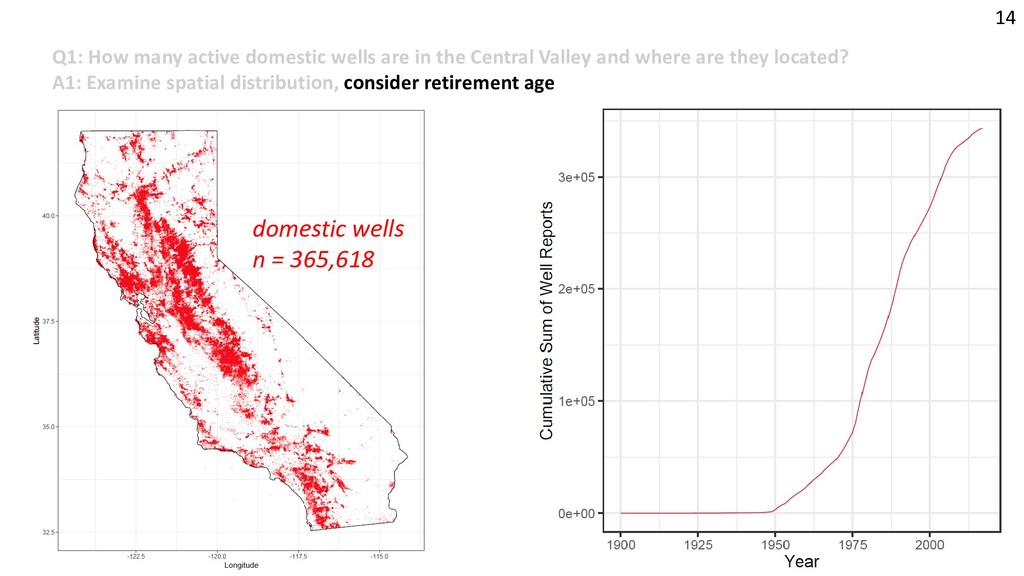
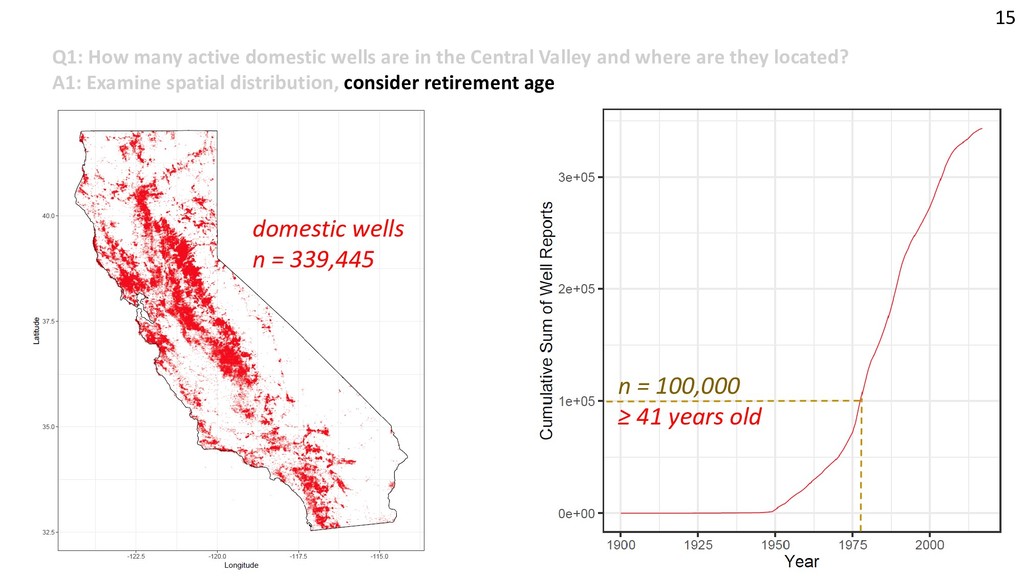
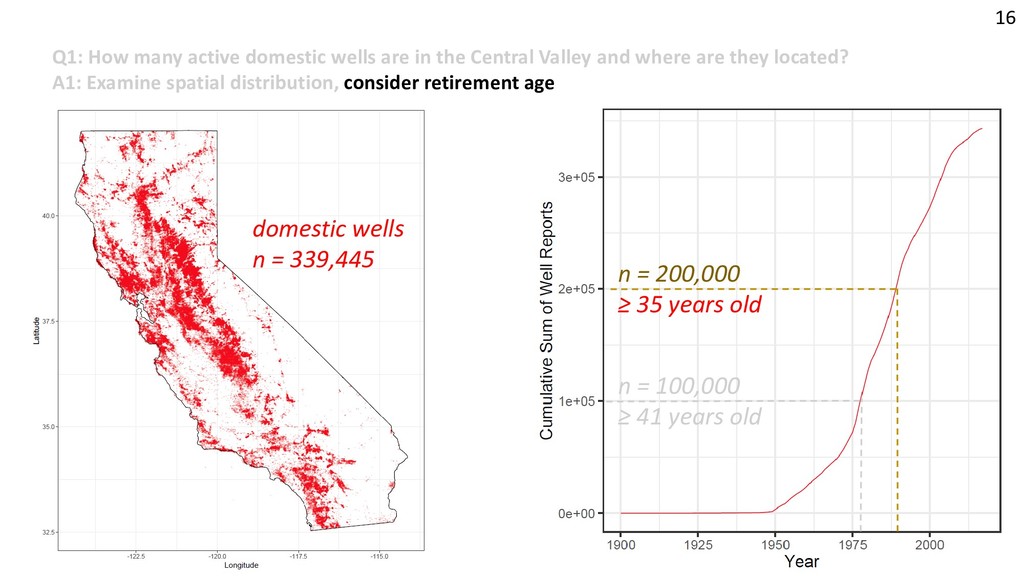
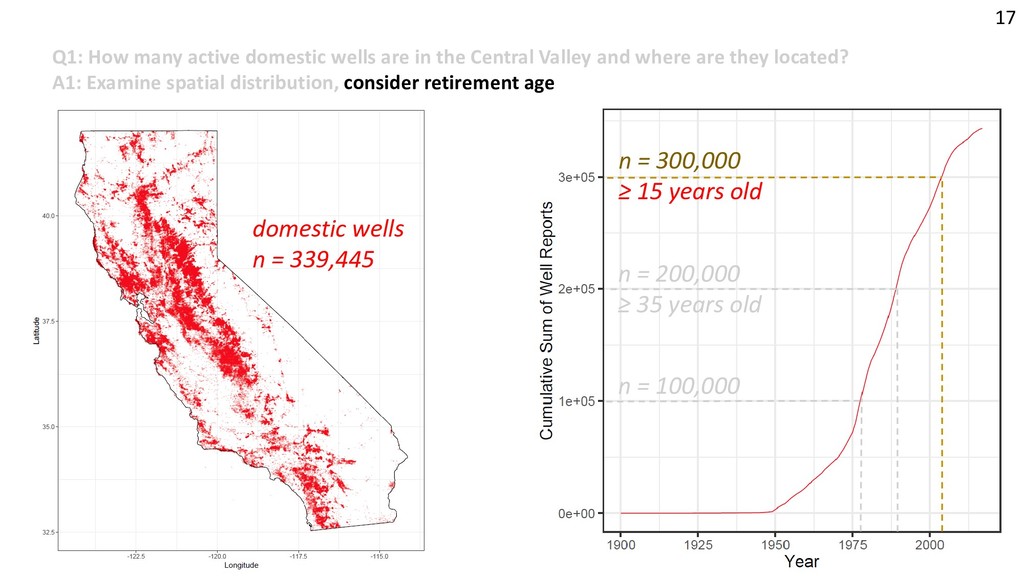
The stated objective of the meeting was: "to explore previously completed work identifying the location, extent, and water quality of domestic wells in California. The State has been tasked with performing a Needs Assessment to determine costs associated with providing potential remedies for contaminated domestic wells under the Human Right to Water."

richpauloo

January 18, 2019
Tweet

More Decks by richpauloo

Other Decks in Research

Transcript

  1. An Overview of Domestic Well Data in California’s Central Valley:

    Opportunities for Informed Risk Assessment Rich Pauloo, PhD Candidate Hydrologic Sciences Graduate Group, UC Davis Graham Fogg, Alvar Escriva-Bou, Amanda Fencl, Hervé Guillon richpauloo.github.io @RichPaulooo goo.gl/DDjT8e
  2. Agenda • Background & Motivation • Goals: Overall and Today

    • Previous work on CA domestic wells • Ongoing Work: Online State Well Completion Report Database (OSWCR) 1. How many active domestic wells are in the Central Valley and where are they located? 2. Where are the most vulnerable wells? • Vulnerability Case Study using OSWCR data • Online Web Application for clean, ready-to-go OSWCR data • Towards an assessment of Central Valley domestic well vulnerability to water quality contamination • Conclusions
  3. 3 Background & Motivation AB 685: Human Right to Water:

    “every human being has the right to safe, clean, affordable, and accessible water adequate for human consumption, cooking, and sanitary purposes”
  4. 4 Background & Motivation • Shallow domestic wells vulnerable to:

    • non-point source pollutants: • nitrates (Ransom et al., 2017; Harter et al., 2012; Faunt et al., 2009; Balazs et al., 2011) • total dissolved solids (Pauloo, 2018 (in prep); CV- SALTS; Cismowski et al., 2006; Schoups et al., 2005; Bertoldi et al., 1991) • drought (Pauloo, 2018 (in prep); Lund et al., 2018; Gailey et al., 2018; London et al., 2018) • Drought  pumping to replace lost surface water (Hanak et al., 2011)  groundwater levels fall  well failure. • Global warming  increased drought risk in California (Swain et al., 2018; Rhoades et al., 2018; Diffenbaugh et al., 2015; Cook et al., 2015)  intensification of groundwater demand to replace lost surface water. (Ransom, 2017)
  5. 5 (CA-DWR, 2018) Background & Motivation • Shallow domestic wells

    vulnerable to: • non-point source pollutants: • nitrates (Ransom et al., 2017; Harter et al., 2012; Faunt et al., 2009; Balazs et al., 2011) • total dissolved solids (Pauloo, 2018 (in prep); CV- SALTS; Cismowski et al., 2006; Schoups et al., 2005; Bertoldi et al., 1991) • drought (Pauloo, 2018 (in prep); Lund et al., 2018; Gailey et al., 2018; London et al., 2018) • Drought  pumping to replace lost surface water (Hanak et al., 2011)  groundwater levels fall  well failure. • Global warming  increased drought risk in California (Swain et al., 2018; Rhoades et al., 2018; Diffenbaugh et al., 2015; Cook et al., 2015)  intensification of groundwater demand to replace lost surface water.
  6. Background & Motivation 6 Overarching Workshop Goal • Needs Assessment:

    estimate cost of implementing SB 623 (Safe and Affordable Drinking Water Fund). • Today we focus on domestic wells This Presentation’s Goal • Review existing/ongoing research that informs the cost estimation of SB 623 as it pertains to domestic well vulnerability to water quality contamination in the Central Valley (CV). • Online State Well Completion Report Database (OSWCR)
  7. Background & Motivation 7 Overarching Workshop Goal • Needs Assessment:

    estimate the cost of SB 623 (Safe and Affordable Drinking Water Fund). • Domestic wells This Presentation’s Goal • Review existing/ongoing research that informs the cost estimation of SB 623 as it pertains to domestic well vulnerability to water quality contamination in the Central Valley (CV). • Online State Well Completion Report Database (OSWCR)
  8. Background & Motivation 8 Previous Work Characterizing Domestic Wells •

    Statewide – Johnson and Belitz, 2015 • 741,262 scanned OSWCR Well Completion Reports (WCR) • 41,671 total WCRs viewed • 13,557 domestic WCRs viewed • Statewide, 1.2 million people rely on domestic wells for drinking water (1990 US Decadal Census) • Likely 1.5 million by 2010. • 80% of wells in 3 regions: • Central Valley (31.6%) • Sierra Nevada (31.5%) • North Coast Range (16.6%) • Central Valley estimate: 91,598 WCRs (Johnson and Belitz, 2015) Total wells, NOT active wells
  9. Background & Motivation 9 Previous Work Characterizing Domestic Wells •

    Basin-Scale – Gailey et al., 2018 • Tulare county domestic well failure model • Economic impact analysis • Basin-Scale – London et al., 2018 • Disadvantaged unincorporated communities • Proximity to public water systems • Statewide – Pauloo et al., 2018 (in prep) • 943,469 WCRs cleaned/analyzed • Best estimates of statewide well count/distribution • Cleaned data freely accessible: ucwater.org/oswcr • Central Valley wide domestic well failure model • Drought simulation / SGMA compliance scenarios (Gailey, 2018)
  10. Background & Motivation 10 Previous Work Characterizing Domestic Wells •

    Basin-Scale – Gailey et al., 2018 • Tulare count domestic well failure model • Economic impact analysis • Basin-Scale – London et al., 2018 • Disadvantaged unincorporated communities • Proximity to public water systems • Statewide – Pauloo et al., 2018 (in prep) • 943,469 WCRs cleaned/analyzed • Best estimates of statewide well count/distribution • Cleaned data freely accessible: ucwater.org/oswcr • Central Valley wide domestic well failure model • Drought simulation / SGMA compliance scenarios (London et al.., 2018)
  11. Background & Motivation 11 Previous Work Characterizing Domestic Wells •

    Basin-Scale – Gailey et al., 2018 • Tulare count domestic well failure model • Economic impact analysis • Basin-Scale – London et al., 2018 • Disadvantaged unincorporated communities • Public water systems • Statewide – Pauloo et al., 2018 (in prep) • 943,469 WCRs cleaned/analyzed • Best estimates of statewide well count/distribution • Cleaned data freely accessible: ucwater.org/oswcr • Central Valley wide domestic well failure model • Drought simulation / SGMA compliance scenarios (Pauloo et al., 2018) – in prep
  12. Background & Motivation 12 Ongoing Work: OSWCR Guiding Questions: 1.

    How many active domestic wells are in the Central Valley and where are they located? 2. Where are domestic wells most vulnerable?
  13. Background & Motivation 13 Q1: How many active domestic wells

    are in the Central Valley and where are they located? A1: Examine spatial distribution well type n domestic 356,618 missing 245,048 monitoring 127,296 agriculture 82,907 unused 66,220 remediation 18,146 public 14,831 test well 12,011 cathodic 5,587 industrial 5,080 other 4,914 injection 3,202 stock 1,609 SUM 943,469 ALL WELLS n = 943,469 n = 365,618
  14. Background & Motivation 14 Q1: How many active domestic wells

    are in the Central Valley and where are they located? A1: Examine spatial distribution, consider retirement age domestic wells n = 365,618
  15. Background & Motivation 15 Q1: How many active domestic wells

    are in the Central Valley and where are they located? A1: Examine spatial distribution, consider retirement age n = 100,000 ≥ 41 years old domestic wells n = 339,445
  16. Background & Motivation 16 Q1: How many active domestic wells

    are in the Central Valley and where are they located? A1: Examine spatial distribution, consider retirement age n = 200,000 ≥ 35 years old n = 100,000 ≥ 41 years old domestic wells n = 339,445
  17. Background & Motivation 17 Q1: How many active domestic wells

    are in the Central Valley and where are they located? A1: Examine spatial distribution, consider retirement age n = 300,000 ≥ 15 years old n = 200,000 ≥ 35 years old n = 100,000 domestic wells n = 339,445
  18. Background & Motivation 18 Q1: How many active domestic wells

    are in the Central Valley and where are they located? A1: Examine spatial distribution, consider retirement age domestic wells n = 102,123 35 yr retirement 30 yr retirement 25 yr retirement Annual Count of Completed Wells in the CV
  19. Background & Motivation 19 Q1: How many active domestic wells

    are in the Central Valley and where are they located? A1: Examine spatial distribution, consider retirement age, consider “missing” (undesignated) wells Assume all wells are missing completely at random  proportionally distribute missing well types. Actual active well count lower due to retirement. Scale missing well type domestic well count adjusted dom well count Statewide 245,048 356,618 481,741 Central Valley 54,316 102,123 129,201
  20. Background & Motivation 20 Q1: How many active domestic wells

    are in the Central Valley and where are they located? A1: Examine spatial distribution, consider retirement age, consider “missing” (undesignated) wells Assume all wells are missing completely at random  proportionally distribute missing well types. Scale missing well type domestic well count adjusted dom well count Statewide 245,048 356,618 481,741 Central Valley 54,316 102,123 129,201 Actual active well count lower due to retirement. 20% added 80% original
  21. Background & Motivation 21 Q1: How many active domestic wells

    are in the Central Valley and where are they located? A1: Examine spatial distribution, consider retirement age, consider “missing” (undesignated) wells Final estimates are adjusted for missing wells. n = 35,045 n = 48,959 n = 59,654
  22. Background & Motivation 22 Q2: Where are domestic wells most

    vulnerable? A1: Examine depth properties
  23. Background & Motivation 23 Q2: Where are domestic wells most

    vulnerable? A1: Examine depth properties (drill depth, perforated interval thickness, top of perforated interval).
  24. Background & Motivation 24 Q2: Where are domestic wells most

    vulnerable? A1: Examine depth properties (drill depth, perforated interval thickness, top of perforated interval).
  25. Background & Motivation 25 Q2: Where are domestic wells most

    vulnerable? A1: Examine depth properties (drill depth, perforated interval thickness, top of perforated interval). “Entryway” for contaminants migrating from the top-down: nitrates, salts 0
  26. Background & Motivation 26 Q2: Where are domestic wells most

    vulnerable? A1: Examine depth properties (drill depth, perforated interval thickness, top of perforated interval). “Entryway” for contaminants migrating from the top-down: nitrates, salts 1
  27. Background & Motivation 27 Q2: Where are domestic wells most

    vulnerable? A1: Examine depth properties (drill depth, perforated interval thickness, top of perforated interval). “Entryway” for contaminants migrating from the top-down: nitrates, salts 2
  28. Background & Motivation 28 Q2: Where are domestic wells most

    vulnerable? A1: Examine depth properties (drill depth, perforated interval thickness, top of perforated interval). “Entryway” for contaminants migrating from the top-down: nitrates, salts 3
  29. Background & Motivation 29 Q2: Where are domestic wells most

    vulnerable? A1: Examine depth properties (drill depth, perforated interval thickness, top of perforated interval). Top/Bottom of Perforated Interval missing for ~50% of CV data. But Total Completed Depth is present for nearly 100% of samples! Use simple linear model to impute bottom. Use simple linear model to impute top. Domestic wells in the Central Valley
  30. Background & Motivation 30 Q2: Where are domestic wells most

    vulnerable? A1: Examine depth properties (drill depth, perforated interval thickness, top of perforated interval). Top/Bottom of Perforated Interval missing for ~50% of CV data. But Total Completed Depth is present for nearly 100% of samples! Use simple linear model to impute bottom. Use simple linear model to impute top. Domestic wells in the Central Valley
  31. Background & Motivation 31 Q2: Where are domestic wells most

    vulnerable? A1: Examine depth properties (drill depth, perforated interval thickness, top of perforated interval). Top/Bottom of Perforated Interval missing for ~50% of CV data. But Total Completed Depth is present for nearly 100% of samples! Use simple linear model to impute bottom. Use simple linear model to impute top.
  32. Background & Motivation 32 Q2: Where are domestic wells most

    vulnerable? A1: Examine depth properties (drill depth, perforated interval thickness, top of perforated interval). Top/Bottom of Perforated Interval missing for ~50% of CV data. But Total Completed Depth is present for nearly 100% of samples! Use simple linear model to impute bottom. Use simple linear model to impute top.
  33. Background & Motivation 33 Q2: Where are domestic wells most

    vulnerable? A1: Examine depth properties (drill depth, perforated interval thickness, top of perforated interval). Groundwater Sustainability Agency Public Land Survey Township (36 2) Median Top of Perforated Interval (ft)
  34. Background & Motivation 34 • Motivation: ~2,500 reported CV domestic

    well failures during 2012-2016 drought • Questions: 1. How would a future extended drought affect domestic well failure in California’s Central Valley? 2. Are well failures more associated with particular social drivers of vulnerability, like income? Case Study using OWCR data (3 minutes) Winning submission to the 2018 California Water Data Challenge: goo.gl/D5fLwY
  35. Background & Motivation 35 Approach: • Develop a Central Valley

    wide spatially-explicit well failure model • Calibrate to 2012-2016 observed failure • Simulate 1, 2, 3, 4 year droughts by scaling 2012-2016 drought by 0.25, 0.50, 0.75, 1.00 • Identify economic status of populations and compare impact + + + Domestic well data Groundwater level data Census tract data Water System Boundaries
  36. Background & Motivation 40 1 year 2 years 3 years

    4 years Results: Extended drought ( = January 2017)
  37. Background & Motivation 41 29 345 776 2,027 3,150 4,120

    4,984 5,830 Results: Extended drought ( = January 2017)
  38. Background & Motivation 42 Results: 2012-2016 drought SE Impact income_level

    n_well_failures MHI+ 941 DAC 602 SDAC 826 = 1.52 1428 941 _____ ~ 1.5 times more well failures were reported by households in disadvantaged (DAC) and severely disadvantaged (SDAC) census tracts, compared to communities at or above the Median Household Income (MHI+).
  39. Background & Motivation 43 income_level median_d (miles) MHI+ 1.50 DAC

    1.44 SDAC 0.85 More than half of well failures in SDACs were less than 1 mile from a water system. Some well failures are relatively remote. Results: 2012-2016 drought SE Impact
  40. Background & Motivation 44 Web Application • Download clean OSWCR

    data: ucwater.org/oswcr/ • Cleaning script: goo.gl/MthQQd • Used by researchers, consultants at: • UC Davis • Stanford • Pacific Institute • Community Water Center • Tully & Young • Youtube video
  41. Background & Motivation 45 Conclusion: Towards an assessment of Central

    Valley domestic well vulnerability to water quality contamination + + Domestic Well Data Contaminant Data Social/Demographic Data … … …
  42. Conclusions • There are ~120,000 domestic WCRs in the Central

    Valley. Assuming a moderate retirement age of 25-35 years and accounting for missing well types, active well estimate is ~35,000 – 60,000. • Key WCR information that informs water quality vulnerability includes: well location (x, y), and top of the screened interval (z). • A simple data-driven spatial/geographic approach leveraging existing datasets (e.g. – OSWCR, salt, nitrate) can provide a rapid first-order estimate of the count and distribution of vulnerable domestic wells.
  43. Thank You for your Attention! Acknowledgements: state-led open data initiatives,

    Rob Gailey, Debbie Franco, Ben Breezing, Alvar Escriva Bou, Herve Guillon, Amanda Fencl, Thomas Harter, Graham Fogg, Darcy Bostic, Nisha Marwaha Resources: • OSWCR Exploratory Data Analysis: goo.gl/MthQQd • 2018 California Water Data Challenge: goo.gl/D5fLwY • OSCWR data download tool: ucwater.org/oswcr/ richpauloo.github.io @RichPaulooo goo.gl/DDjT8e
  44. Statewide well type n domestic 356,618 missing 245,048 monitoring 127,296

    agriculture 82,907 unused 66,220 remediation 18,146 public 14,831 test well 12,011 cathodic 5,587 industrial 5,080 other 4,914 injection 3,202 stock 1,609 SUM 943,469 Table 1: Count of well types across CA. Statewide Central Valley well type n n+missing n n+missing domestic 356,618 481,741 102,123 129,201 monitoring 127,296 171,959 46,779 59,182 agriculture 82,907 111,996 22,168 28,046 unused 66,220 89,454 16,906 21,389 remediation 18,146 24,513 3,935 4,978 public 14,831 20,035 3,848 4,868 test well 12,011 16,225 3,336 4,221 cathodic 5,587 7,547 2,056 2,601 industrial 5,080 6,862 1,501 1,899 other 4,914 6,638 1,026 1,298 injection 3,202 4,325 632 800 stock 1,609 2,174 540 683 Table 2: Count of well types across CA and CV adjusted for missing wells. Appendix
  45. Appendix Figure 1: (A) Annual count of all wells drilled

    in Bulletin 118 basins. (B) Same as (A), but broken down by the 4 most common well types. (A) (B)
  46. Appendix Table 3: Linear model coefficients and goodness of fit

    for top v bottom. bot v tot_completed_depth top v bot Basin_Subb 5-22.14 124.9 0.63 0.65 46.97 0.5 0.49 5-22.10 -8.51 1 1 129.83 0.37 0.43 5-22.13 8.28 0.9 0.86 -9.3 0.66 0.71 5-22.12 100.1 0.52 0.56 -4.33 0.82 0.88 5-22.11 13.86 0.8 0.61 -16.83 0.66 0.51 5-22.09 25.79 0.91 0.97 -23.88 0.84 0.85 5-22.08 44.35 0.66 0.61 0.25 0.68 0.6 5-22.05 -4.15 0.99 0.93 53.25 0.57 0.31 5-22.06 62.08 0.79 0.65 -18.62 0.83 0.56 5-22.04 41.11 0.75 0.74 -6.83 0.92 0.85 5-22.03 0.11 0.97 0.94 -2.89 0.87 0.85 5-22.07 8.33 0.93 0.92 -2.17 0.85 0.87 5-22.02 27.04 0.82 0.83 -5.78 0.88 0.83 02-06 -0.27 0.94 0.97 49.83 0.14 0.18 2-05 -3.42 0.99 0.98 2.05 0.45 0.35 5-22.15 15.74 0.8 0.86 -0.08 0.84 0.89 5-22.01 40.93 0.76 0.75 37.37 0.65 0.6 2-03 11.27 0.85 0.87 1.25 0.49 0.57 5-22.16 56.56 0.74 0.66 -3.89 0.78 0.61 5-21.66 11.21 0.89 0.88 8.08 0.55 0.56 5-21.65 -5.88 0.91 0.91 22.19 0.6 0.62 5-21.67 5.43 0.9 0.91 -0.83 0.79 0.8 5-21.68 -1.53 0.88 0.85 -5.09 0.78 0.8 5-21.64 60.34 0.5 0.46 11.57 0.57 0.55 5-21.61 13.13 0.73 0.78 41.46 0.35 0.46 5-21.62 12.58 0.76 0.66 -27.29 0.95 0.75 5-21.59 -4.97 1 0.96 -6.06 0.64 0.65 5-21.58 17.02 0.88 0.81 29.77 0.53 0.54 5-21.52 10.25 0.91 0.93 24.06 0.65 0.67 5-21.51 0.02 0.99 0.96 14.97 0.74 0.76 5-21.57 -9.17 1.02 0.96 -39.64 0.88 0.77 5-21.56 -4.12 1.01 0.99 6.74 0.68 0.8 5-21.55 5.17 0.85 0.65 -0.48 0.74 0.66 5-21.54 38.19 0.6 0.72 56.12 0.15 0.12 5-21.50 -2.92 1 0.98 -8.42 0.9 0.92 5-21.53 5.64 0.93 0.93 -27.15 0.94 0.91 5-06.01 -1.76 0.99 0.98 9.38 0.78 0.85 5-06.02 0.72 0.99 1 -6.59 0.85 0.84 5-06.03 8.43 0.93 0.94 5.83 0.76 0.78 5-06.05 -5.71 0.99 0.93 -17.93 0.89 0.86 5-06.04 2.57 0.95 0.9 -6.62 0.83 0.85 5-21.60 12.18 0.83 0.75 19.17 0.43 0.43
  47. Background & Motivation 54 Don’t forget! • We’ve only been

    talking about Central Valley domestic wells! • ~350,000 domestic wells outside of CV (including missing wells) • Population = upwards of 1 million • Loss of alpine snowpack ALSO threatens alpine granitic/volcanic aquifers • different water retention properties = different “breaking points” (Markovich et al., 2016) n ~ 129,201 n ~ 352,540 Missing well adjusted counts, no culling on retirement