a case-study in cystic fibrosis Ruth Keogh Department of Medical Statistics London School of Hygiene & Tropical Medicine Improving health worldwide www.lshtm.ac.uk
chronic, progressive condition • Affects ~10,000 people in the UK • 1 in 2500 live births affected • Estimated median survival age in the UK is 47 The UK CF Registry • Established 1995, web-based since 2007 • Longitudinal data obtained at annual visits - clinical measurements - hospital stays - treatments used
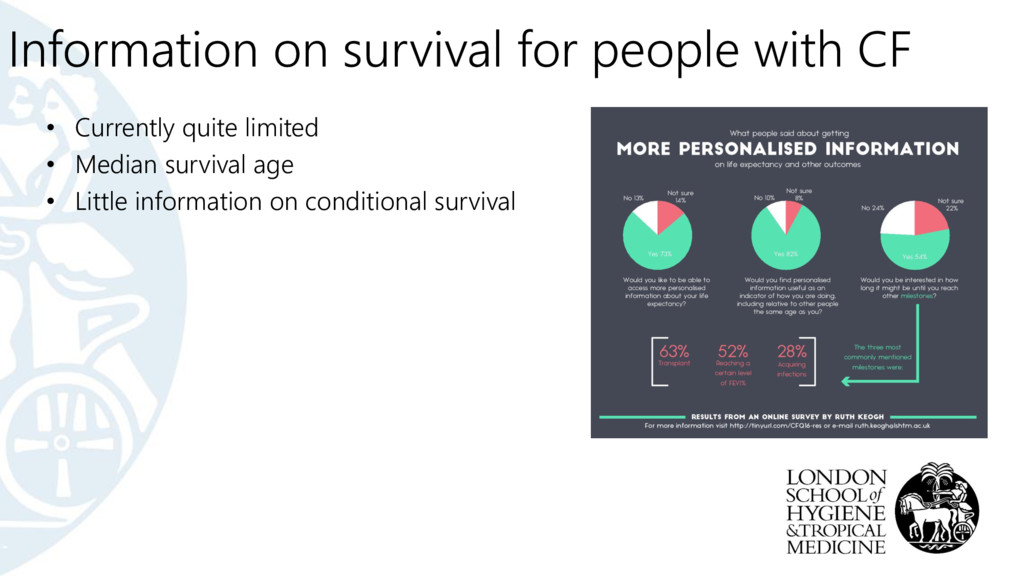
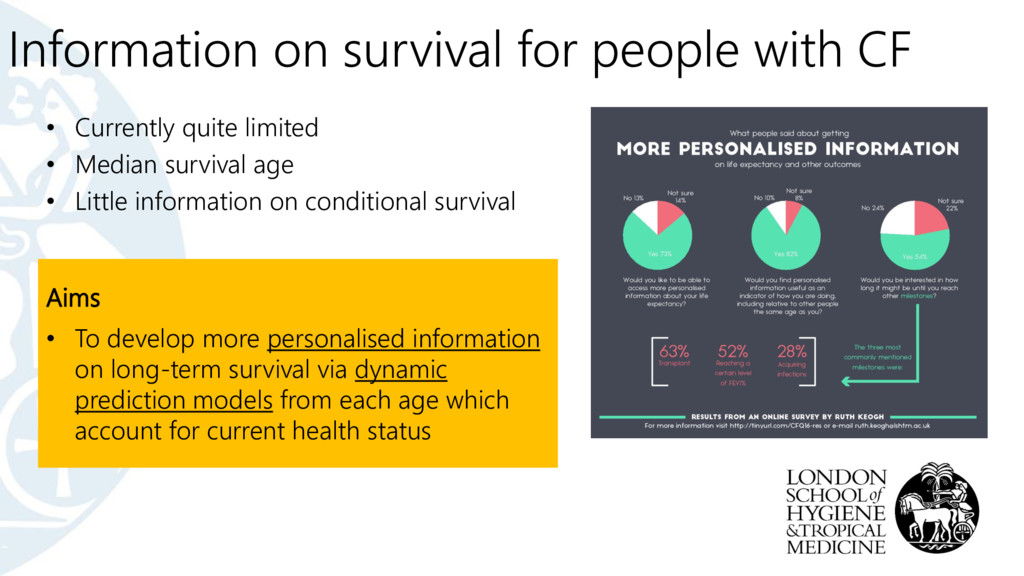
limited • Median survival age • Little information on conditional survival Aims • To develop more personalised information on long-term survival via dynamic prediction models from each age which account for current health status
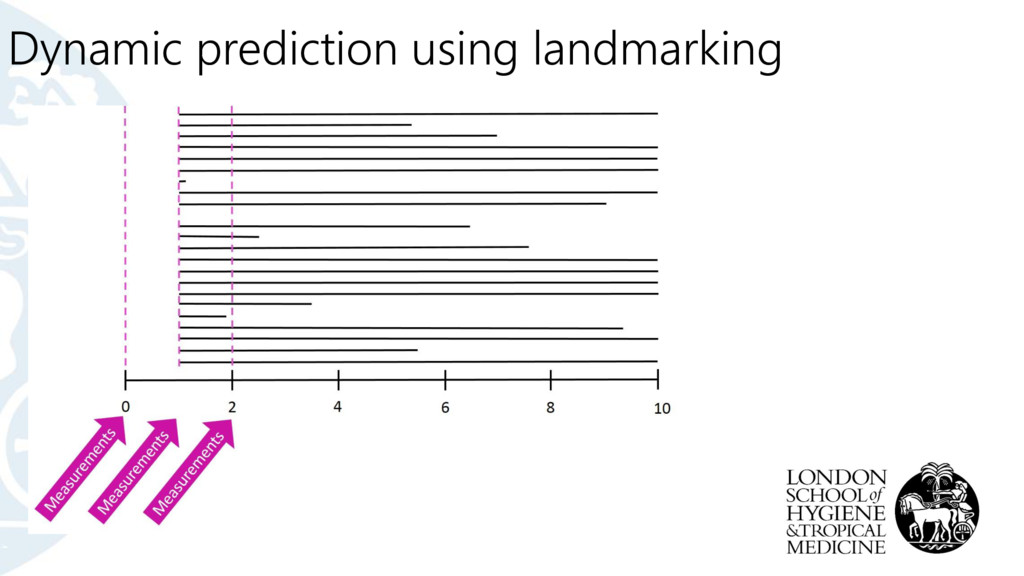
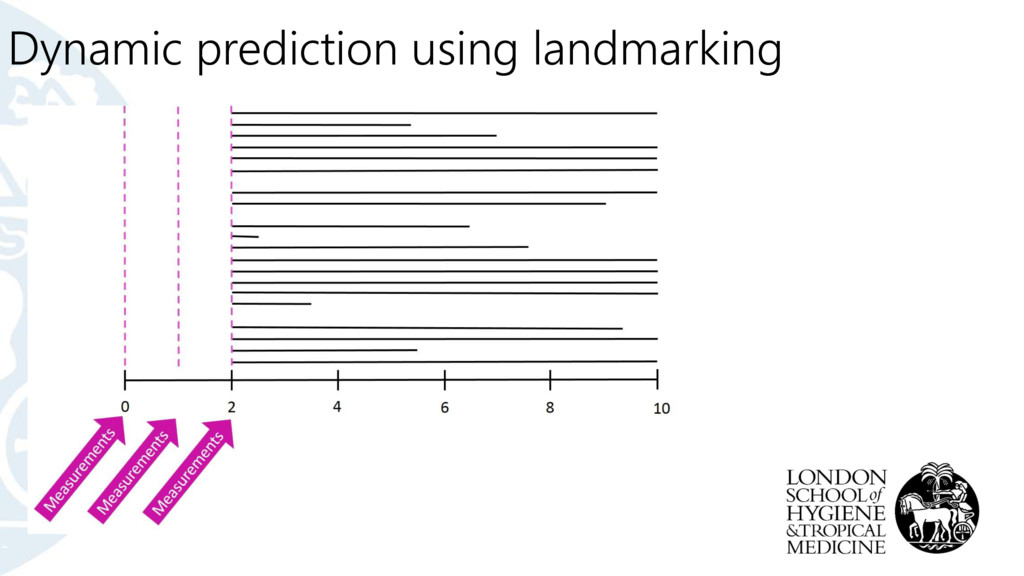
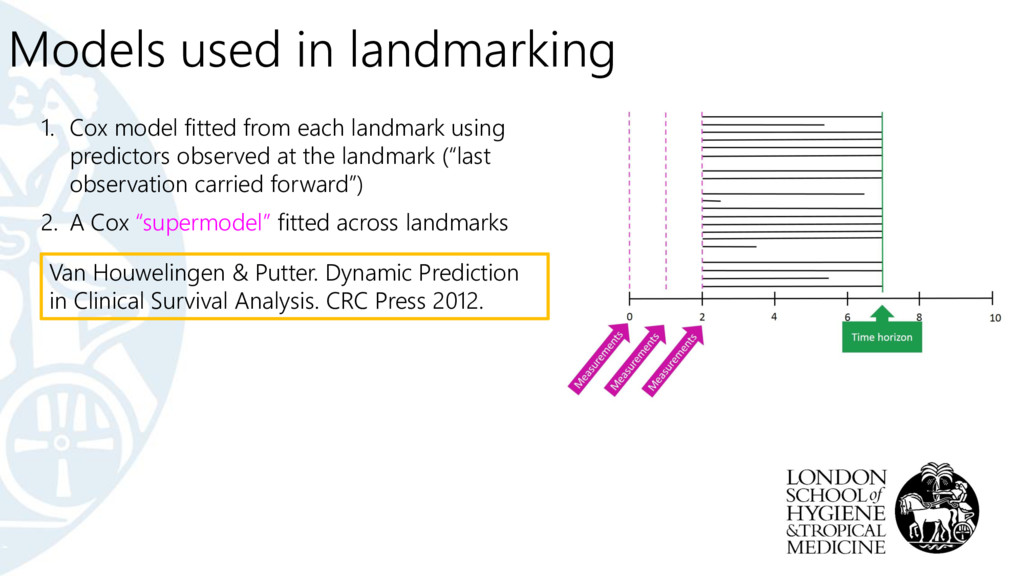
landmark using predictors observed at the landmark (“last observation carried forward”) 2. A Cox “supermodel” fitted across landmarks Van Houwelingen & Putter. Dynamic Prediction in Clinical Survival Analysis. CRC Press 2012.
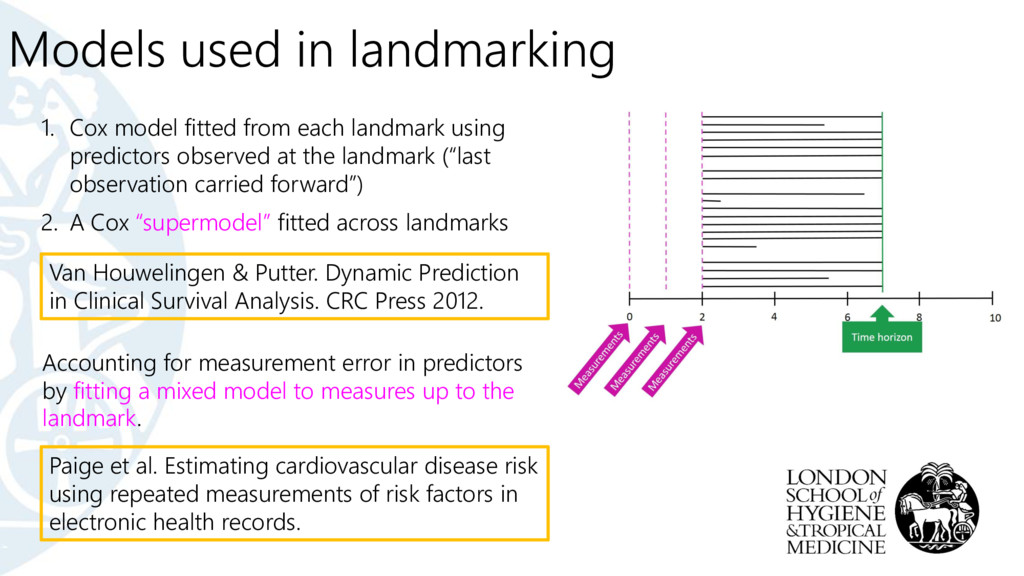
landmark using predictors observed at the landmark (“last observation carried forward”) 2. A Cox “supermodel” fitted across landmarks Van Houwelingen & Putter. Dynamic Prediction in Clinical Survival Analysis. CRC Press 2012. Accounting for measurement error in predictors by fitting a mixed model to measures up to the landmark. Paige et al. Estimating cardiovascular disease risk using repeated measurements of risk factors in electronic health records.
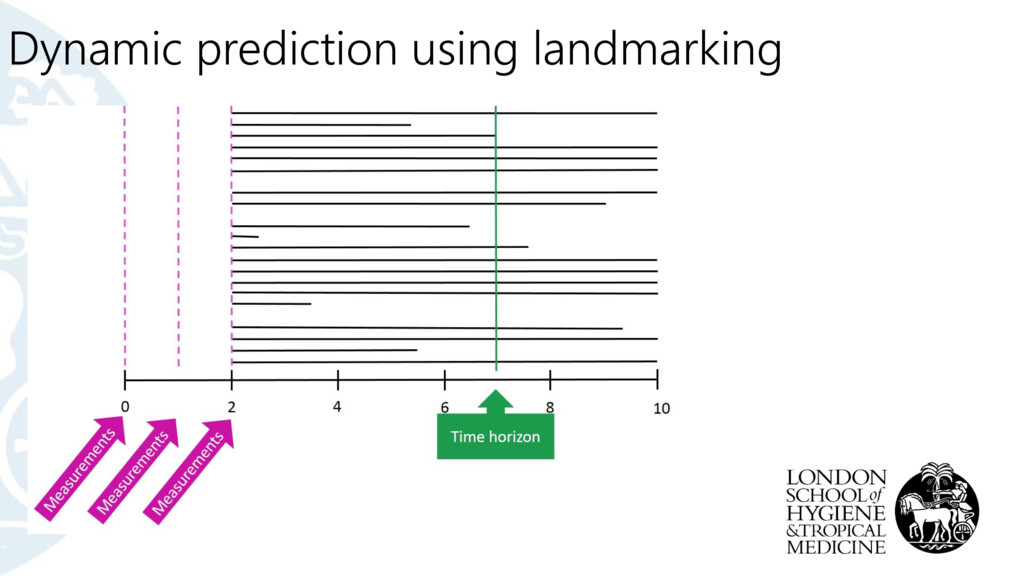
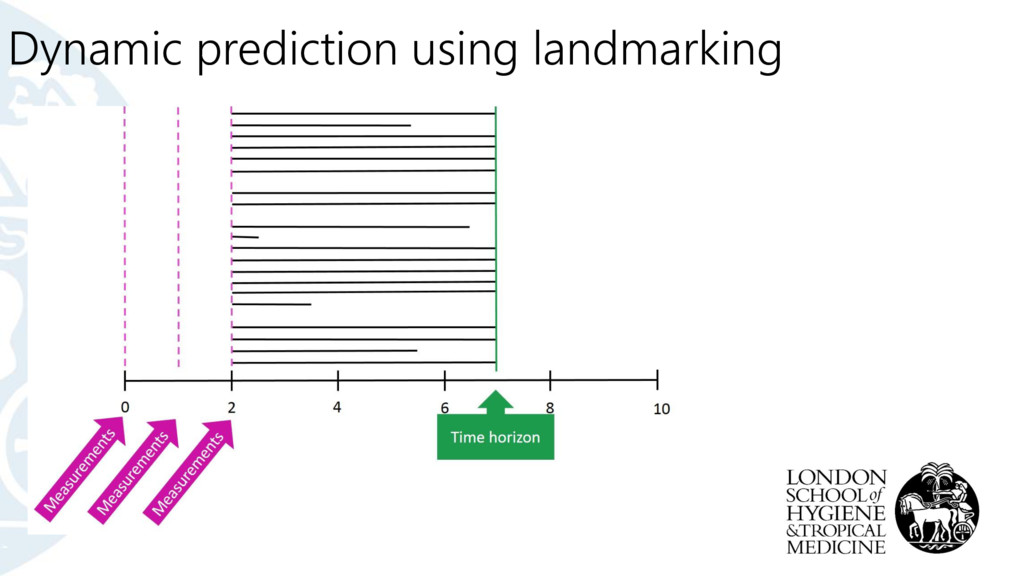
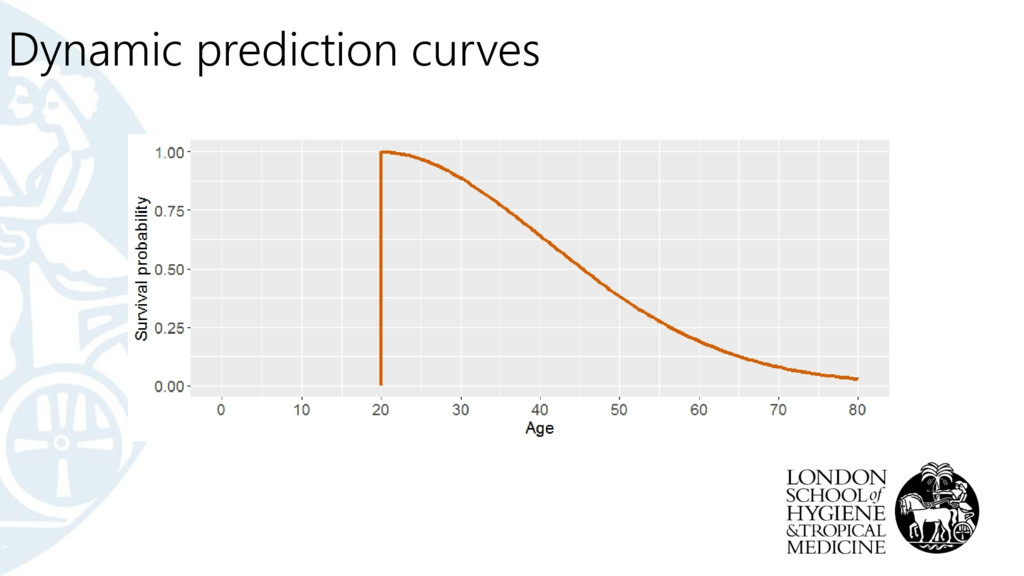
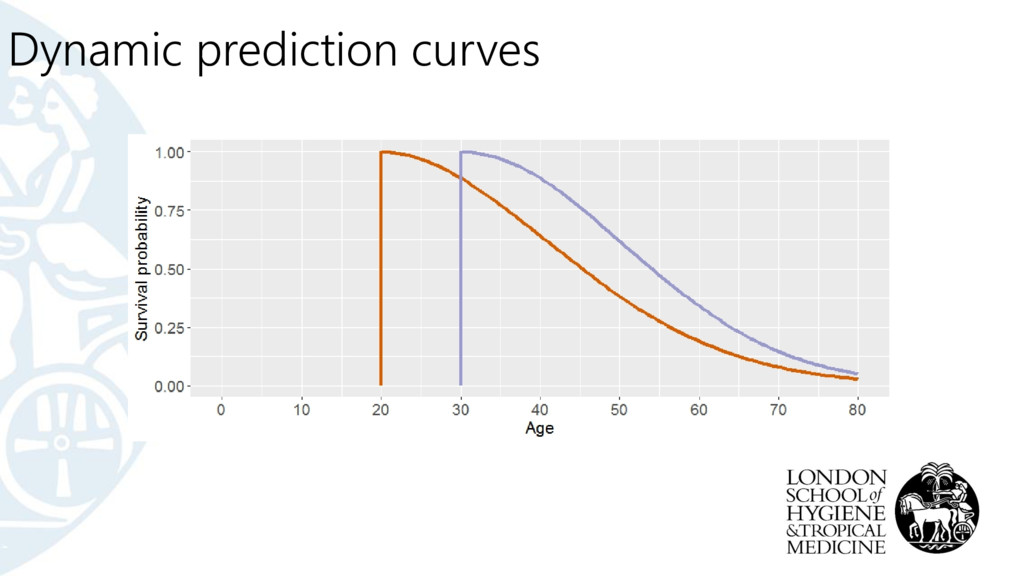
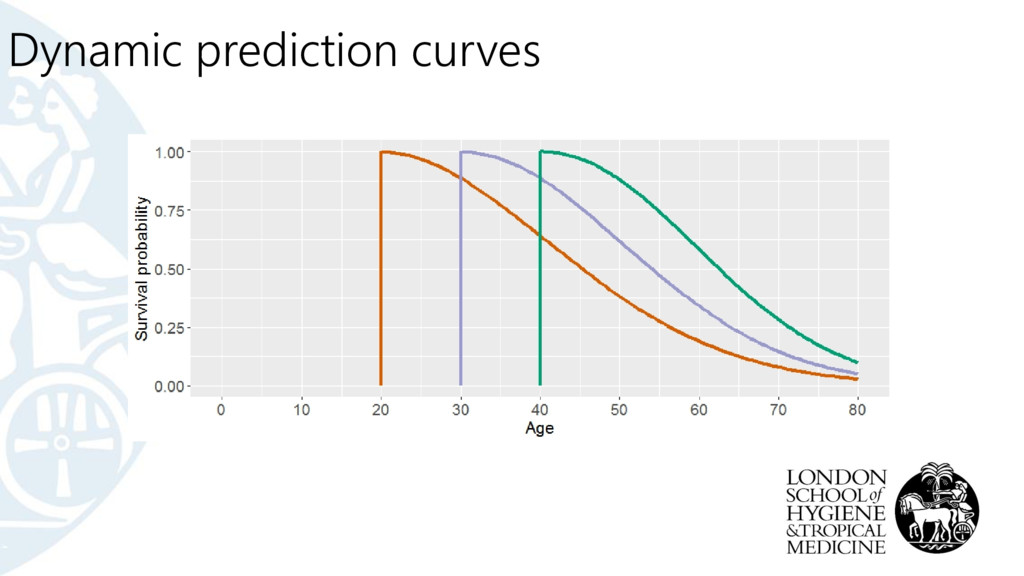
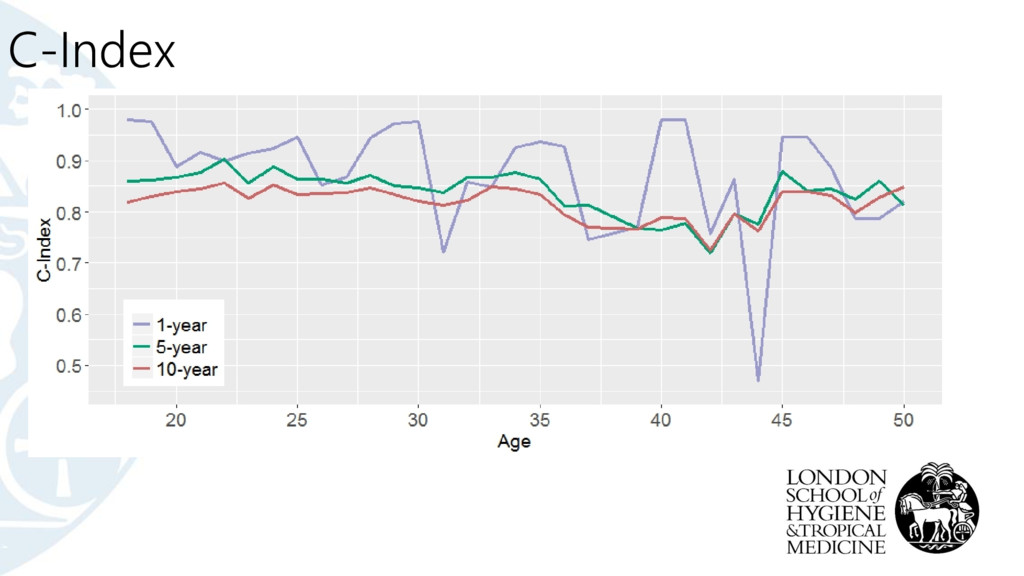
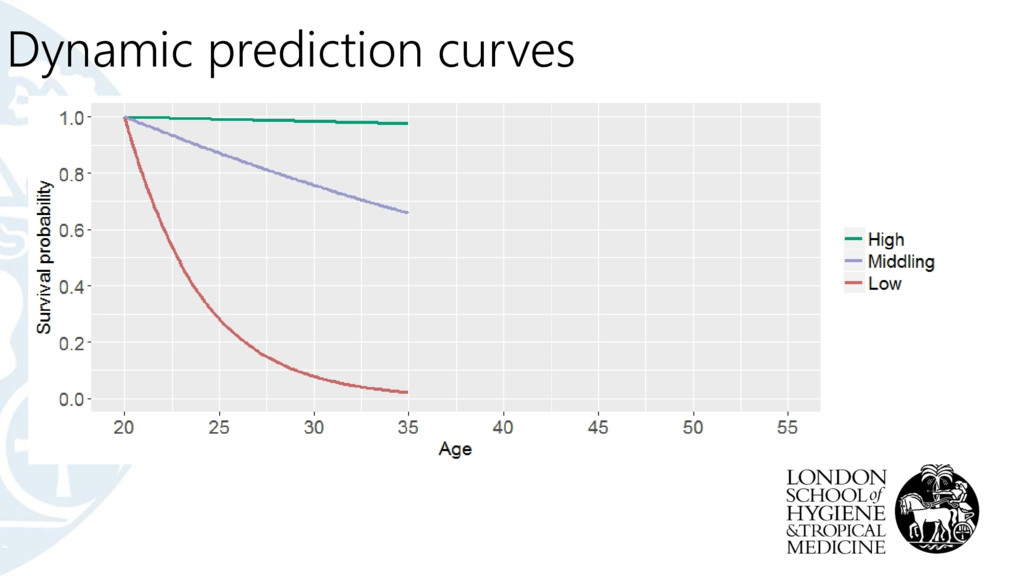
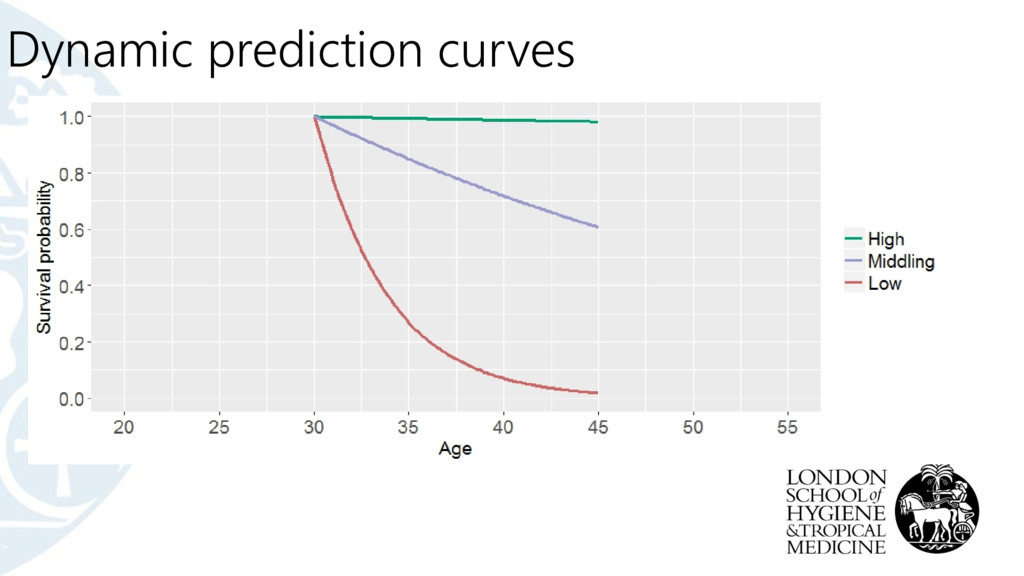
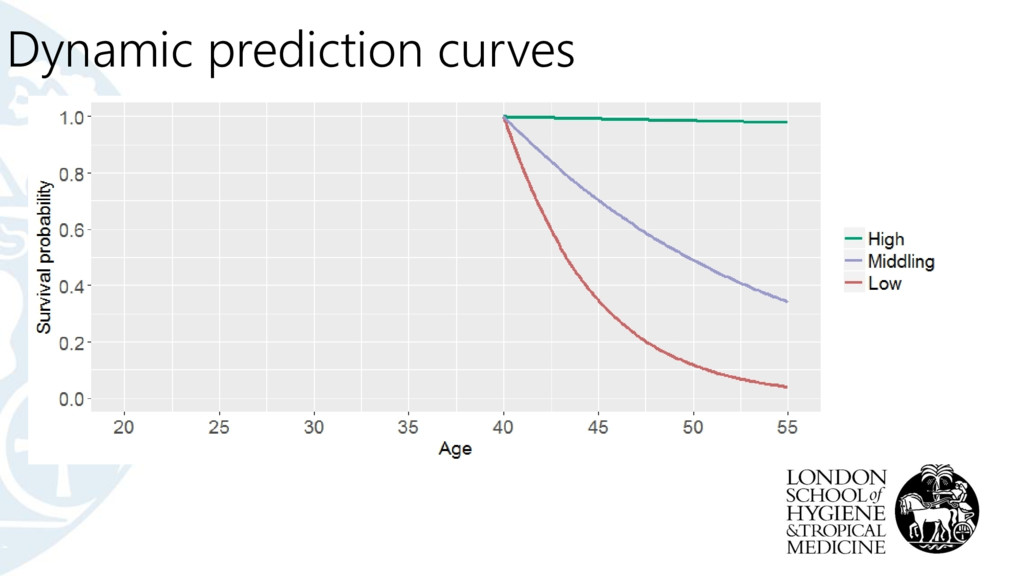
single time horizon • But we are often interested in several time horizons - 1 year, 5 years, 10 years • Fitting several models for a series of time horizons is inefficient and could lead to inconsistent estimates Dynamic prediction curves
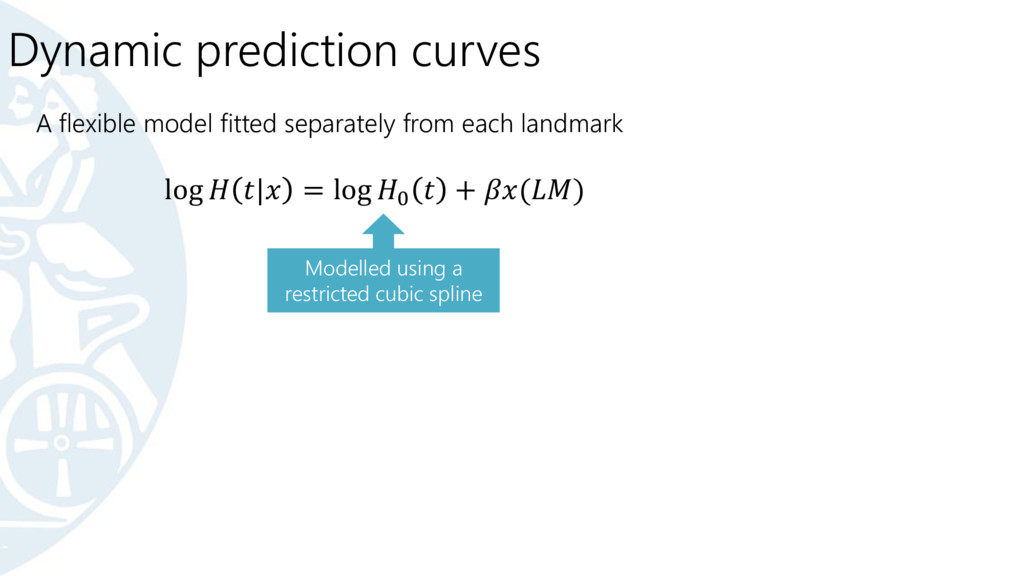
single time horizon • But we are often interested in several time horizons - 1 year, 5 years, 10 years • Fitting several models for a series of time horizons is inefficient and could lead to inconsistent estimates Use of flexible parametric models (Royston & Parmar 2002) • Cox models are typically used in landmarking • Smooth curves are desirable for prediction • A fully parametric model is easier to report Dynamic prediction curves
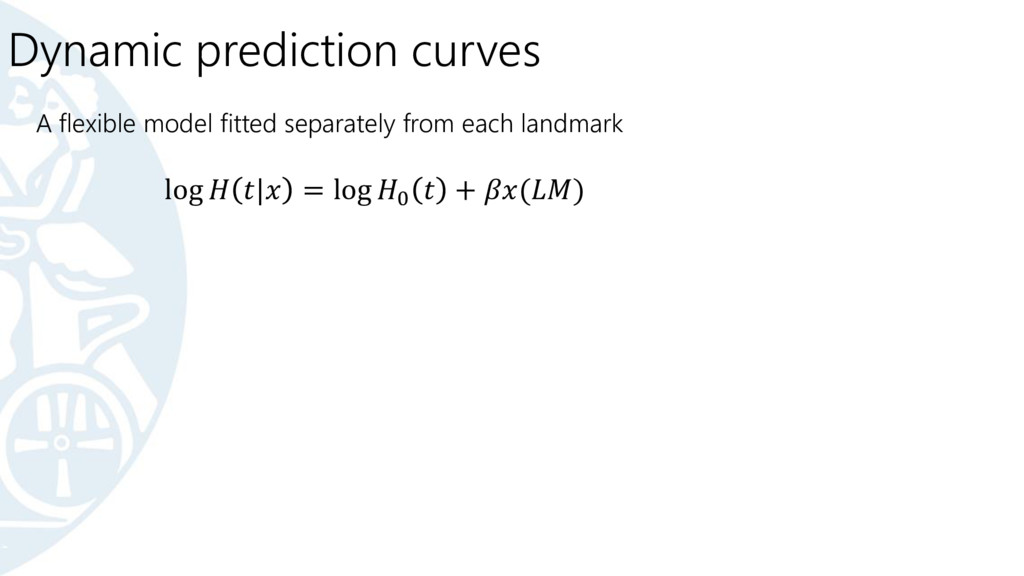
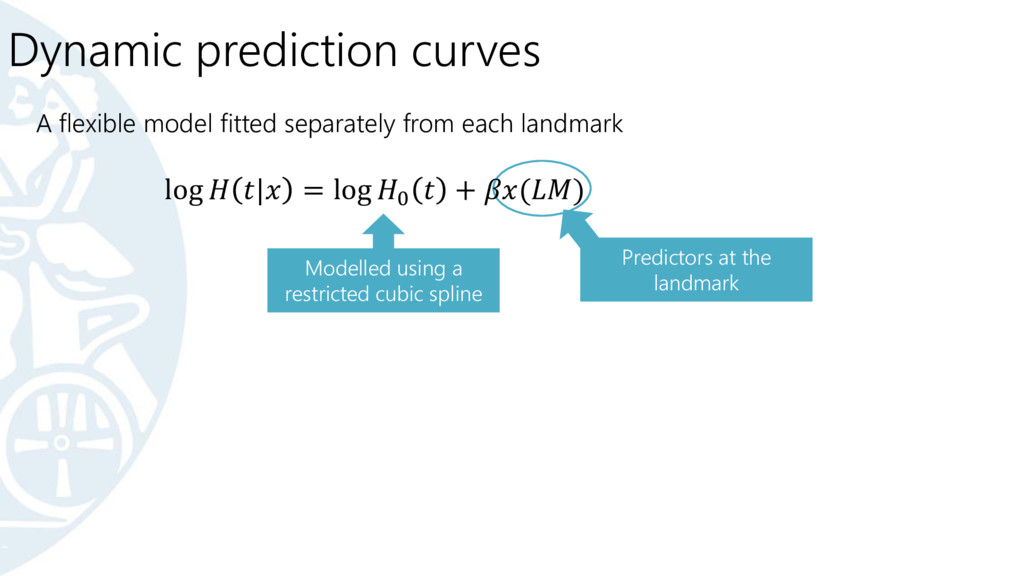
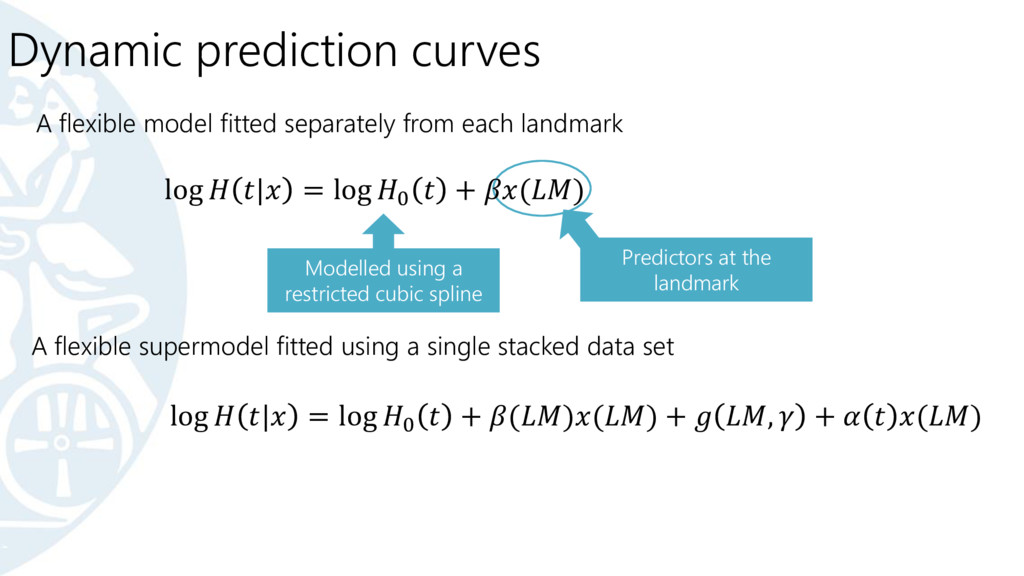
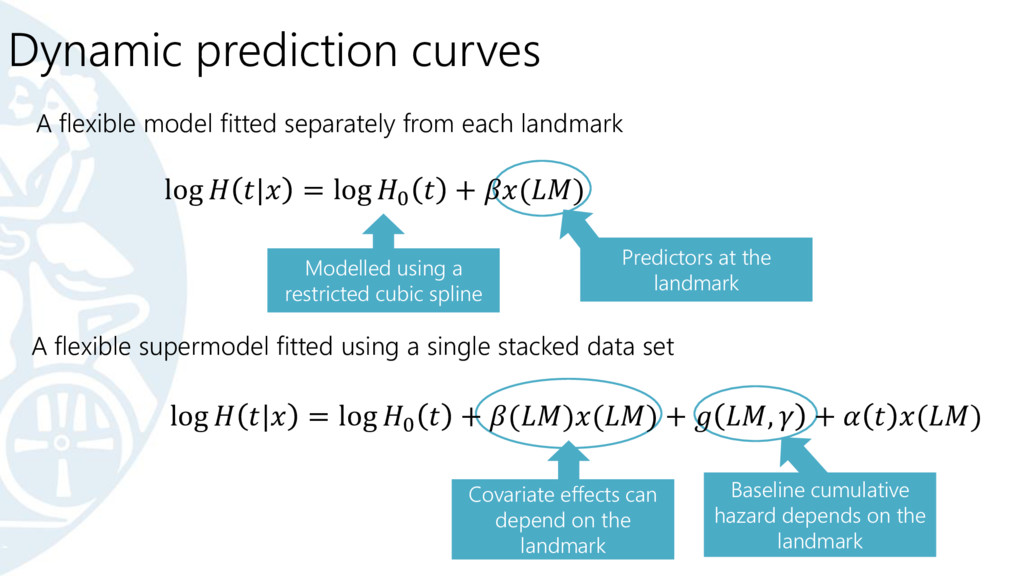
A flexible model fitted separately from each landmark A flexible supermodel fitted using a single stacked data set log | = log 0 + ()() + , + () Modelled using a restricted cubic spline Predictors at the landmark
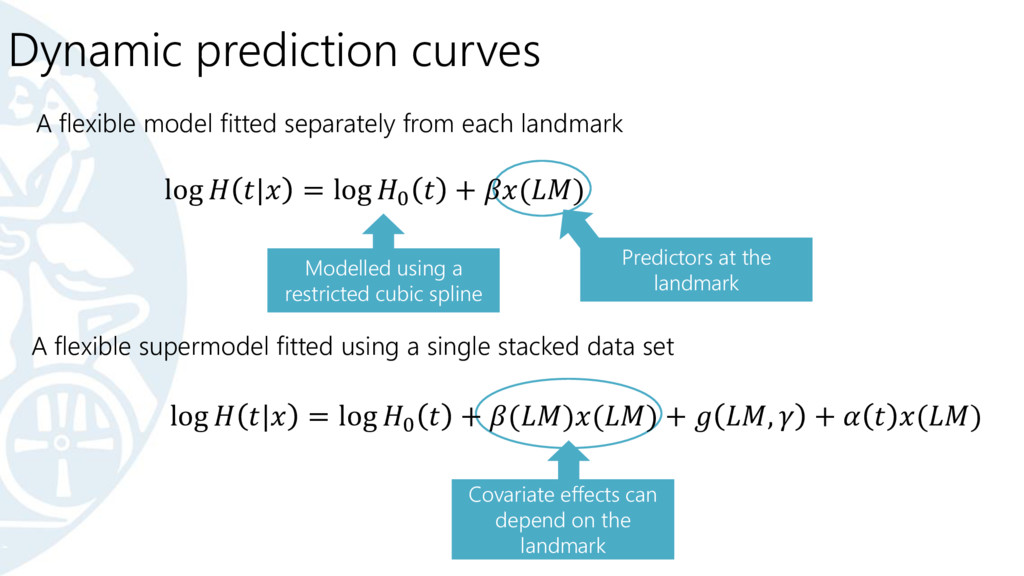
A flexible model fitted separately from each landmark A flexible supermodel fitted using a single stacked data set Covariate effects can depend on the landmark log | = log 0 + ()() + , + () Modelled using a restricted cubic spline Predictors at the landmark
A flexible model fitted separately from each landmark A flexible supermodel fitted using a single stacked data set Covariate effects can depend on the landmark log | = log 0 + ()() + , + () Modelled using a restricted cubic spline Predictors at the landmark Baseline cumulative hazard depends on the landmark
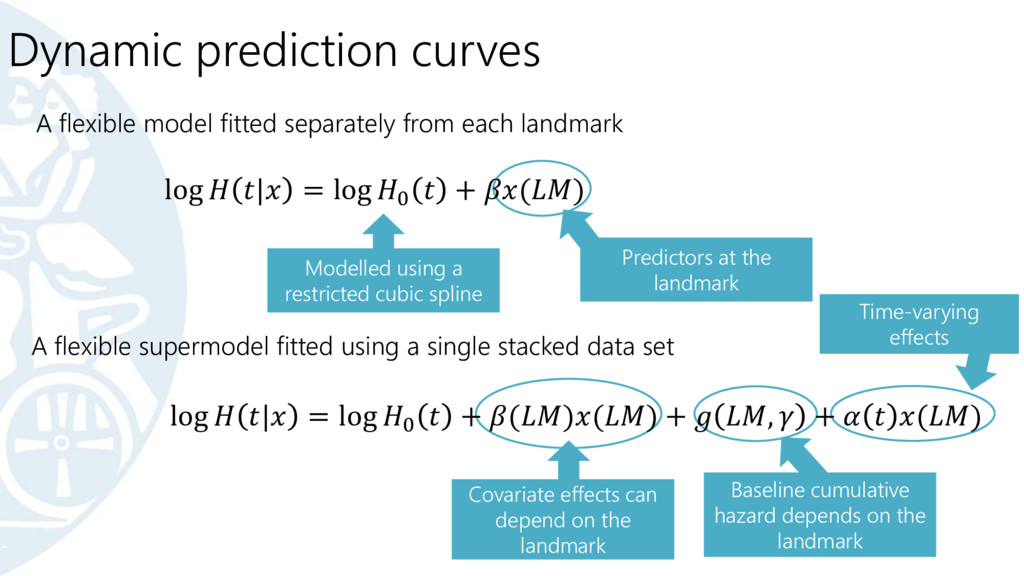
A flexible model fitted separately from each landmark A flexible supermodel fitted using a single stacked data set Covariate effects can depend on the landmark log | = log 0 + ()() + , + () Modelled using a restricted cubic spline Predictors at the landmark Baseline cumulative hazard depends on the landmark Time-varying effects
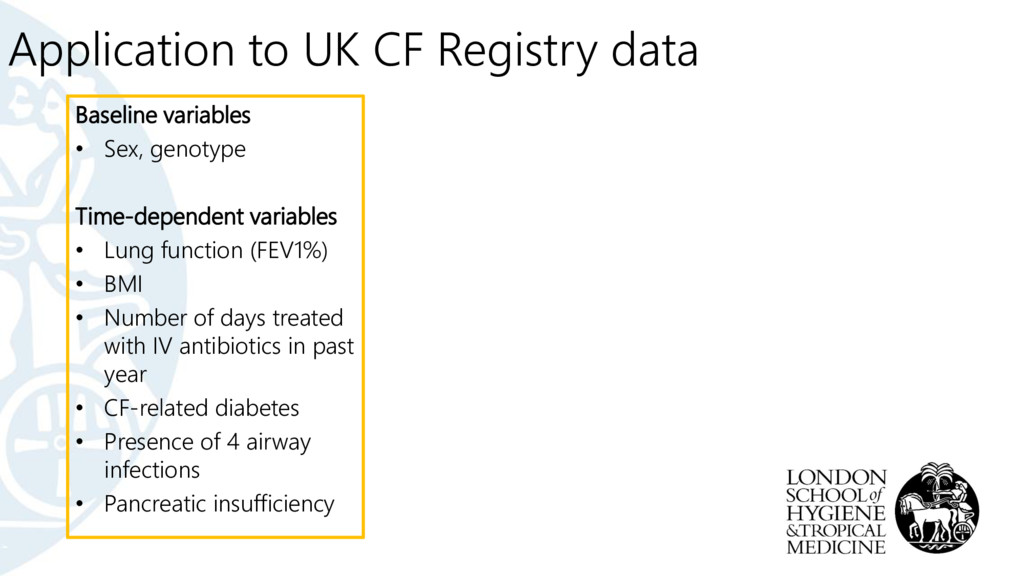
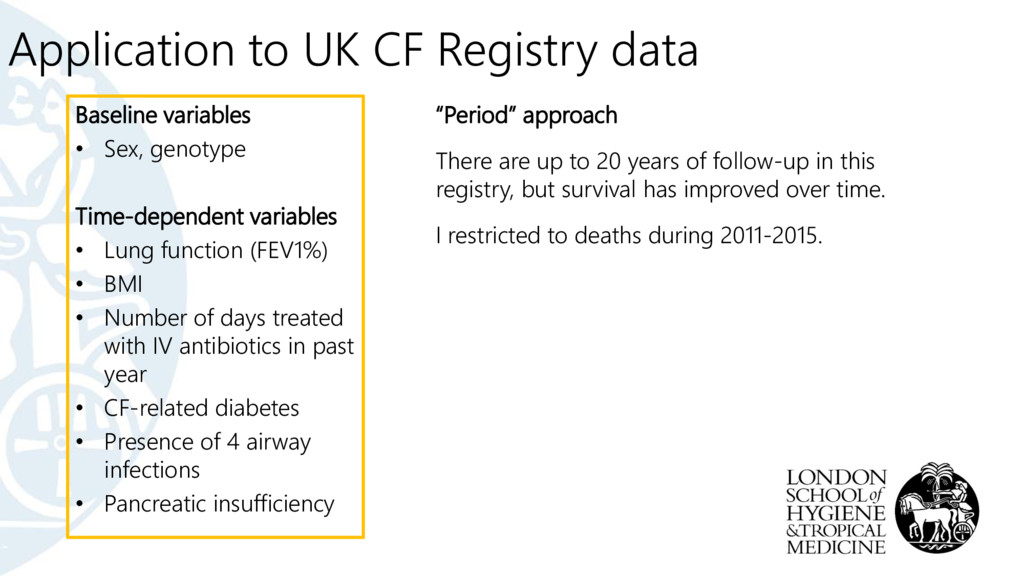
genotype Time-dependent variables • Lung function (FEV1%) • BMI • Number of days treated with IV antibiotics in past year • CF-related diabetes • Presence of 4 airway infections • Pancreatic insufficiency
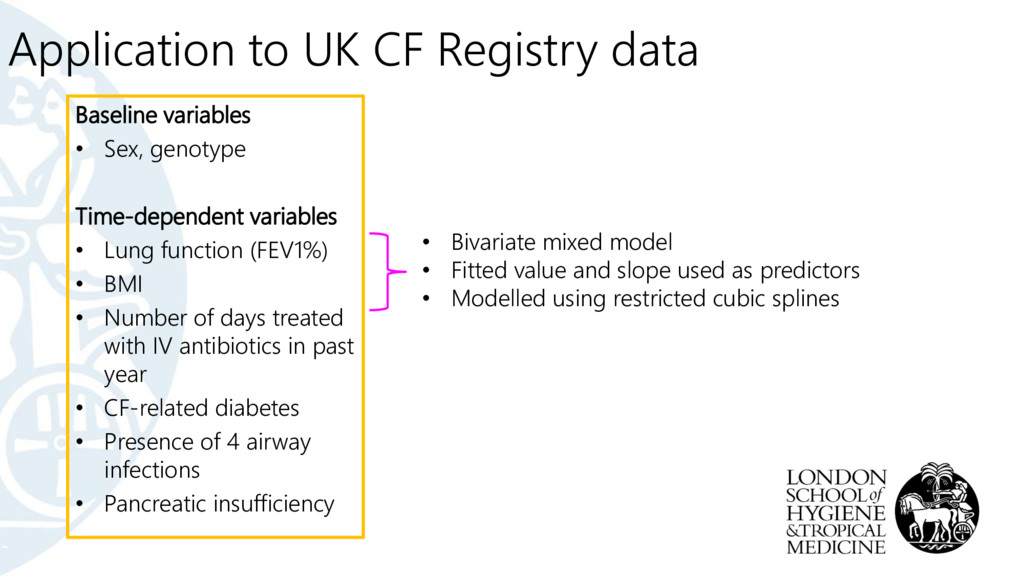
genotype Time-dependent variables • Lung function (FEV1%) • BMI • Number of days treated with IV antibiotics in past year • CF-related diabetes • Presence of 4 airway infections • Pancreatic insufficiency • Bivariate mixed model • Fitted value and slope used as predictors • Modelled using restricted cubic splines
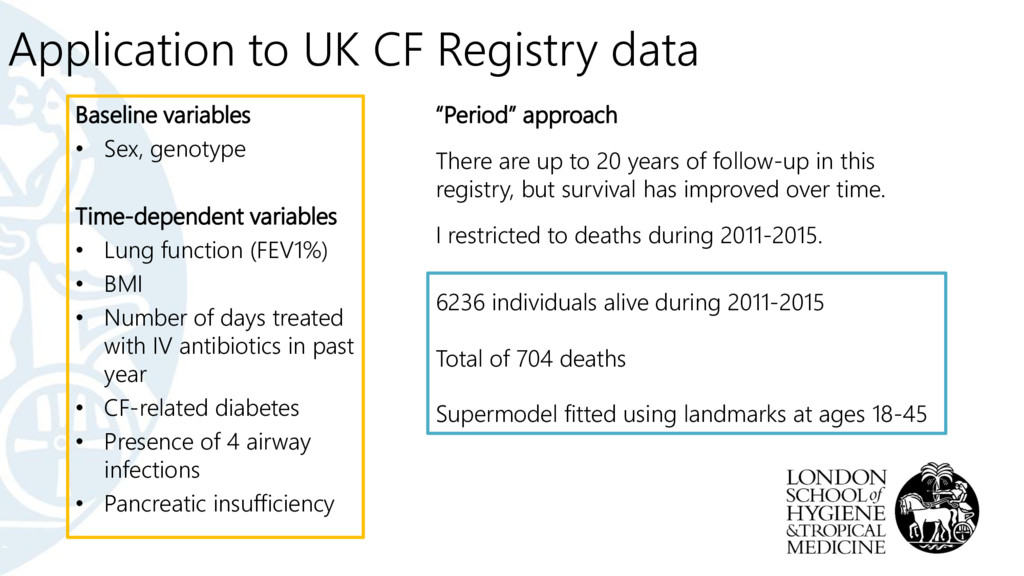
genotype Time-dependent variables • Lung function (FEV1%) • BMI • Number of days treated with IV antibiotics in past year • CF-related diabetes • Presence of 4 airway infections • Pancreatic insufficiency “Period” approach There are up to 20 years of follow-up in this registry, but survival has improved over time. I restricted to deaths during 2011-2015.
genotype Time-dependent variables • Lung function (FEV1%) • BMI • Number of days treated with IV antibiotics in past year • CF-related diabetes • Presence of 4 airway infections • Pancreatic insufficiency “Period” approach There are up to 20 years of follow-up in this registry, but survival has improved over time. I restricted to deaths during 2011-2015. 6236 individuals alive during 2011-2015 Total of 704 deaths Supermodel fitted using landmarks at ages 18-45
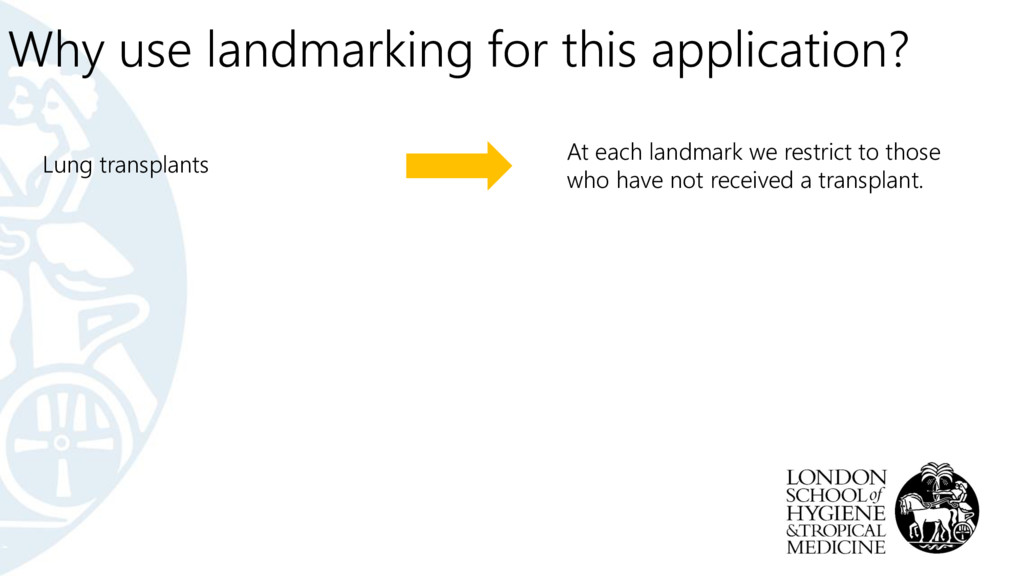
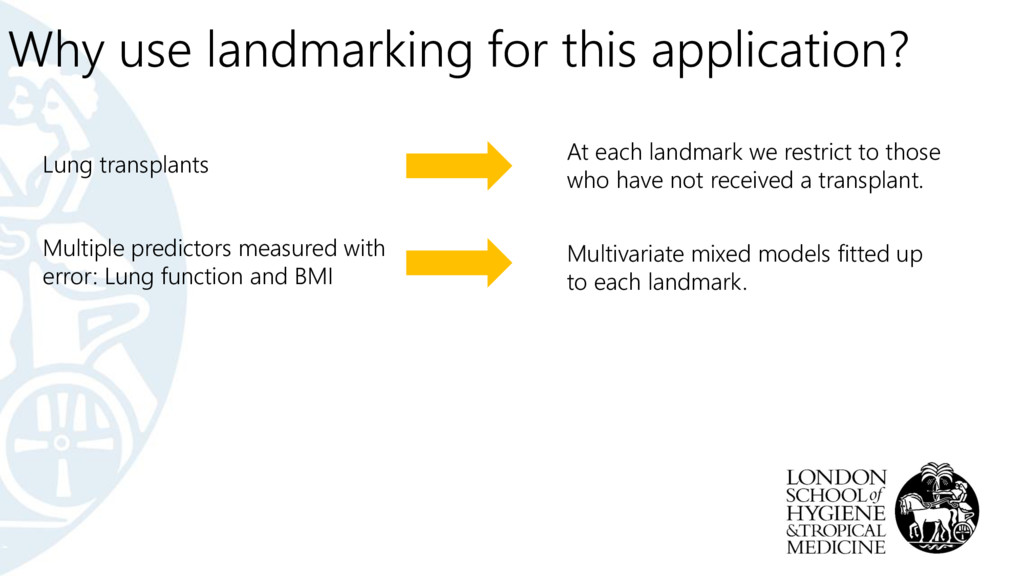
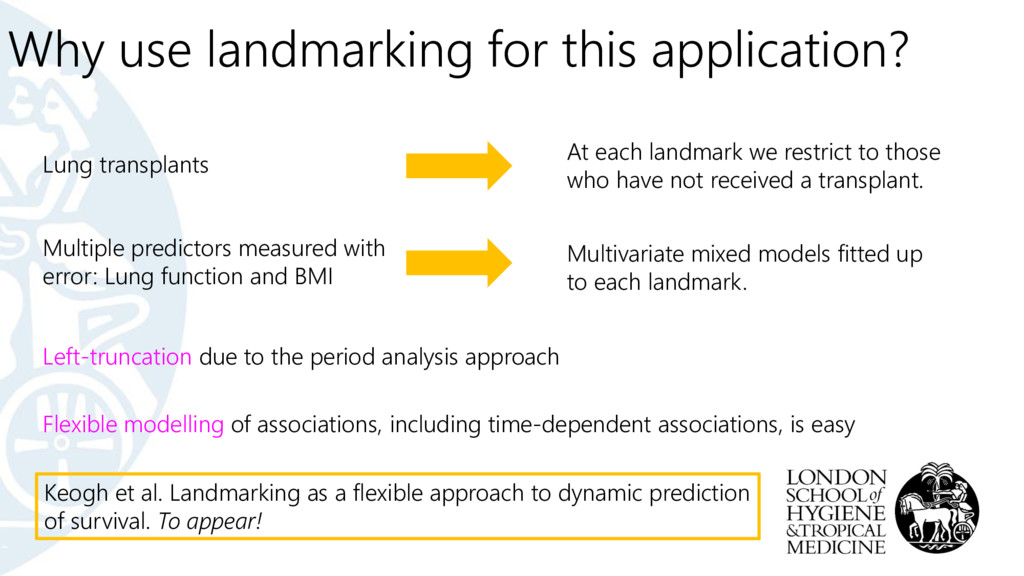
landmark we restrict to those who have not received a transplant. Multivariate mixed models fitted up to each landmark. Multiple predictors measured with error: Lung function and BMI
landmark we restrict to those who have not received a transplant. Left-truncation due to the period analysis approach Flexible modelling of associations, including time-dependent associations, is easy Multivariate mixed models fitted up to each landmark. Multiple predictors measured with error: Lung function and BMI Keogh et al. Landmarking as a flexible approach to dynamic prediction of survival. To appear!
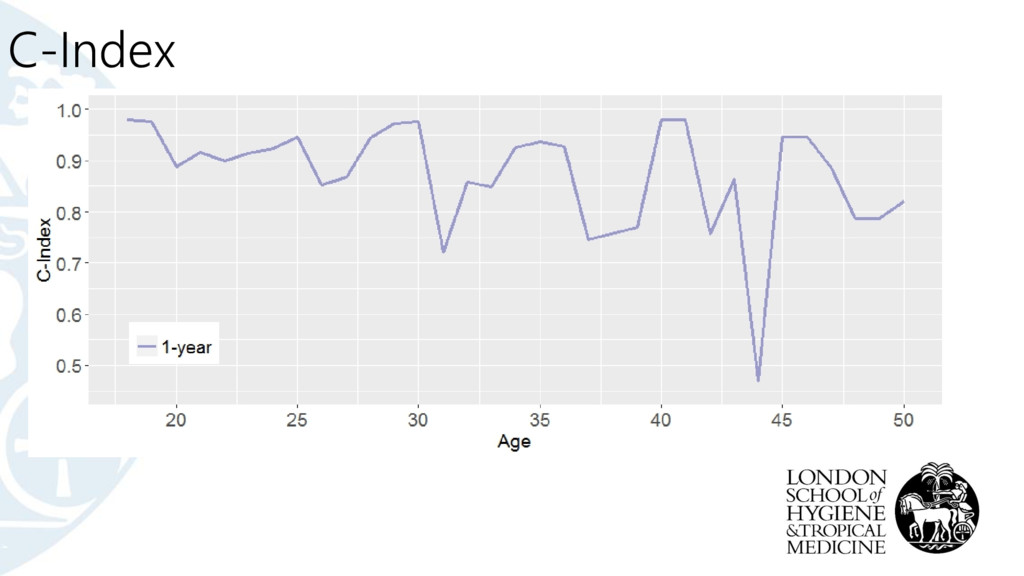
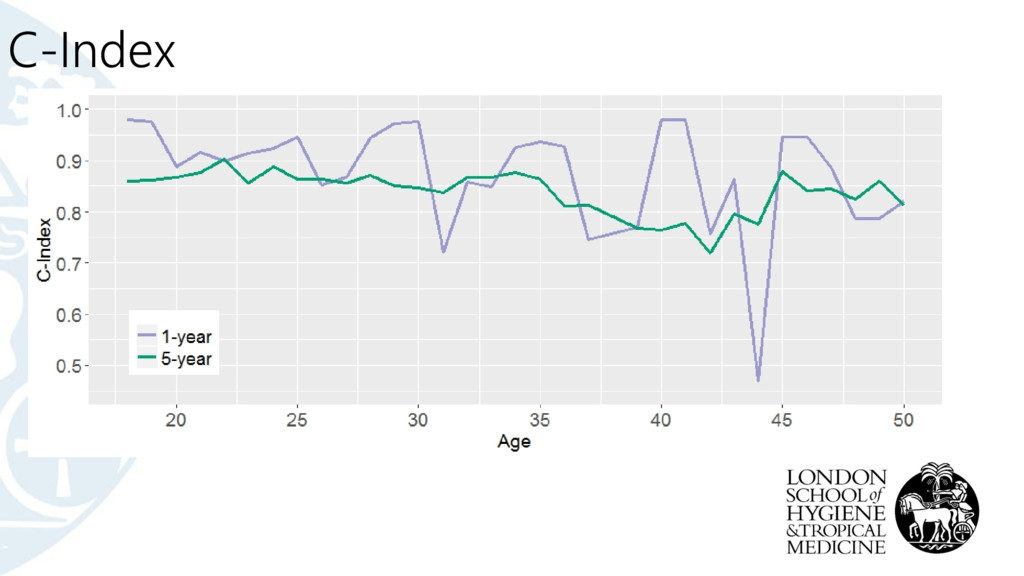
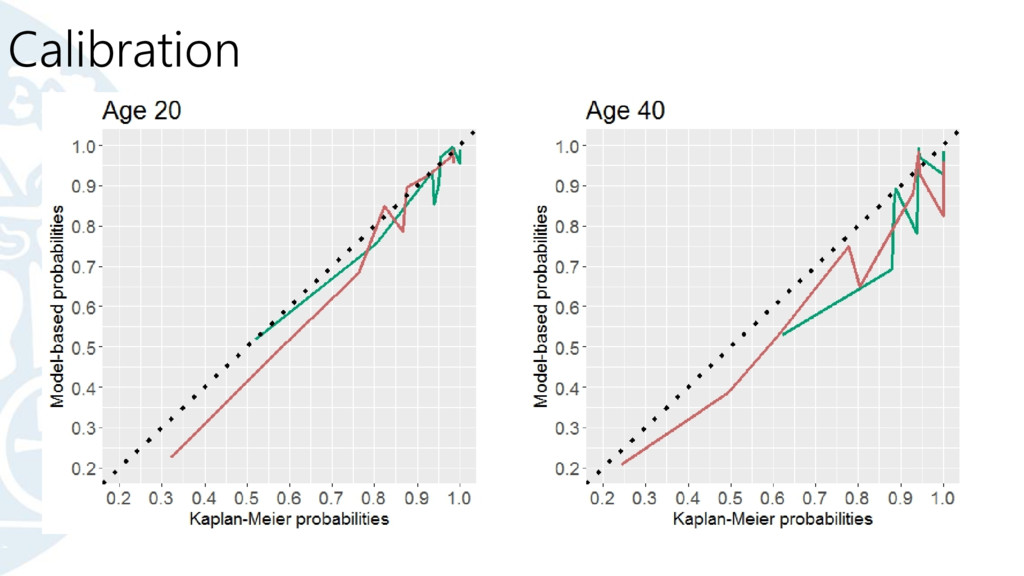
and model assessment based on the remaining 50% C-Index • Measure of discrimination • C-Index for time-dependent effects: Antolini et al (Stat. Med. 2005)
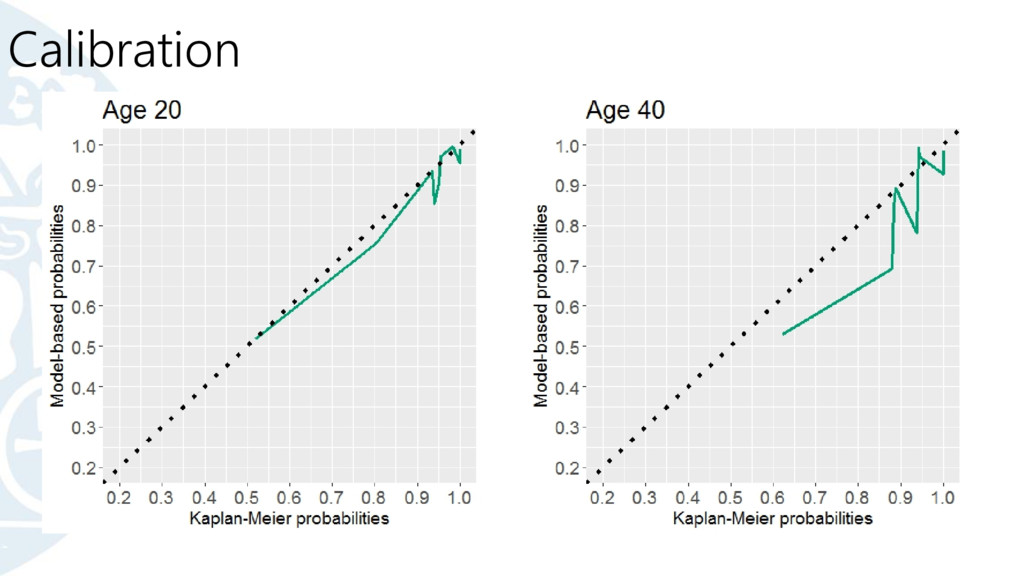
and model assessment based on the remaining 50% C-Index • Measure of discrimination • C-Index for time-dependent effects: Antolini et al (Stat. Med. 2005) Calibration plots • Divided people into deciles based on survival probability • Obtain Kaplan-Meier estimate of x-year survival within the deciles
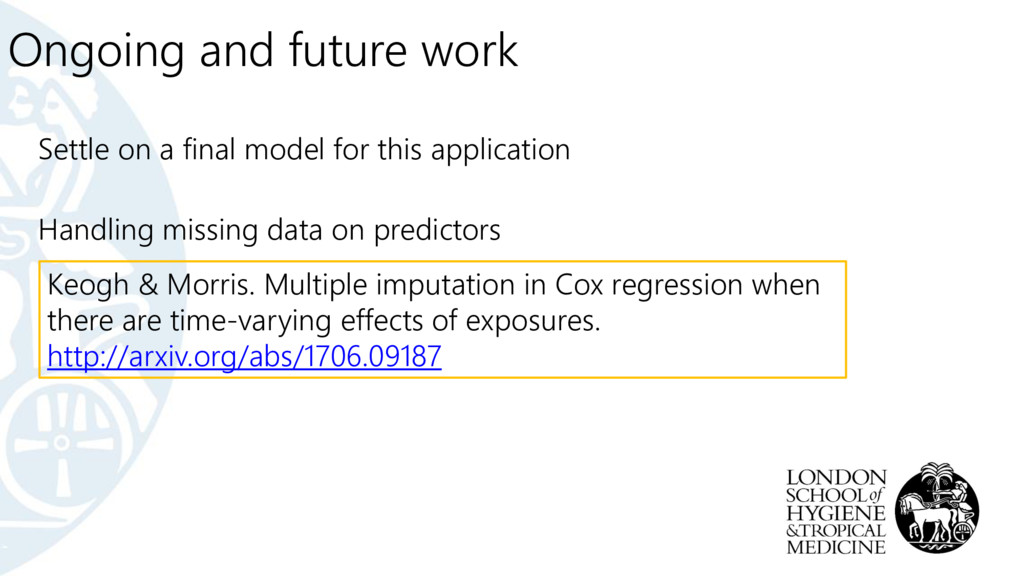
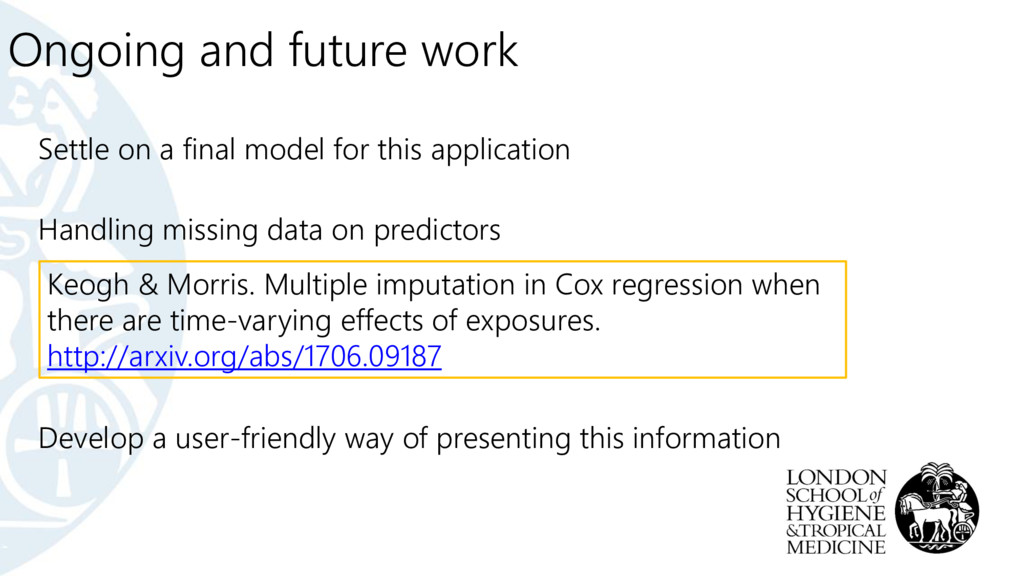
& Morris. Multiple imputation in Cox regression when there are time-varying effects of exposures. http://arxiv.org/abs/1706.09187 Settle on a final model for this application
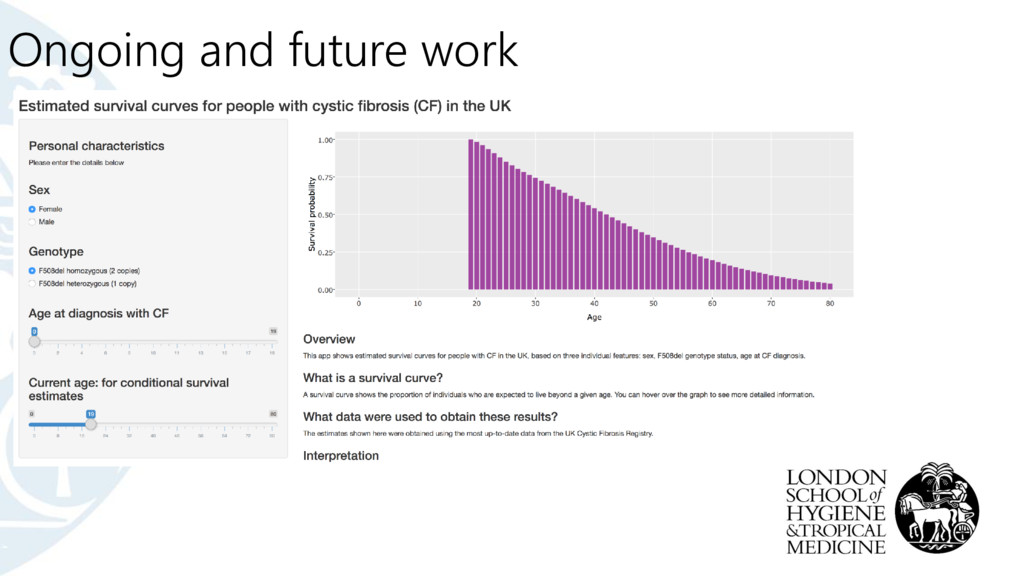
& Morris. Multiple imputation in Cox regression when there are time-varying effects of exposures. http://arxiv.org/abs/1706.09187 Settle on a final model for this application Develop a user-friendly way of presenting this information
Registry • The CF Epi-Net data group (Cystic Fibrosis Trust, Strategic Research Centre Grant) For helpful discussions • Shaun Seaman, Rhonda Szczesniak, Jessica Barrett, Angela Wood For funding • MRC Methodology Fellowship