Upgrade to Pro — share decks privately, control downloads, hide ads and more …

US STOCK MARKET ANALYSIS GUIDE

US STOCK MARKET ANALYSIS GUIDE

The United States stock market is the largest and most liquid equity market in the world, representing
approximately 42% of global market capitalization. Understanding its structure is the first and most critical step
before beginning any analysis.

Avatar for Stocksifting

Stocksifting

May 26, 2026

Other Decks in Business

Transcript

  1. US STOCK MARKET ANALYSIS GUIDE A Complete Framework to Read,

    Analyze & Profit from the US Stock Markets $46 Trillion US Market Capitalization 3 Major Indices S&P; 500 • Dow • NASDAQ 11 GICS Sectors Sector Classification 5 Analysis Methods Covered in This Guide For Investors, Traders & Finance Enthusiasts Published: May 2026 US STOCK MARKET ANALYSIS GUIDE Complete Analysis Framework © 2024 US Stock Market Analysis Guide Page 1 of 16 stocksifting.com
  2. TABLE OF CONTENTS 1. Understanding the US Stock Market Structure

    3 2. Fundamental Analysis – Valuing a Company 5 3. Technical Analysis – Reading Charts 7 4. Sector & Industry Analysis 9 5. Macro & Economic Indicators 11 6. Risk Management & Portfolio Strategy 13 7. Step-by-Step Stock Analysis Framework 15 8. Tools & Resources for US Market Analysis 17 US STOCK MARKET ANALYSIS GUIDE Complete Analysis Framework © 2024 US Stock Market Analysis Guide Page 2 of 16 stocksifting.com
  3. SECTION 1: US Stock Market Structure Introduction to US Financial

    Markets The United States stock market is the largest and most liquid equity market in the world, representing approximately 42% of global market capitalization. Understanding its structure is the first and most critical step before beginning any analysis. 1.1 The Two Major Exchanges Exchange Founded Companies Listed Key Characteristics Notable Stocks NYSE (New York Stock Exchange) 1792 ~2,400 Largest by market cap, strict listing rules, mostly blue-chip companies Berkshire, JPMorgan, Walmart NASDAQ 1971 ~3,300+ Electronic exchange, tech-heavy, lower listing requirements, higher growth stocks Apple, Microsoft, Alphabet, Meta NYSE American (AMEX) 1842 ~800 Smaller companies, ETFs, options. Mid and small-cap focus. Various ETFs & small caps 1.2 The Three Major Indices Stock market indices are the benchmark scorecards of the market. Every investor must understand these three primary US indices: Index Full Name Components Weighting Method Best Represents S&P 500 Standard & Poor's 500 500 largest US companies Market-cap weighted Broad US economy (~80% of total market) Dow Jones (DJIA) Dow Jones Industrial Average 30 blue-chip companies Price-weighted Industrial/traditional economy NASDAQ Composite National Association of Securities Dealers 3,300+ companies Market-cap weighted Tech & growth sector Russell 2000 Russell 2000 Index 2,000 small-cap companies Market-cap weighted Small-cap / domestic economy 1.3 Market Hours & Trading Sessions Session Time (EST) Characteristics Pre-Market 4:00 AM – 9:30 AM Lower liquidity, higher spreads, reacts to overnight news Regular Market Hours 9:30 AM – 4:00 PM Highest liquidity, main trading session, most reliable prices After-Hours 4:00 PM – 8:00 PM Earnings reactions, lower liquidity, volatile moves US STOCK MARKET ANALYSIS GUIDE Complete Analysis Framework © 2024 US Stock Market Analysis Guide Page 3 of 16 stocksifting.com
  4. SECTION 2: Fundamental Analysis Understanding a Company's True Value Fundamental

    analysis involves examining a company's financial health, business model, competitive position, and growth prospects to determine its intrinsic value. This is the bedrock of long-term investing, as popularized by Warren Buffett and Benjamin Graham. 2.1 Key Financial Ratios Metric Formula Good Range What It Tells You P/E Ratio (Price-to-Earnings) Stock Price ÷ EPS 10-25 (value) 25-40 (growth) How much investors pay per $1 of earnings. High P/E = expensive or h EPS Growth ((New EPS - Old EPS) / Old EPS) × 100 > 15% annually The single most important metric. Consistent EPS growth = strong busi Revenue Growth (YoY) ((New Rev - Old Rev) / Old Rev) × 100 > 10% healthy > 20% strong Is the business actually expanding? Revenue must grow for sustainable Debt-to-Equity Total Debt ÷ Total Equity < 1.0 ideal 1.0–2.0 acceptable Lower is safer. High debt = risky in rising interest rate environment. Return on Equity (ROE) Net Income ÷ Shareholders' Equity > 15% good > 20% excellent How efficiently is management generating profit from shareholders' mo Price-to-Book (P/B) Market Price ÷ Book Value per Share < 1 = undervalued 1-3 = normal Used for banks and financial stocks. Below 1 may signal undervaluation Free Cash Flow (FCF) Operating CF - Capital Expenditures Positive & growing The real profit — cash actually generated. Companies can manipulate Profit Margin Net Income ÷ Revenue × 100 > 10% good > 20% excellent How much of every dollar in revenue becomes profit. Higher = better bu PEG Ratio P/E ÷ EPS Growth Rate < 1.0 = undervalued 1.0 = fairly valued Adjusts P/E for growth. Best metric to identify value in growth stocks. 2.2 Reading an Income Statement The income statement (Profit & Loss statement) shows revenue, expenses, and profit over a period. Key lines to analyze: Revenue (Top Line): Total money earned from sales. Must grow consistently. Compare with industry peers. Gross Profit: Revenue minus Cost of Goods Sold. Gross margin shows pricing power. Operating Income (EBIT): Profit from core business before interest and tax. Shows operational efficiency. Net Income (Bottom Line): Final profit after all expenses. Used to calculate EPS. EBITDA: Earnings Before Interest, Tax, Depreciation, Amortization — best for comparing companies across industries. US STOCK MARKET ANALYSIS GUIDE Complete Analysis Framework © 2024 US Stock Market Analysis Guide Page 4 of 16 stocksifting.com
  5. 2.3 Balance Sheet Analysis The balance sheet shows what a

    company owns (assets) and owes (liabilities). A strong balance sheet = financial resilience during downturns. Cash & Equivalents: More cash = more flexibility. Apple holds $160B+ in cash. Current Ratio: Current Assets ÷ Current Liabilities. > 1.5 is healthy. Goodwill: Intangible asset from acquisitions. High goodwill with no earnings = red flag. Long-term Debt: Must be manageable relative to earnings. Debt/EBITDA < 3x is safe. US STOCK MARKET ANALYSIS GUIDE Complete Analysis Framework © 2024 US Stock Market Analysis Guide Page 5 of 16 stocksifting.com
  6. SECTION 3: Technical Analysis Reading Charts & Timing the Market

    Technical analysis studies price action, volume, and statistical indicators to forecast future price movements. While fundamental analysis tells you WHAT to buy, technical analysis helps you decide WHEN to buy and sell. 3.1 Essential Technical Indicators Indicator Calculation Buy Signal Sell Signal Best Used For Simple Moving Average (SMA 50/200) Average closing price over N days Price crosses above 200 SMA Price crosses below 200 SMA Identifying trend direction RSI (Relative Strength Index) 14-day momentum oscillator (0-100) RSI drops below 30 (oversold) RSI rises above 70 (overbought) Identifying overbought/oversold MACD 12-day EMA – 26-day EMA; 9-day signal line MACD crosses above signal line MACD crosses below signal line Momentum & trend changes Bollinger Bands 20-day MA ± 2 standard deviations Price touches lower band + RSI < 30 Price touches upper band + RSI > 70 Volatility measurement Volume Number of shares traded High volume breakout above resistance High volume breakdown below support Confirming price moves Stochastic Compares closing price to price range over 14 days Stochastic < 20, turning up Stochastic > 80, turning down Short-term reversals 3.2 Chart Patterns Every Trader Must Know Pattern Type Signal Success Rate How to Trade It Head & Shoulders Reversal BEARISH 83% Short below neckline. Target = head height subtracted from neckline. Inverse Head & Shoulders Reversal BULLISH 83% Buy above neckline breakout. Same target calculation. Double Top Reversal BEARISH 78% Short on second peak confirmation. Stop above the high. Double Bottom Reversal BULLISH 78% Buy on breakout above resistance. Stop below the low. Cup & Handle Continuation BULLISH 81% Buy on handle breakout. Target = depth of cup added to breakout. Bull Flag Continuation BULLISH 67% Buy on breakout from flag. Target = height of flagpole. Ascending Triangle Continuation BULLISH 75% Buy on breakout above flat resistance with volume. Descending Triangle Continuation BEARISH 73% Short on breakdown below flat support with volume. 3.3 Support, Resistance & Trend Lines Support Level: A price floor where buying pressure consistently stops a decline. Strong support = multiple bounces from same level. Buy near support with tight stop loss below. Resistance Level: A price ceiling where selling pressure consistently stops a rally. Break above resistance with high volume = very bullish signal. Trend Lines: Connect two or more highs (downtrend) or lows (uptrend). Trade in direction of trend. Break of trend line = potential reversal. US STOCK MARKET ANALYSIS GUIDE Complete Analysis Framework © 2024 US Stock Market Analysis Guide Page 6 of 16 stocksifting.com
  7. Golden Cross: 50-day MA crosses ABOVE 200-day MA. One of

    the most reliable long-term BULLISH signals. S&P 500 averages 12% gain in 12 months after golden cross. Death Cross: 50-day MA crosses BELOW 200-day MA. BEARISH signal. Consider reducing equity exposure or hedging. US STOCK MARKET ANALYSIS GUIDE Complete Analysis Framework © 2024 US Stock Market Analysis Guide Page 7 of 16 stocksifting.com
  8. SECTION 4: Sector & Industry Analysis The 11 GICS Sectors

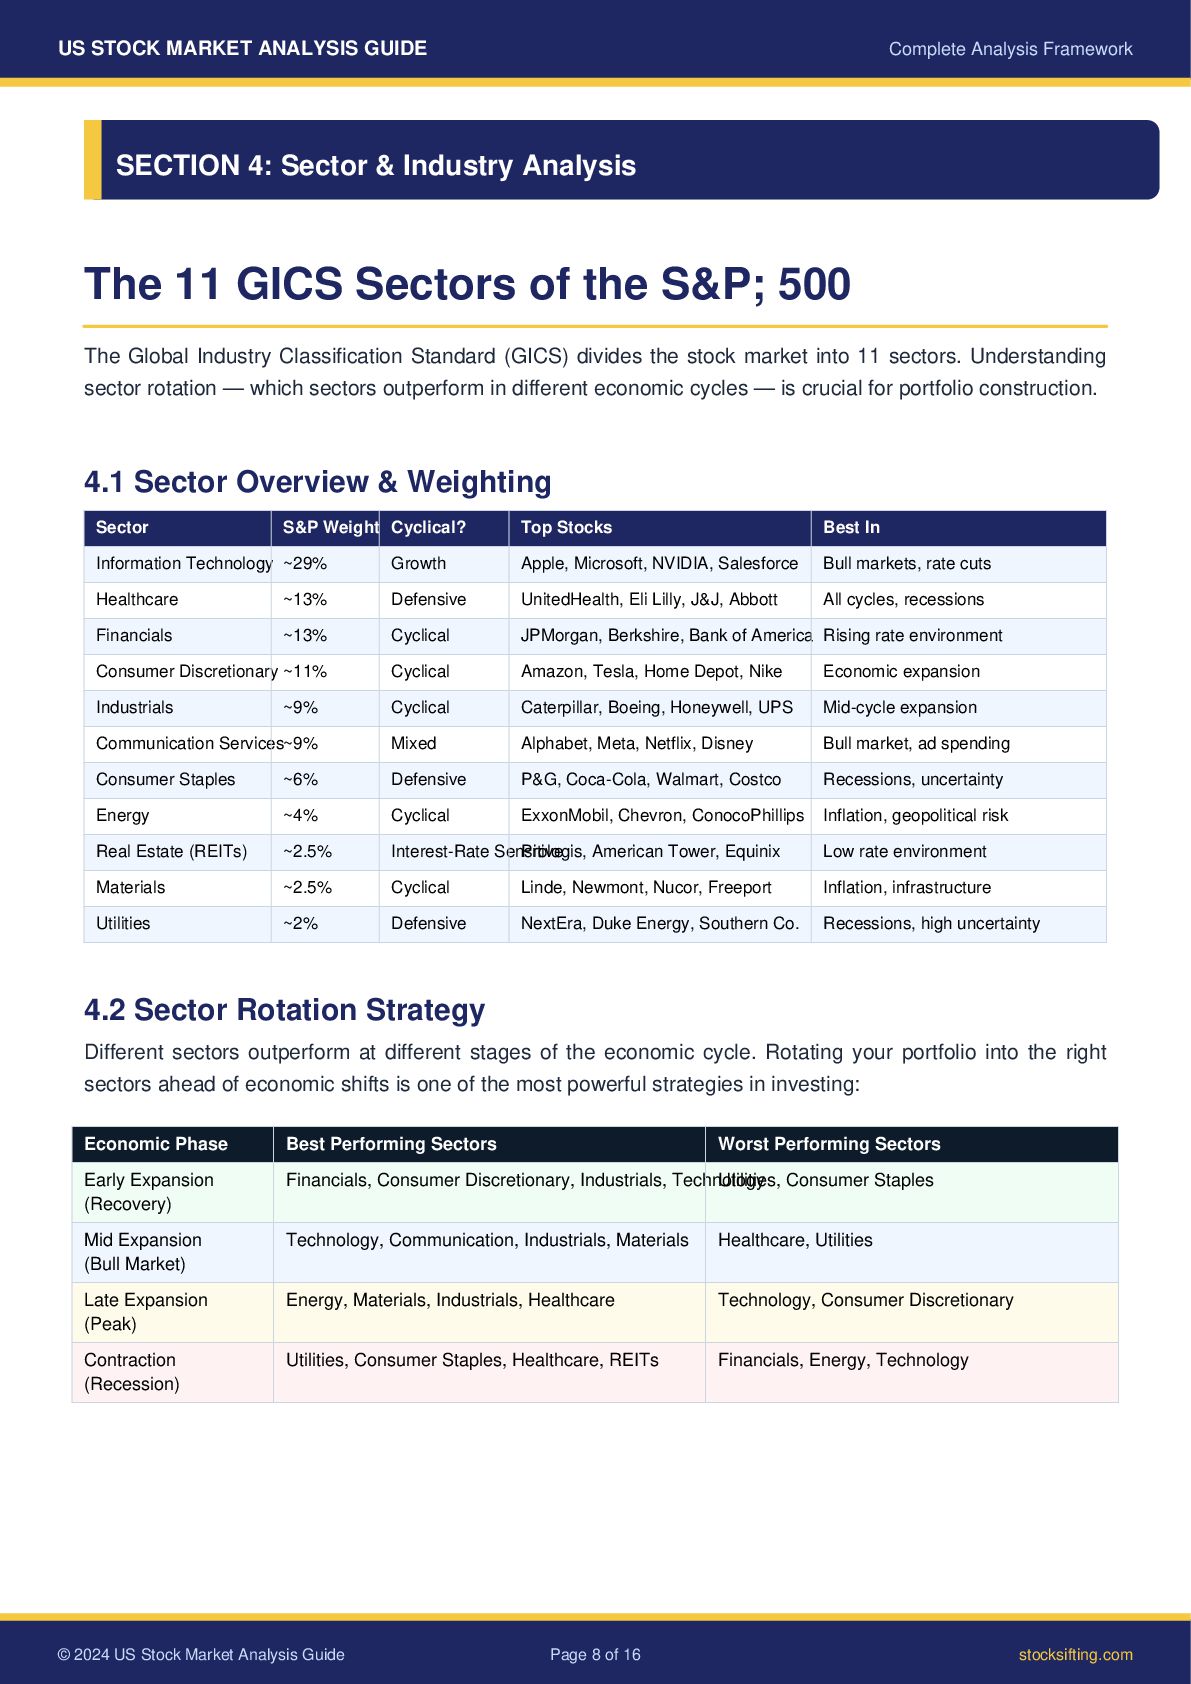
    of the S&P; 500 The Global Industry Classification Standard (GICS) divides the stock market into 11 sectors. Understanding sector rotation — which sectors outperform in different economic cycles — is crucial for portfolio construction. 4.1 Sector Overview & Weighting Sector S&P Weight Cyclical? Top Stocks Best In Information Technology ~29% Growth Apple, Microsoft, NVIDIA, Salesforce Bull markets, rate cuts Healthcare ~13% Defensive UnitedHealth, Eli Lilly, J&J, Abbott All cycles, recessions Financials ~13% Cyclical JPMorgan, Berkshire, Bank of America Rising rate environment Consumer Discretionary ~11% Cyclical Amazon, Tesla, Home Depot, Nike Economic expansion Industrials ~9% Cyclical Caterpillar, Boeing, Honeywell, UPS Mid-cycle expansion Communication Services~9% Mixed Alphabet, Meta, Netflix, Disney Bull market, ad spending Consumer Staples ~6% Defensive P&G, Coca-Cola, Walmart, Costco Recessions, uncertainty Energy ~4% Cyclical ExxonMobil, Chevron, ConocoPhillips Inflation, geopolitical risk Real Estate (REITs) ~2.5% Interest-Rate Sensitive Prologis, American Tower, Equinix Low rate environment Materials ~2.5% Cyclical Linde, Newmont, Nucor, Freeport Inflation, infrastructure Utilities ~2% Defensive NextEra, Duke Energy, Southern Co. Recessions, high uncertainty 4.2 Sector Rotation Strategy Different sectors outperform at different stages of the economic cycle. Rotating your portfolio into the right sectors ahead of economic shifts is one of the most powerful strategies in investing: Economic Phase Best Performing Sectors Worst Performing Sectors Early Expansion (Recovery) Financials, Consumer Discretionary, Industrials, Technology Utilities, Consumer Staples Mid Expansion (Bull Market) Technology, Communication, Industrials, Materials Healthcare, Utilities Late Expansion (Peak) Energy, Materials, Industrials, Healthcare Technology, Consumer Discretionary Contraction (Recession) Utilities, Consumer Staples, Healthcare, REITs Financials, Energy, Technology US STOCK MARKET ANALYSIS GUIDE Complete Analysis Framework © 2024 US Stock Market Analysis Guide Page 8 of 16 stocksifting.com
  9. SECTION 5: Macro & Economic Indicators The Big Picture –

    Economy Drives Markets Before analyzing individual stocks, you must understand the macroeconomic environment. Even the best-quality stock can fall 30-50% in a bear market driven by macro factors. Always analyze Top-Down: Macro → Sector → Individual Stock. GDP Growth Rate Gross Domestic Product measures total economic output. When GDP grows above 2%, the economy is healthy and corporate earnings typically rise. Two consecutive quarters of negative GDP = official recession. Watch: Target: > 2% growth. Warning: < 1% or negative Market Impact: BULLISH: > 2% | BEARISH: Negative Federal Reserve Interest Rates (Fed Funds Rate) The most important variable in the stock market. When Fed cuts rates, borrowing becomes cheaper, corporate profits rise, and growth stocks surge. When Fed raises rates, borrowing costs increase, bond yields compete with stocks, and especially growth/tech stocks fall. Watch: Monitor FOMC meetings (8 per year). Watch Fed Chair speeches for hawkish/dovish signals. Market Impact: Rate Cuts = BULLISH | Rate Hikes = BEARISH (especially for growth stocks) Consumer Price Index (CPI) – Inflation CPI measures the average change in prices of consumer goods. Fed's target is 2%. High inflation (>4%) forces Fed to raise rates aggressively, hurting stock valuations. Low, stable inflation is the 'Goldilocks' scenario for markets. Watch: Monthly CPI report. Core CPI (ex-food & energy) is more important for Fed decisions. Market Impact: < 2%: GOLDILOCKS | 2-4%: NEUTRAL | > 4%: BEARISH VIX – CBOE Volatility Index Known as the 'Fear Index,' VIX measures expected market volatility over the next 30 days. Low VIX = complacency; High VIX = fear. Contrarian investors often BUY when VIX spikes above 35-40 as markets are typically oversold. Watch: VIX < 15: Calm | VIX 15-25: Normal | VIX > 30: Fear | VIX > 40: Extreme Panic Market Impact: High VIX often signals a buying opportunity for patient investors 10-Year Treasury Yield The risk-free rate benchmark. When 10-year yields rise above 4-4.5%, they compete with stock dividends and force investors to reprice growth stocks lower. Inverted yield curve (2-year yield > 10-year yield) is historically the most reliable recession predictor. Watch: Yield curve inversion historically precedes recession by 12-18 months. Market Impact: Rising yields BEARISH for growth stocks | Falling yields BULLISH US STOCK MARKET ANALYSIS GUIDE Complete Analysis Framework © 2024 US Stock Market Analysis Guide Page 9 of 16 stocksifting.com
  10. US Dollar Index (DXY) Measures USD strength against a basket

    of major currencies. A strong dollar hurts US multinational companies' overseas earnings when converted back to USD. Weak dollar boosts commodities (gold, oil) and emerging market stocks. Watch: DXY above 104 starts hurting US large-cap multinationals. Market Impact: Strong USD = HEADWIND for large caps | Weak USD = TAILWIND Unemployment Rate & Non-Farm Payrolls (NFP) NFP is released the first Friday of each month and moves markets significantly. Very low unemployment (<3.5%) can be inflationary, while rising unemployment signals economic weakness. The 'sweet spot' for markets is moderate employment growth without wage inflation. Watch: NFP > 200K jobs = strong | 100-200K = moderate | < 100K = weak Market Impact: Too strong can be bearish (inflation fears); too weak is bearish (recession fears) US STOCK MARKET ANALYSIS GUIDE Complete Analysis Framework © 2024 US Stock Market Analysis Guide Page 10 of 16 stocksifting.com
  11. SECTION 6: Risk Management & Portfolio Strategy Protecting Capital &

    Building Long-Term Wealth Professional traders focus 80% on risk management and 20% on stock selection. The number one rule: Never lose more than you can afford. Risk management separates successful investors from those who blow up their accounts. 6.1 Position Sizing – The 1% Rule Never risk more than 1-2% of your total portfolio on any single trade. This means that even if you have 10 losing trades in a row, you only lose 10-20% — and you can recover. Example: Portfolio Size Max Risk Per Trade (1%) Max Risk Per Trade (2%) Stop Loss Distance Position Size $10,000 $100 $200 5% $2,000 – $4,000 $50,000 $500 $1,000 5% $10,000 – $20,000 $1,00,000 $1,000 $2,000 5% $20,000 – $40,000 $10,00,000 $10,000 $20,000 5% $2,00,000 – $4,00,000 6.2 Stop Loss Strategies Fixed % Stop Loss: Set stop loss at 5-8% below entry price. Simple and effective for most traders. Example: Buy at $100, stop at $93. ATR Stop Loss: Use Average True Range (ATR) × 2 as stop distance. Adapts to market volatility — wider stops in volatile markets. Support-Based Stop: Place stop just below the nearest key support level. Most logical placement as it invalidates your trade thesis. Trailing Stop Loss: Stop moves up as price rises. Locks in profits while letting winners run. Use 8-10% trailing stop on strong uptrends. Time Stop: If trade doesn't move in expected direction within X days, exit regardless of profit/loss. Frees capital for better opportunities. 6.3 Portfolio Allocation Framework Asset Class Conservative Balanced Aggressive US Large Cap Stocks 25% 40% 55% US Mid/Small Cap 5% 15% 20% International Stocks 5% 10% 15% Bonds/Fixed Income 40% 20% 5% REITs 5% 5% 5% US STOCK MARKET ANALYSIS GUIDE Complete Analysis Framework © 2024 US Stock Market Analysis Guide Page 11 of 16 stocksifting.com
  12. Commodities/Gold 10% 5% 0% Cash 10% 5% 0% TOTAL 100%

    100% 100% US STOCK MARKET ANALYSIS GUIDE Complete Analysis Framework © 2024 US Stock Market Analysis Guide Page 12 of 16 stocksifting.com
  13. SECTION 7: Step-by-Step Analysis Framework A Complete Process to Analyze

    Any US Stock This 6-step framework is used by professional analysts. Follow every step before making any investment decision. STEP 1: Macro Environment Check → Check S&P; 500 trend: Is it above 200-day MA? (Bull = above, Bear = below) → Check VIX level: Below 20 = safe environment. Above 30 = caution. → Fed policy direction: Rate cut cycle = risk-on. Rate hike cycle = risk-off. → GDP trend: Growing or contracting? Recession risk? → Determine overall market posture: Bull, Bear, or Sideways. Tools: TradingView, Federal Reserve website (federalreserve.gov), FRED Economic Data STEP 2: Select the Right Sector → Identify which sectors are outperforming S&P; 500 YTD. → Use sector ETFs to compare: XLK (Tech), XLF (Financials), XLE (Energy). → Match sector to current economic cycle phase (see Section 4.2). → Avoid sectors in confirmed downtrends unless you're shorting. Tools: Finviz.com (sector heat map), ETF.com, Yahoo Finance sector page STEP 3: Screen for Stock Candidates → Use Finviz screener with: EPS Growth > 15%, Revenue Growth > 10%, Debt/Equity < 1. → Filter by market cap: Large cap (> $10B) for stability, Mid cap for growth. → Look for stocks in strong uptrends (above 50 and 200 DMA). → Shortlist 5-10 stocks from the target sector. Tools: Finviz.com, TradingView Stock Screener, Yahoo Finance STEP 4: Fundamental Deep Dive → Read last 3 annual reports (10-K) on SEC.gov/EDGAR. → Analyze 5-year trends in Revenue, EPS, Free Cash Flow, and Margins. → Check P/E, P/B, P/S ratios vs industry average. → Evaluate management: Insider buying? Share buybacks? CEO track record? → Assess competitive moat: Brand, patents, network effects, switching costs. → Check next earnings date and analyst consensus estimates. US STOCK MARKET ANALYSIS GUIDE Complete Analysis Framework © 2024 US Stock Market Analysis Guide Page 13 of 16 stocksifting.com
  14. Tools: SEC EDGAR, Macrotrends.net, GuruFocus.com, Morningstar STEP 5: Technical Entry

    Timing → Zoom out to monthly/weekly chart first to understand big-picture trend. → Find key support levels where you want to buy. → Check RSI on daily chart: Entry is better when RSI is between 35-50. → Look for bullish candlestick patterns at support (hammer, engulfing, morning star). → Confirm with volume: Good entries have increasing volume. → Set your stop loss level BEFORE entering the trade. Tools: TradingView.com (best charting platform), Thinkorswim, Interactive Brokers STEP 6: Trade Management & Exit → Set a price target (minimum 2:1 reward-to-risk ratio). → Enter position in tranches (1/3 now, 1/3 on pullback, 1/3 on confirmation). → Move stop loss to break-even once trade is 10% in profit. → Review position quarterly when earnings are released. → Scale out at target: Sell 1/3 at first target, trail stop on remaining. → Never let a winner become a loser after it's up > 20%. Tools: Set alerts on TradingView. Keep a trading journal. US STOCK MARKET ANALYSIS GUIDE Complete Analysis Framework © 2024 US Stock Market Analysis Guide Page 14 of 16 stocksifting.com
  15. SECTION 8: Tools & Resources Best Free & Paid Tools

    for US Market Analysis Tool Type Best For Cost TradingView Charting Technical analysis, screener, alerts, community ideas Free / $15+/mo Finviz.com Screener Stock screening, heat maps, fundamental filters Free / $24.96/mo Yahoo Finance News & Data Earnings calendar, financials, analyst ratings Free Macrotrends.net Historical Data 10-20 year historical charts for all metrics Free SEC EDGAR Regulatory Official 10-K, 10-Q filings, insider transactions Free GuruFocus Fundamentals DCF valuation, moat analysis, guru portfolios Free / $499/yr Morningstar Research Deep fundamental analysis, ratings, moat scores Free / $249/yr Seeking Alpha News & Analysis Earnings analysis, author opinions, quant ratings Free / $239/yr Federal Reserve (FRED) Economic Data 200,000+ economic indicators and data series Free Investors.com (IBD) Growth Stocks CAN SLIM methodology, relative strength ratings Free / $49.95/mo Must-Read Books for US Stock Market Analysis The Intelligent Investor – Benjamin Graham The bible of value investing. Foundation of all fundamental analysis. How to Make Money in Stocks – William O'Neil CAN SLIM method. Best book for growth stock investing. Market Wizards – Jack Schwager Interviews with the greatest traders of all time. Risk management lessons. One Up on Wall Street – Peter Lynch How to find 10-baggers by observing everyday life. Trading in the Zone – Mark Douglas Psychology of trading. Most important factor in success. Remember: Consistency + Discipline = Long-Term Wealth Macro pehle analyze karo, fir sector, fir stock. Risk management sabse zaroori hai. Best investors woh hain jo sabse kam galtiyan karte hain. For more in-depth analysis, strategies, and real-time US stock market insights, visit: US STOCK MARKET ANALYSIS GUIDE Complete Analysis Framework © 2024 US Stock Market Analysis Guide Page 15 of 16 stocksifting.com
  16. US Stock Market Analysis US STOCK MARKET ANALYSIS GUIDE Complete

    Analysis Framework © 2024 US Stock Market Analysis Guide Page 16 of 16 stocksifting.com