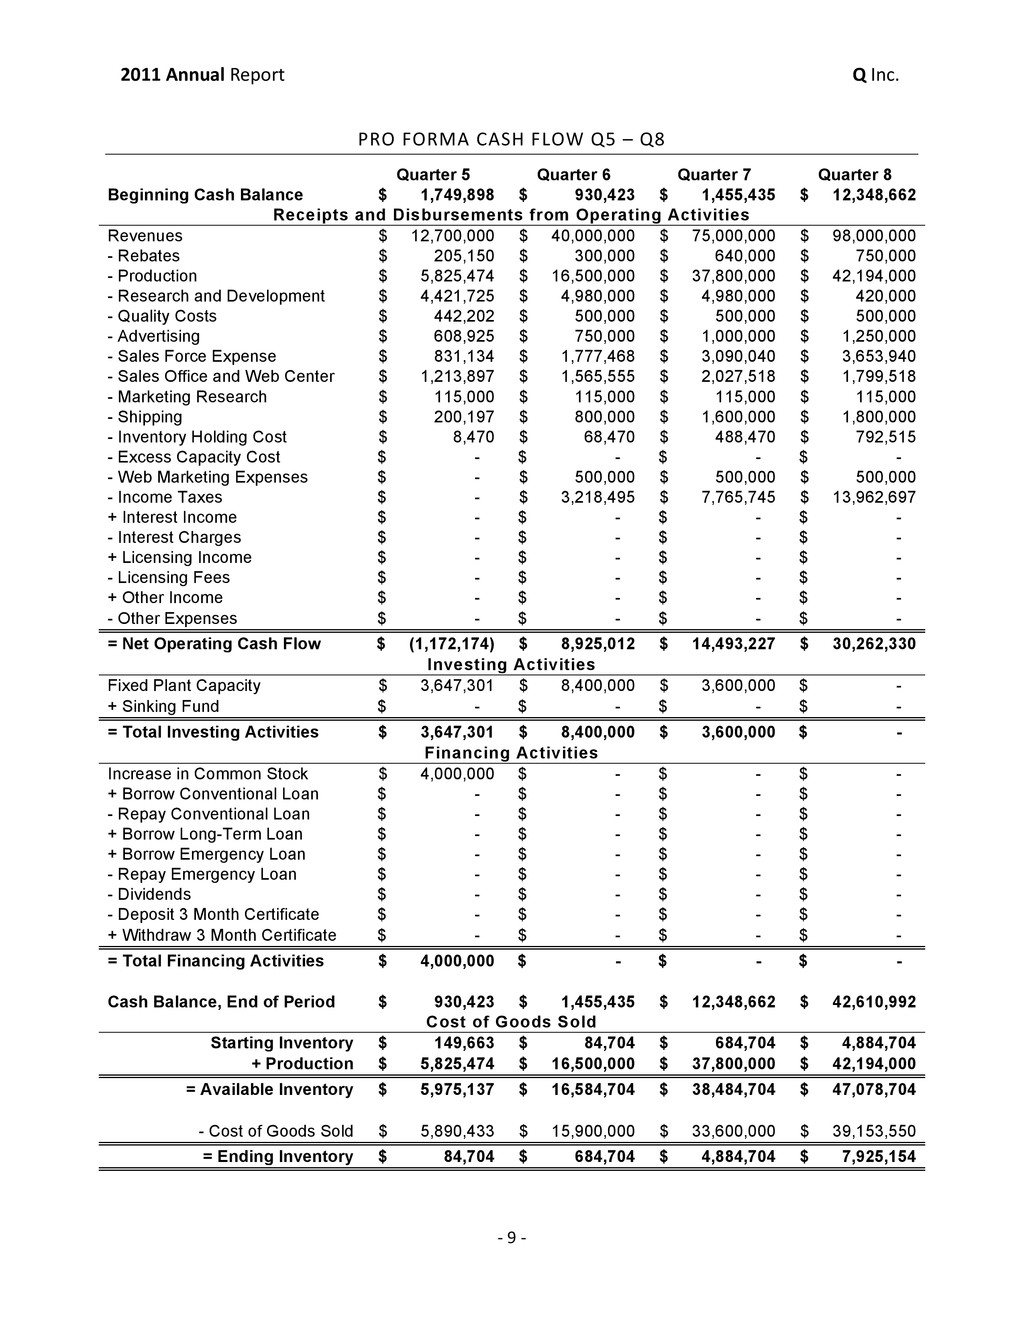
Upgrade to Pro — share decks privately, control downloads, hide ads and more …

Q Inc Annual Report

Q Inc Annual Report

The Texas Business Foundations Program (Texas BFP) at UT’s top-rated McCombs School of Business is a certificate program designed to give undergraduate students of any discipline a fundamental background in business. The program allows students to supplement their current course of study and equip themselves with the business knowledge to turn passions into successful careers.

During the program Students are ‘profiled’ using the Myers-Briggs Type Indicator and placed into teams. These teams then go on to create a fiction company to run in a realistic online business simulation, Marketplace Live.

Our company was called Q Inc., and this is our Annual Report summarizing our business strategy and financials for the first year in our Business Simulation.

Taylor McCaslin

July 18, 2011
Tweet

More Decks by Taylor McCaslin

Other Decks in Business

Transcript

  1. 2011  Annual  Report              

             Q  Inc.       TABLE  OF  CONTENTS     Company  Overview  ..............................................................................................................................  1   General  Description  of  Business  ................................................................................................................................  1   Business  Strategy  .............................................................................................................................................................  1   Competitive  Environment  .................................................................................................................  2   Markets  and  Competition  .............................................................................................................................................  2   Strategic  Summary  of  Operational  Goals  .....................................................................................  3   Marketing  ............................................................................................................................................................................  3   Sales  .......................................................................................................................................................................................  4   Manufacturing  ...................................................................................................................................................................  5   Human  Resources  ............................................................................................................................................................  6   Capital  Resources  Needs  ....................................................................................................................  7   Use  of  Funds  &  Rationale  ..............................................................................................................................................  7   Financial  Statements  ...........................................................................................................................  8   Pro  Forma  Cash  Flow  Q1  –  Q4  ....................................................................................................................................  8   Pro  Forma  Cash  Flow  Q5  –  Q8  ....................................................................................................................................  9   Pro  Forma  Income  Statement  Q1  –  Q4  ................................................................................................................  10   Pro  Forma  Income  Statement  Q5  –  Q8  ................................................................................................................  11   Pro  Forma  Balance  Sheet  Q1  –  Q4  .........................................................................................................................  12   Pro  Forma  Balance  Sheet  Q5  –  Q8  .........................................................................................................................  12   Conclusion  ............................................................................................................................................  13   Signatures  .............................................................................................................................................  13    
  2. 2011  Annual  Report              

             Q  Inc.     -­‐  1  -­‐   COMPANY  OVERVIEW     GENERAL  DESCRIPTION  OF  BUSINESS   Q Inc. is a personal computing company established in 2011 and incorporated under the laws of Marketplace Live. Q Inc.’s departments strive to consistently excel in the cutting edge, competitive, high margin segments while simultaneously reaching fringe markets. Q Inc. is the culmination of a dedicated team of individuals who have a passion for innovation and quality in all that they do. We endeavor to help our clients realize their maximum potential through the benefits of using our products. Every customer of Q Inc. is a valued member of our team. BUSINESS  STRATEGY   Our business strategy is to provide personal computers to a unique blend of business people who value perfection, performance, and personable service. Q Inc. serves the mid and high end market segments with quality products that satisfy their personal and business needs. Determined to fully utilize markets, our strategy consists of deep market penetration and expansion to maximize our brand loyalty. North America and Europe are populated with our sales offices, as these are the leading target markets. Through balance of risk with rewards, we hope to set a path of consistent sustainable growth and financial success. COMPETITIVE  POSTURE:   • build a market position and defend it • take the lead and keep it • be first to market • create products that differentiate themselves from the competition based on quality DISTINCTIVE  COMPETENCIES:   • be the technology leader • be the high service provider in the market • provide the most reliable product on the market • create a product that meets our markets’ needs while maximizing clientele satisfaction      
  3. 2011  Annual  Report              

             Q  Inc.     -­‐  2  -­‐   COMPETITIVE  ENVIRONMENT MARKETS  AND  COMPETITION   Introduction of our services to both geographic markets at an equal rate paid off thus far, allowing us to gain more financial benefits and markets share than our competitors who either chose to focus on one region or pursue a less aggressive, scattered expansion approach. Winning Inc. has invested significantly in expanding their North America segment and has more sale points than we do. We have already started to correct this deficiency through development of more sales channels and further improving the quality of our advertising. Our competition has progressively escalated, with Winning Inc. capturing a noticeable portion of the Innovator segment in quarter four. However, our presence in the Workhorse market remains unrivaled as of quarter four. We are investing in short term and long-term solutions to mitigate these problems of our competitor's expansion. The rest of our competition is focused on other target markets, but we are prepared for their potential expansion into our markets. Financially, we are the top performer in the industry and have been able to make a profit during a period of growth that traditionally comprised of high investment cost with little chance for profits. Our balance of financial prudence and aggressive expansion has proven to be successful and sustainable.
  4. 2011  Annual  Report              

             Q  Inc.     -­‐  3  -­‐   STRATEGIC  SUMMARY  OF  OPERATIONAL  GOALS   MARKETING   From inception, Q Inc. has always believed that building a trusted, highly recognized brand begins with providing high-quality products and services that make a notable difference in people’s lives. Our user base has grown by over 580% in quarter four, outperforming the sector’s growth of 500%. Our early marketing efforts focused on testing the market and learning what our customers respond to. Through these efforts and people’s increased purchase of our products, we have been able to build our brand with relatively low marketing costs as a percentage of our revenues. Today, we use the quality of our own products and services as our most effective marketing tool. Our marketing activities are designed to promote Q Inc.’s brand image and differentiate it from competitors. BRAND  MANAGEMENT   The marketing department continuously examines historical brand profitability for each model Q Inc. produces each quarter. Using this information provides a strategic overview of where money is being spent and how much profit is made per unit. Through pairing this information with product reviews, brand judgment and benchmarking, brand redesigns are continuously considered and implemented. With access to Research & Development investing in quarter five, Q Inc. intends to further increase customer satisfaction though the implementation of new product technologies, driving sales and profits. PRICING   Q Inc. develops its products’ cost structure quarterly, adjusting to changes in competitors’ prices and subsequent price judgment reviews. Through strategic analysis of how consumers respond to both Q Inc.’s prices and our competitors, adjustments are made to maintain a competitive market position while still maximizing profits. ADVERTISING   Our target market clientele drives our advertising. Through analyzing consumer’s needs and wants, Q Inc. intends to maximize ad judgment and media placement both locally and regionally. Using the same approach as in the brand management process, the Marketing department targets ads to customers’ benefits to drive purchases. Aligning our brands with our clientele’s needs and wants is key.
  5. 2011  Annual  Report              

             Q  Inc.     -­‐  4  -­‐   MARKET  RESEARCH   Q Inc. invests in market research each quarter to provide the key data for all of the analysis mentioned in the previous sections. This strategic data provides a basis for benchmarking as well as market performance. SALES   Q Inc.’s retail locations are based on finding customers whose needs we can best satisfy. Our geographic expansion strategy is based on building and retaining customer loyalty in areas we believe will be most profitable for our company in the future. Growth of our sales force represents our core value of achieving high quality in our products and customer service. EXPANSION  SCHEDULE:   Q2: London, Los Angeles Q3: Chicago, Paris Q4: Toronto, Mexico, Moscow Q5 (tentative): Warsaw, North America Web, Tokyo, Shanghai, Sydney SALES  OFFICES Q Inc. wanted to gain a first mover advantage in North America and Europe because these high demand regions contain high paying customers whose needs we can best satisfy. Focus of development on both regions was key in capturing the largest market share in the last two quarters. We will continue to enter other geographic locations to diversify our risks should any single market under-perform. We have still chosen to forgo opening any web centers as of quarter four. Two operational sales offices in each region cannot generate sufficient regional demand and recognition of our brand to justify the large setup costs. SALES  PERSONNEL:   Q Inc. employed 5 sales people per office in quarter three and only had a demand of 30 units per sales person due to inherently low demand of a product in the introductory phase. In quarter four, we hired two additional Workhorse sales personnel in each office to help alleviate the dramatic upswing in demand. However, one of our competitors was able to obtain higher demand per sales people in quarter four, helping us realize that we could have scaled back our force expansion. As demand increase sharply drops in quarter five, we will carefully consider keeping the number of sales people per office as is.
  6. 2011  Annual  Report              

             Q  Inc.     -­‐  5  -­‐   SALES  RESULTS   Sales have been strong, allowing us to gain the largest market shares for the last two quarters. Considerable improvements in brand and ad design in quarter four helped propel the Element Q200 to be the most sought-after product in the Workhorse market. Innovator market share dropped in quarter four as another company entered the segment, but overall sales in this market outperformed our predictions by 38% due to highly effective marketing decisions. Sales of the Fusion Q200 in quarter four accounted for 58% of our revenue, up from 35% in quarter three, also reflecting strong demand since redesign of the brand. As North America has higher demand for our products, lower sales personnel compensation standards, and higher product prices than Europe, North America has been the significantly more profitable region over the last two quarters. In quarter four, North America had a 32% higher gross margin than Europe. Extensive inter-department communication has helped provide fairly accurate sales projections, allowing Q Inc. to take full advantage of the inherent large increase in demand in quarter four and enhancing sales by 580%. MANUFACTURING   Q Inc.’s manufacturing focuses on producing high quality products. By having a highly efficient plant, we are able to provide our customers with a high quality product at a reasonable price. We believe that efficient and effective production scheduling, improved changeover times, and quality improvements are key competitive advantages in providing our customers with reliable products that fit their needs. PLANT  LOCATION   In order to provide our clients with the reliable products they deserve, low operations costs in Sao Paulo ensured we had enough in our budget to run quality inspections, improve changeover time, and increase factory worker wages. Furthermore, Sao Paulo’s relatively low shipping costs to our target regions. OPERATING  AND  FIXED  CAPACITY   We have been steadily increasing our operating capacity to meet growing demand. To account for losses in production due to changeover times and lower than predicted worker productivity, we produce a safety stock that is 5% of projected demand. As of quarter 4, cumulative investments of $400,000 in changeover improvement has cut our changeover time by over 57% and changeover costs by over 37%. To meet increasing demand, we are continuously investing in decreasing changeover time, increasing product reliability, and increasing fixed capacity.
  7. 2011  Annual  Report              

             Q  Inc.     -­‐  6  -­‐   SET  TARGET  AND  REPLENISHMENT  POINTS   Production priority is based on the demand-pull approach and on our target market size. Utilizing the factory simulation tool, we have optimized our target and replenishment points to be able to meet customer demands without overproducing. UNWANTED  INVENTORY  &  QUALITY  IMPROVEMENT   We only scrap our unwanted inventory when we produce new brands. In quarter four we had the highest reliability rating in the industry but it was not up to par with our expectations. Q Inc. strives for perfection in product quality (because of this philosophy we invested in quality inspection for our hard drive, case, and monitor and a variance study for all components in quarter three. We will continuously invest in quality improvement(s) to create a more reliable product(s) for our customers. HUMAN  RESOURCES   Our HR strategy is to focus on quality employee treatment, emphasizing efficiency, ethics, and respect. We consistently strive to be among the highest paying companies in our industry without compromising our goals or values. COMPENSATION  DETAILS   In quarter four, our North American sales staff received 18.2% higher compensation than the industry average, giving us the highest sales productivity in the region. In Europe, our sales staff received 8.6% higher compensation than the industry average. Our factory force of 182 workers by the end of the first year was essential in producing enough to meet demand. Our factory employees received 12.3% higher total cost of compensation per person than the industry average. Similar to our sales compensation pay, we were above the average, but were still second best overall. HR  DECISIONS  IN  RELATION  TO  OVERALL  STRATEGY   HR has stood out as a pivotal player in demand and supply management, helping to meet and influence demand. For instance, while increasing manufacturing payroll could help meet projected demand, HR could also lower sales productivity to prevent stock outs and long-term ill will. We plan on continuing to refine the skill of using HR compensation to impact supply and demand. According to demand projections, HR will be able to maintain both a competitive salary and benefits for all our workers. By following this HR strategy, we will use productivity to influence supply and demand while reinforcing a culture of quality at Q Inc.
  8. 2011  Annual  Report              

             Q  Inc.     -­‐  7  -­‐   CAPITAL  RESOURCES  NEEDS To continue nurturing its trend of leading exponential growth, Q Inc. needs your investment. We are a firm that reaps the benefits of first mover advantages through aggressive expansion. In quarter five we plan to set up a bold front-line of brick and mortar sales offices in Asia. This region is currently a virgin market we will debut in and set the standard in product quality and service. We also need your investment to pursue R&D that will allow us to expand our product line, sort out existing discrepancies in assortment, and serve a wider audience. Finally, Q Inc. needs your financing to serve you back. One of our main interests is to foster shareholder relations since your investments make Q Inc. possible. Our plans are to pay out dividends by quarter seven, as we are confident that our future will be very profitable. USE  OF  FUNDS  &  RATIONALE   The use of venture capitalist funds ultimately narrows down to two improvements: R&D, and regional sales expansion. We will spend $4.5 million in R&D, and $700,000 in sales office expansion, adding up to a total of $5.2 million. These key developments in our firm will set us at the forefront of our competitive environment. RESEARCH  &  DEVELOPMENT   Acquiring R&D of key components in our products will allow us to sell new and improved brands that aim to maximize brand judgment and lock in existing brand loyalty. As well, these improvements will open the door to the Mercedes market, which we have been hesitant to enter due to a lack of sophisticated components. A new brand also helps us diversify our risk through additional sources of income. We will continue to see the benefits of R&D as we continue to improve our brands in the most competitive fashion. EXPANSION   We need $470,000 to set up Brick and Mortar offices in Tokyo, Shanghai, and Sydney in quarter five. This decision goes in line with our assertive expansion strategy. By opening much of the APAC region at once we can set up a regional network that serves the Workhorse’s important need for availability. With our own investment in fixed capacity we can meet the substantial increase in demand stimulated by our regional network. We will continue to follow our expansion strategy rigorously until we have global coverage. Following a profit analysis of different regions, we will proceed to open offices in Latin America and then Africa.
  9. 2011  Annual  Report              

             Q  Inc.     -­‐  8  -­‐   FINANCIAL  STATEMENTS     PRO  FORMA  CASH  FLOW  Q1  –  Q4   Quarter 1 Quarter 2 Quarter 3 Quarter 4 Beginning Cash Balance $ - $ 1 $ 50,000 $ 387,823 Receipts and Disbursements from Operating Activities Revenues $ - $ - $ 973,858 $ 6,827,285 - Rebates $ - $ - $ 16,200 $ 160,600 - Production $ - $ - $ 732,770 $ 3,263,908 - Research and Development $ - $ 120,000 $ 160,000 $ 420,000 - Quality Costs $ - $ - $ 20,017 $ 291,985 - Advertising $ - $ - $ 159,670 $ 232,613 - Sales Force Expense $ - $ - $ 217,483 $ 556,207 - Sales Office & Web Center $ - $ 350,512 $ 506,771 $ 709,095 - Marketing Research $ - $ - $ 115,000 $ 92,000 - Shipping $ - $ - $ 23,605 $ 115,952 - Inventory Holding Cost $ - $ - $ 16,165 $ 14,966 - Excess Capacity Cost $ - $ - $ 23,174 $ - - Web Marketing Expenses $ - $ - $ - $ - - Income Taxes $ - $ - $ - $ - + Interest Income $ 14,558 $ 5,322 $ - $ - - Interest Charges $ - $ - $ - $ - + Licensing Income $ - $ - $ - $ - - Licensing Fees $ - $ - $ - $ - + Other Income $ - $ - $ - $ - - Other Expenses $ 44,000 $ - $ - $ - = Net Operating Cash Flow $ (29,442) $ (465,190) $ (1,016,996) $ 969,958 Investing Activities Fixed Plant Capacity $ - $ 1,100,550 $ - $ 607,883 + Sinking Fund $ - $ - $ - $ - = Total Investing Activities $ - $ 1,100,550 $ - $ 607,883 Financing Activities Increase in Common Stock $ 1,000,000 $ 1,000,000 $ 1,000,000 $ 1,000,000 + Borrow Conventional Loan $ - $ - $ - $ - - Repay Conventional Loan $ - $ - $ - $ - + Borrow Long-Term Loan $ - $ - $ - $ - + Borrow Emergency Loan $ - $ - $ - $ - - Repay Emergency Loan $ - $ - $ - $ - - Dividends $ - $ - $ - $ - - Deposit 3 Month Certificate $ 970,557 $ - $ - $ - + Withdraw 3 Month Certificate $ - $ 615,738 $ 354,819 $ - = Total Financing Activities $ 29,443 $ 1,615,738 $ 1,354,819 $ 1,000,000 Cash Balance, End of Period $ 1 $ 50,000 $ 387,823 $ 1,749,898 Cost of Goods Sold Starting Inventory $ - $ - $ - $ 161,647 + Production $ - $ - $ 732,770 $ 3,263,908 = Available Inventory $ - $ - $ 732,770 $ 3,425,555 - Cost of Goods Sold $ - $ - $ 571,122 $ 3,275,892 = Ending Inventory $ - $ - $ 161,647 $ 149,663
  10. 2011  Annual  Report              

             Q  Inc.     -­‐  9  -­‐   PRO  FORMA  CASH  FLOW  Q5  –  Q8   Quarter 5 Quarter 6 Quarter 7 Quarter 8 Beginning Cash Balance $ 1,749,898 $ 930,423 $ 1,455,435 $ 12,348,662 Receipts and Disbursements from Operating Activities Revenues $ 12,700,000 $ 40,000,000 $ 75,000,000 $ 98,000,000 - Rebates $ 205,150 $ 300,000 $ 640,000 $ 750,000 - Production $ 5,825,474 $ 16,500,000 $ 37,800,000 $ 42,194,000 - Research and Development $ 4,421,725 $ 4,980,000 $ 4,980,000 $ 420,000 - Quality Costs $ 442,202 $ 500,000 $ 500,000 $ 500,000 - Advertising $ 608,925 $ 750,000 $ 1,000,000 $ 1,250,000 - Sales Force Expense $ 831,134 $ 1,777,468 $ 3,090,040 $ 3,653,940 - Sales Office and Web Center $ 1,213,897 $ 1,565,555 $ 2,027,518 $ 1,799,518 - Marketing Research $ 115,000 $ 115,000 $ 115,000 $ 115,000 - Shipping $ 200,197 $ 800,000 $ 1,600,000 $ 1,800,000 - Inventory Holding Cost $ 8,470 $ 68,470 $ 488,470 $ 792,515 - Excess Capacity Cost $ - $ - $ - $ - - Web Marketing Expenses $ - $ 500,000 $ 500,000 $ 500,000 - Income Taxes $ - $ 3,218,495 $ 7,765,745 $ 13,962,697 + Interest Income $ - $ - $ - $ - - Interest Charges $ - $ - $ - $ - + Licensing Income $ - $ - $ - $ - - Licensing Fees $ - $ - $ - $ - + Other Income $ - $ - $ - $ - - Other Expenses $ - $ - $ - $ - = Net Operating Cash Flow $ (1,172,174) $ 8,925,012 $ 14,493,227 $ 30,262,330 Investing Activities Fixed Plant Capacity $ 3,647,301 $ 8,400,000 $ 3,600,000 $ - + Sinking Fund $ - $ - $ - $ - = Total Investing Activities $ 3,647,301 $ 8,400,000 $ 3,600,000 $ - Financing Activities Increase in Common Stock $ 4,000,000 $ - $ - $ - + Borrow Conventional Loan $ - $ - $ - $ - - Repay Conventional Loan $ - $ - $ - $ - + Borrow Long-Term Loan $ - $ - $ - $ - + Borrow Emergency Loan $ - $ - $ - $ - - Repay Emergency Loan $ - $ - $ - $ - - Dividends $ - $ - $ - $ - - Deposit 3 Month Certificate $ - $ - $ - $ - + Withdraw 3 Month Certificate $ - $ - $ - $ - = Total Financing Activities $ 4,000,000 $ - $ - $ - Cash Balance, End of Period $ 930,423 $ 1,455,435 $ 12,348,662 $ 42,610,992 Cost of Goods Sold Starting Inventory $ 149,663 $ 84,704 $ 684,704 $ 4,884,704 + Production $ 5,825,474 $ 16,500,000 $ 37,800,000 $ 42,194,000 = Available Inventory $ 5,975,137 $ 16,584,704 $ 38,484,704 $ 47,078,704 - Cost of Goods Sold $ 5,890,433 $ 15,900,000 $ 33,600,000 $ 39,153,550 = Ending Inventory $ 84,704 $ 684,704 $ 4,884,704 $ 7,925,154
  11. 2011  Annual  Report              

             Q  Inc.     -­‐  10  -­‐   PRO  FORMA  INCOME  STATEMENT  Q1  –  Q4   Quarter 1 Quarter 2 Quarter 3 Quarter 4 Gross Profit Revenues $ - $ - $ 973,858 $ 6,827,285 - Rebates $ - $ - $ 16,200 $ 160,600 - Cost of Goods Sold $ - $ - $ 571,122.26 $ 3,275,891.99 = Gross Profit $ - $ - $ 386,536 $ 3,390,793 Expenses Research and Development $ - $ 120,000 $ 160,000 $ 420,000 + Quality Costs $ - $ - $ 20,016.73 $ 291,985.30 + Advertising $ - $ - $ 159,670 $ 232,613 + Sales Force Expense $ - $ - $ 217,483 $ 556,207 + Sales Office and Web Center Expenses $ - $ 350,512 $ 506,771 $ 709,095 + Marketing Research $ - $ - $ 115,000 $ 92,000 + Shipping $ - $ - $ 23,604.82 $ 115,952.30 + Inventory Holding Cost $ - $ - $ 16,164.73 $ 14,966.34 + Excess Capacity Cost $ - $ - $ 23,173.94 $ - + Depreciation $ - $ - $ 45,856.25 $ 45,856.25 + Web Marketing Expenses $ - $ - $ - $ - = Total Expenses $ - $ 470,512 $ 1,287,740 $ 2,478,675 Operating Profit $ - $ (470,512) $ (901,205) $ 912,118 Miscellaneous Income and Expenses + Licensing Income $ - $ - $ - $ - - Licensing Fees $ - $ - $ - $ - + Other Income $ - $ - $ - $ - - Other Expenses $ 44,000 $ - $ - $ - = Earnings Before Interest and Taxes $ (44,000) $ (470,512) $ (901,205) $ 912,118 + Interest Income $ 14,558.36 $ 5,322.29 $ - $ - - Interest Charges $ - $ - $ - $ - = Income Before Taxes $ (29,442) $ (465,190) $ (901,205) $ 912,118 - Loss Carry Forward $ - $ - $ - $ 912,117.82 = Taxable Income $ - $ - $ - $ - - Income Taxes $ - $ - $ - $ - = Net Income $ (29,441.65) $ (465,189.72) $ (901,204.74) $ 912,117.82 Earnings per Share $ (3) $ (23) $ (30) $ 23      
  12. 2011  Annual  Report              

             Q  Inc.     -­‐  11  -­‐   PRO  FORMA  INCOME  STATEMENT  Q5  –  Q8   Quarter 5 Quarter 6 Quarter 7 Quarter 8 Gross Profit Revenues $ 12,700,000 $ 40,000,000 $ 75,000,000 $ 98,000,000 - Rebates $ 205,150 $ 300,000 $ 640,000 $ 750,000 - Cost of Goods Sold $ 5,890,433 $ 15,900,000 $ 33,600,000 $ 39,153,550 = Gross Profit $ 6,604,417 $ 23,800,000 $ 40,760,000 $ 58,096,450 Expenses Research and Development $ 4,421,725 $ 4,980,000 $ 4,980,000 $ 420,000 + Quality Costs $ 442,202 $ 500,000 $ 500,000 $ 500,000 + Advertising $ 608,925 $ 750,000 $ 1,000,000 $ 1,250,000 + Sales Force Expense $ 831,134 $ 1,777,468 $ 3,090,040 $ 3,653,940 + Sales Office and Web Center Expenses $ 1,213,897 $ 1,565,555 $ 2,027,518 $ 1,799,518 + Marketing Research $ 115,000 $ 115,000 $ 115,000 $ 115,000 + Shipping $ 200,197 $ 800,000 $ 1,600,000 $ 1,800,000 + Inventory Holding Cost $ 8,470 $ 68,470 $ 488,470 $ 792,515 + Excess Capacity Cost $ - $ - $ - $ - + Depreciation $ 71,184.25 $ 223,155.25 $ 573,155.25 $ 723,155.25 + Web Marketing Expenses $ - $ 500,000 $ 500,000 $ 500,000 = Total Expenses $ 7,912,734 $ 11,279,648 $ 14,874,183 $ 11,554,128 Operating Profit $ (1,308,317) $ 12,520,352 $ 25,885,817 $ 46,542,322 Miscellaneous Income and Expenses + Licensing Income $ - $ - $ - $ - - Licensing Fees $ - $ - $ - $ - + Other Income $ - $ - $ - $ - - Other Expenses $ - $ - $ - $ - = Earnings Before Interest and Taxes $ (1,308,317) $ 12,520,352 $ 25,885,817 $ 46,542,322 + Interest Income $ - $ - $ - $ - - Interest Charges $ - $ - $ - $ - = Income Before Taxes $ (1,308,317) $ 12,520,352 $ 25,885,817 $ 46,542,322 - Loss Carry Forward $ - $ 1,792,035.53 $ - $ - = Taxable Income $ - $ 10,728,316 $ 25,885,817 $ 46,542,322 - Income Taxes $ - $ 3,218,495 $ 7,765,745 $ 13,962,697 = Net Income $ (1,308,317.25) $ 9,301,856.75 $ 18,120,071.75 $ 32,579,624.75 Earnings per Share $ (14.54) $ 103.35 $ 201.33 $ 362      
  13. 2011  Annual  Report              

             Q  Inc.     -­‐  12  -­‐   PRO  FORMA  BALANCE  SHEET  Q1  –  Q4   Quarter 1 Quarter 2 Quarter 3 Quarter 4 Current Assets Short Term Assets + Cash $ 1.36 $ 49,999.64 $ 387,822.82 $1,749,897.81 + 3 Month Certificate of Deposit $ 970,557 $ 354,819 $ - $ - + Finished Goods Inventory $ - $ - $ 161,647.33 $ 149,663.42 Long Term Assets + Sinking Fund $ - $ - $ - $ - + Net Fixed Assets $ - $ 1,100,550 $ 1,054,693.75 $ 1,616,720.50 = Total $ 970,558.36 $ 1,505,368.64 $ 1,604,163.90 $ 3,516,281.72 Debt Conventional Bank Loan $ - $ - $ - $ - + Long-Term Loan $ - $ - $ - $ - + Emergency Loan $ - $ - $ - $ - Equity + Common Stock $ 1,000,000 $ 2,000,000 $ 3,000,000 $ 4,000,000 + Retained Earnings $ (29,441.65) $ (494,631.36) $ (1,395,836.10) $ (483,718.28) = Total $ 970,558.36 $1,505,368.64 $ 1,604,163.90 $3,516,281.72     PRO  FORMA  BALANCE  SHEET  Q5  –  Q8   Quarter 5 Quarter 6 Quarter 7 Quarter 8 Current Assets Short Term Assets + Cash $ 930,422.81 $ 1,455,434.81 $12,348,661.81 $ 42,610,991.81 + 3 Month Certificate of Deposit $ - $ - $ - $ - + Finished Goods Inventory $ 84,704.42 $ 684,704.42 $ 4,884,704.42 $ 7,925,154.42 Long Term Assets + Sinking Fund $ - $ - $ - $ - + Net Fixed Assets $ 5,192,837.25 $ 13,369,682 $ 16,396,526.75 $ 15,673,371.50 = Total $ 6,207,964.47 $ 15,509,821.22 $ 33,629,892.97 $ 66,209,517.72 Debt Conventional Bank Loan $ - $ - $ - $ - + Long-Term Loan $ - $ - $ - $ - + Emergency Loan $ - $ - $ - $ - Equity + Common Stock $ 8,000,000 $ 8,000,000 $ 8,000,000 $ 8,000,000 + Retained Earnings $ (1,792,035.53) $ 7,509,821.22 $ 25,629,892.97 $58,209,517.72 = Total $ 6,207,964.47 $ 15,509,821.22 $ 33,629,892.97 $66,209,517.72
  14. 2011  Annual  Report              

             Q  Inc.     -­‐  13  -­‐   CONCLUSION   Q Inc. is dedicated to quality in all aspects of our corporate model. We have been successful in our first year of operations, establishing our company as a market leader and we plan to create an even brighter future. We have captivated our customers in the Innovator and Workhorse market segments, and we hope to further expand to other market segments. SIGNATURES   _____________________________________ Chris Harkey President, Chief Executive Officer _____________________________________ Taylor McCaslin Vice President Marketing & Market Research _____________________________________ Claudia Wei Vice President, Sales Management _____________________________________ Jorge Reyes Vice President, Accounting and Finance _____________________________________ Michael Atmadja Vice President, Human Resources _____________________________________ Samina Qureshi Vice President, Manufacturing