Sr. Software Engineer Cardinal Systems [email protected] CHRISTIAN STALLINGS, CP Research & Development Manager McKim & Creed [email protected] RESEARCH TEAM
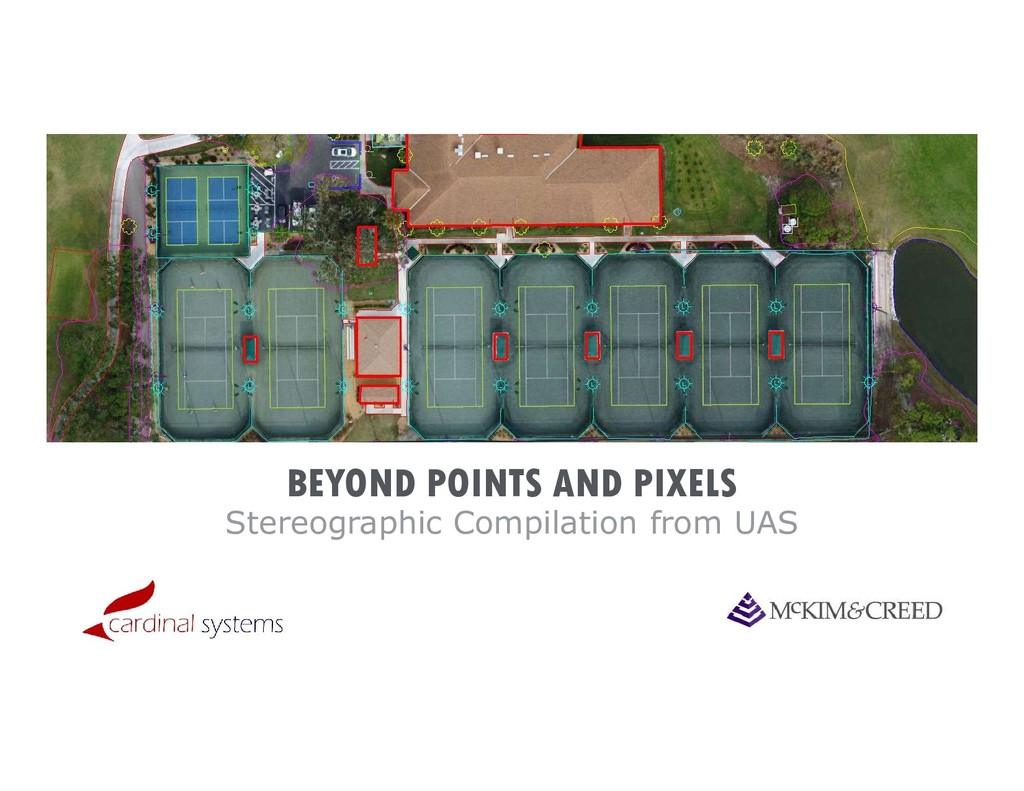
OF DRONES AND MAPPING Often times for many projects, image derived point clouds are all you need. Comparatively to conventional survey, this approach has changed the way certain projects are approached by lowering the cost while increasing the speed, data quality, and safety
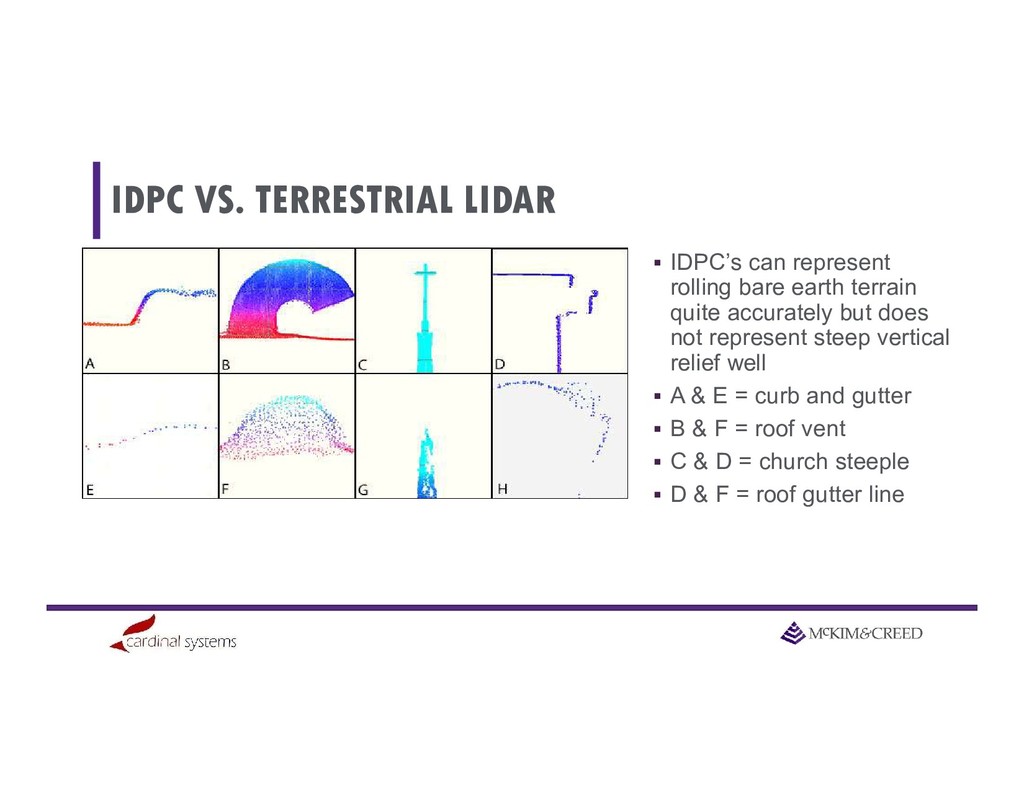
TERRESTRIAL LIDAR IDPC’s can represent rolling bare earth terrain quite accurately but does not represent steep vertical relief well A & E = curb and gutter B & F = roof vent C & D = church steeple D & F = roof gutter line
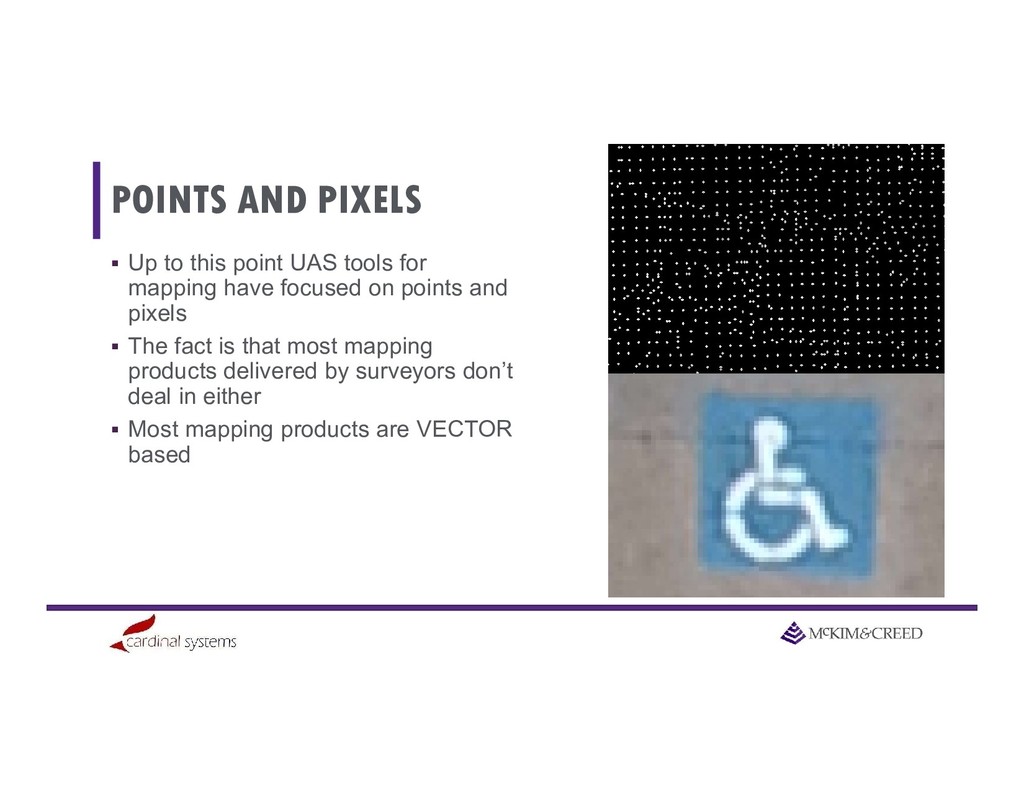
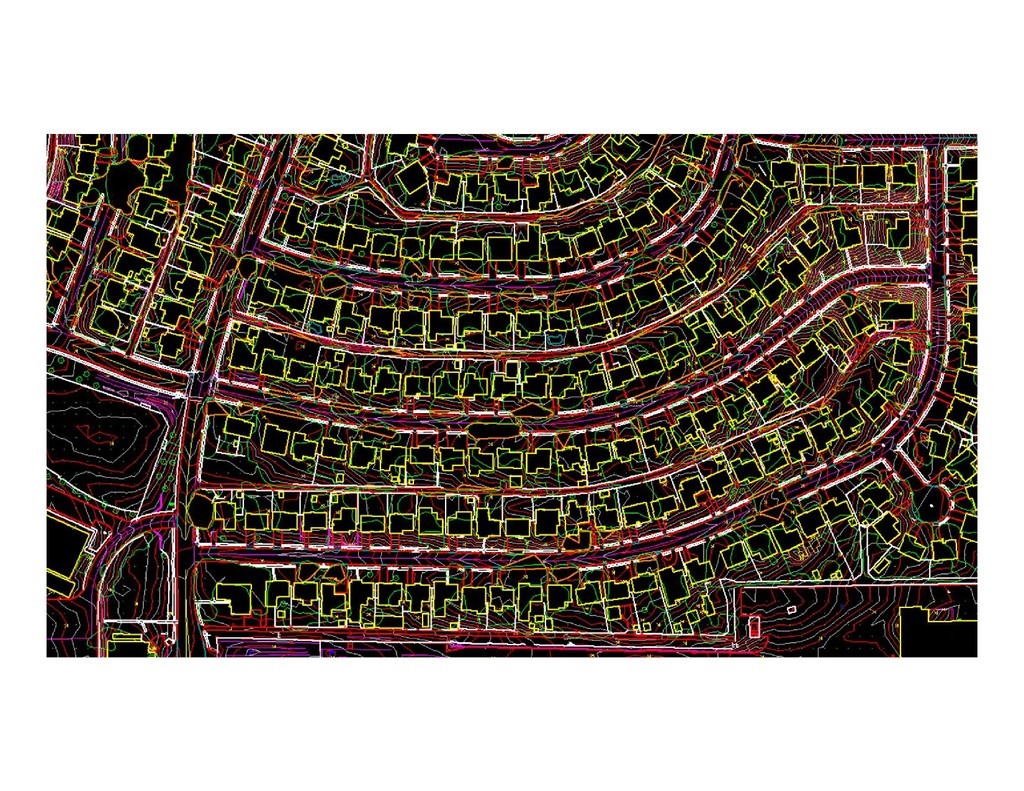
PIXELS Up to this point UAS tools for mapping have focused on points and pixels The fact is that most mapping products delivered by surveyors don’t deal in either Most mapping products are VECTOR based
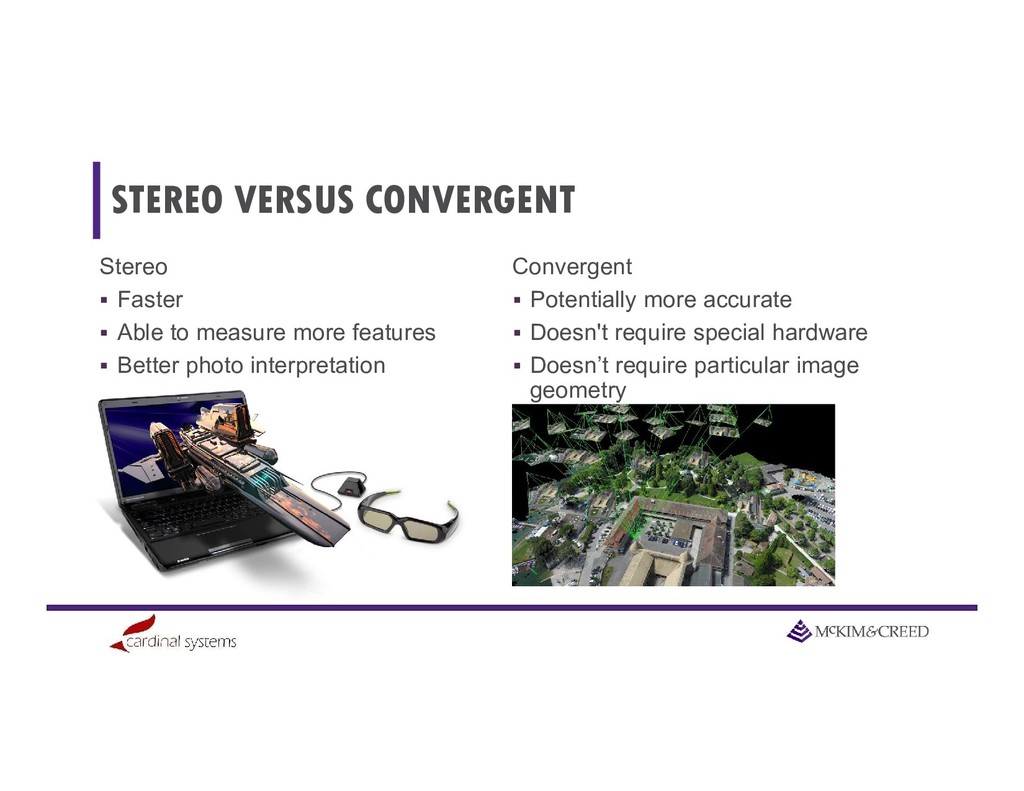
more features Better photo interpretation Convergent Potentially more accurate Doesn't require special hardware Doesn’t require particular image geometry
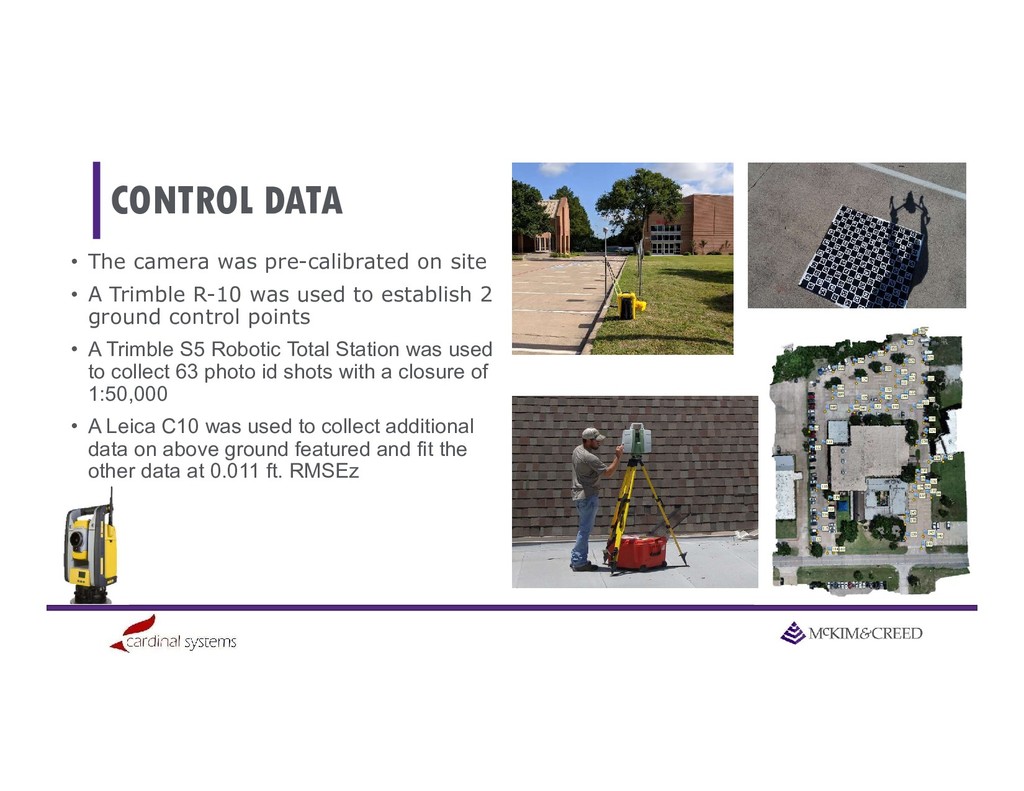
• The camera was pre-calibrated on site • A Trimble R-10 was used to establish 2 ground control points • A Trimble S5 Robotic Total Station was used to collect 63 photo id shots with a closure of 1:50,000 • A Leica C10 was used to collect additional data on above ground featured and fit the other data at 0.011 ft. RMSEz
CONT. The Terrestrial Scan was then used to extract additional above ground points that could be measured in the UAS data 18 challenge points that were on edges or tips of objects were selected 32 points that were on flat roof surfaces were also collected
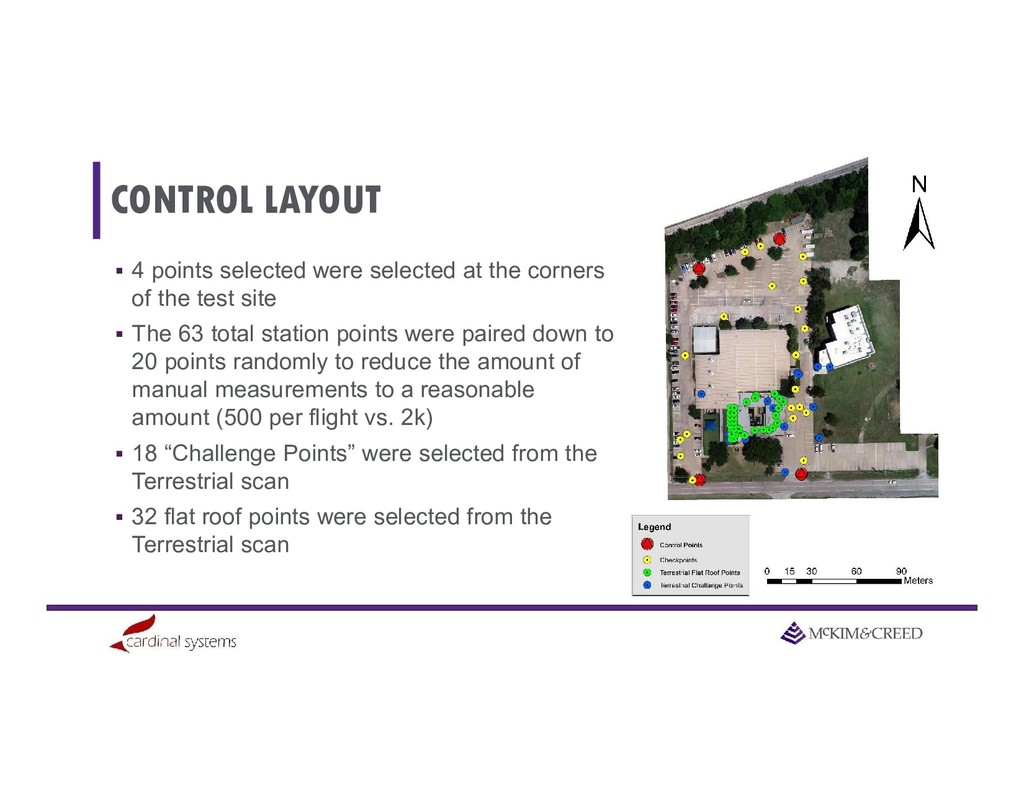
4 points selected were selected at the corners of the test site The 63 total station points were paired down to 20 points randomly to reduce the amount of manual measurements to a reasonable amount (500 per flight vs. 2k) 18 “Challenge Points” were selected from the Terrestrial scan 32 flat roof points were selected from the Terrestrial scan
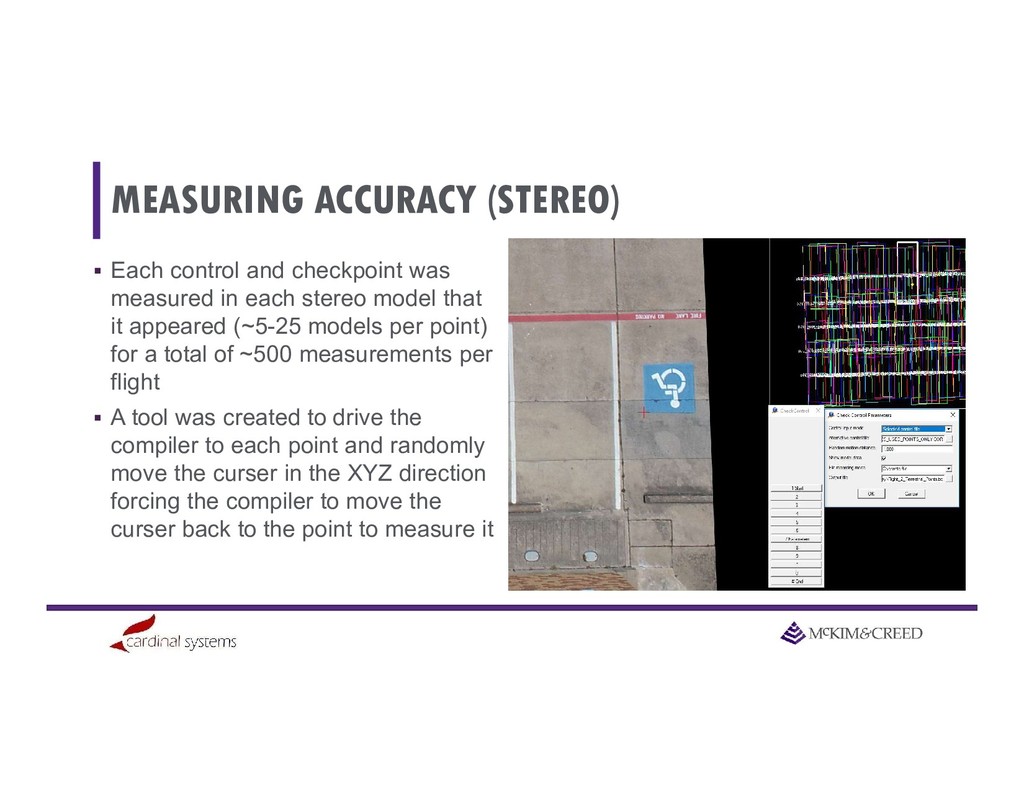
(STEREO) Each control and checkpoint was measured in each stereo model that it appeared (~5-25 models per point) for a total of ~500 measurements per flight A tool was created to drive the compiler to each point and randomly move the curser in the XYZ direction forcing the compiler to move the curser back to the point to measure it
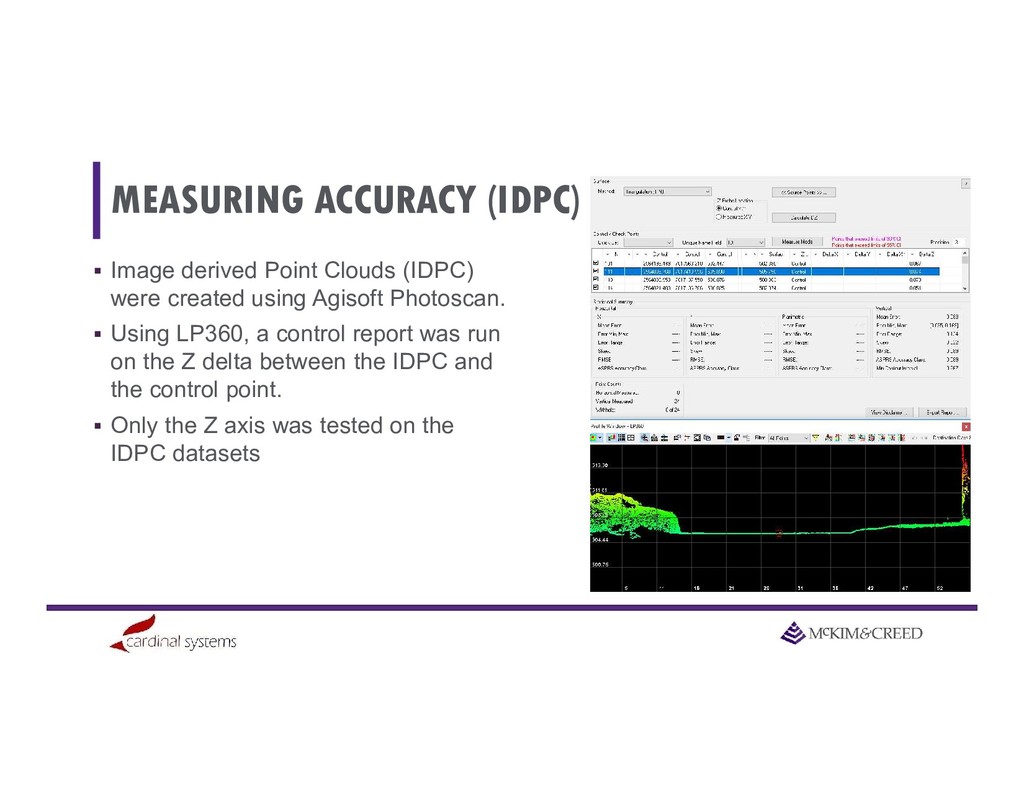
(IDPC) Image derived Point Clouds (IDPC) were created using Agisoft Photoscan. Using LP360, a control report was run on the Z delta between the IDPC and the control point. Only the Z axis was tested on the IDPC datasets
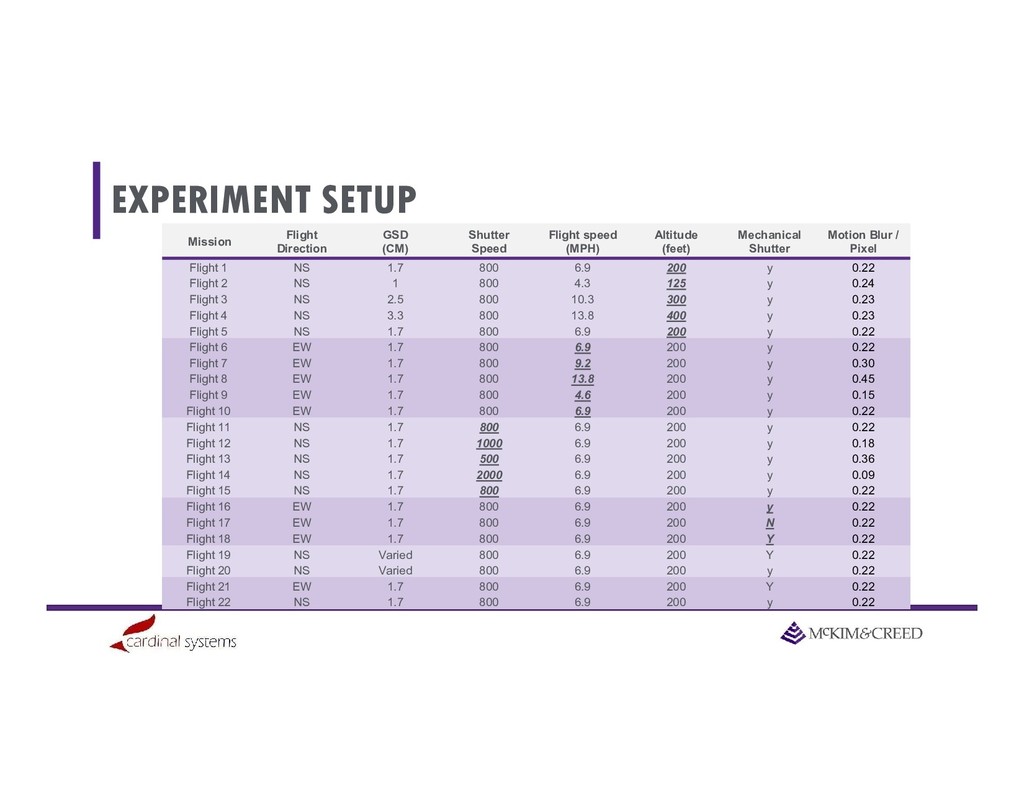
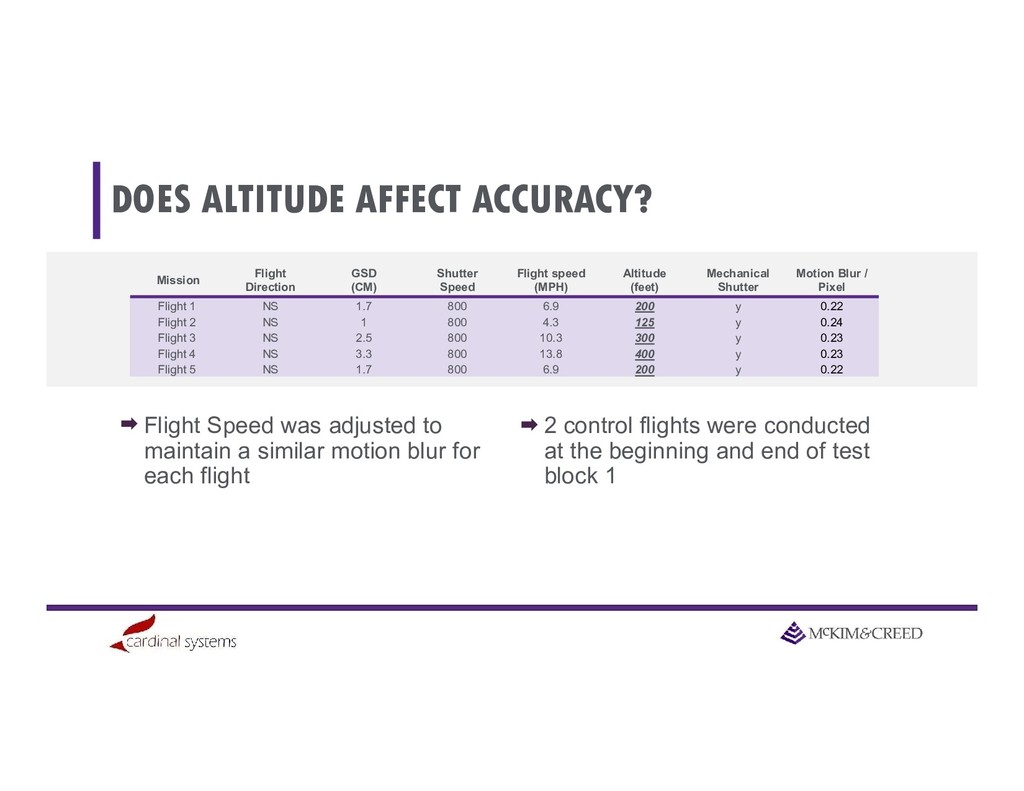
AFFECT ACCURACY? 2 control flights were conducted at the beginning and end of test block 1 Mission Flight Direction GSD (CM) Shutter Speed Flight speed (MPH) Altitude (feet) Mechanical Shutter Motion Blur / Pixel Flight 1 NS 1.7 800 6.9 200 y 0.22 Flight 2 NS 1 800 4.3 125 y 0.24 Flight 3 NS 2.5 800 10.3 300 y 0.23 Flight 4 NS 3.3 800 13.8 400 y 0.23 Flight 5 NS 1.7 800 6.9 200 y 0.22 Flight Speed was adjusted to maintain a similar motion blur for each flight
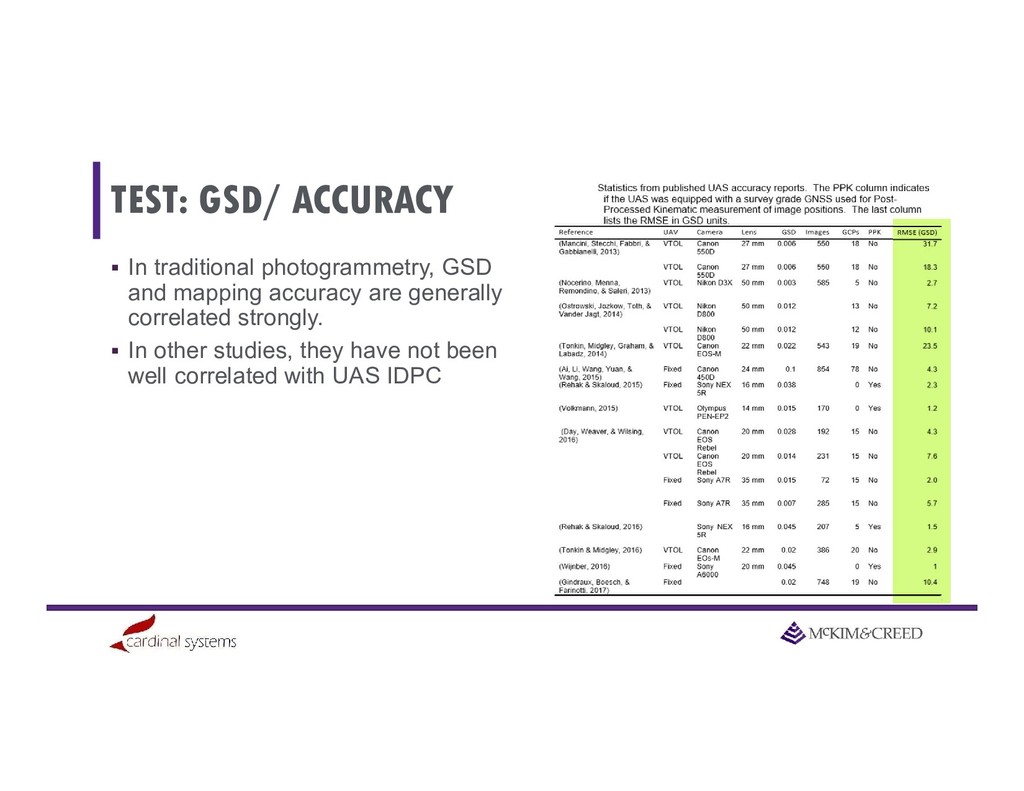
ACCURACY In traditional photogrammetry, GSD and mapping accuracy are generally correlated strongly. In other studies, they have not been well correlated with UAS IDPC
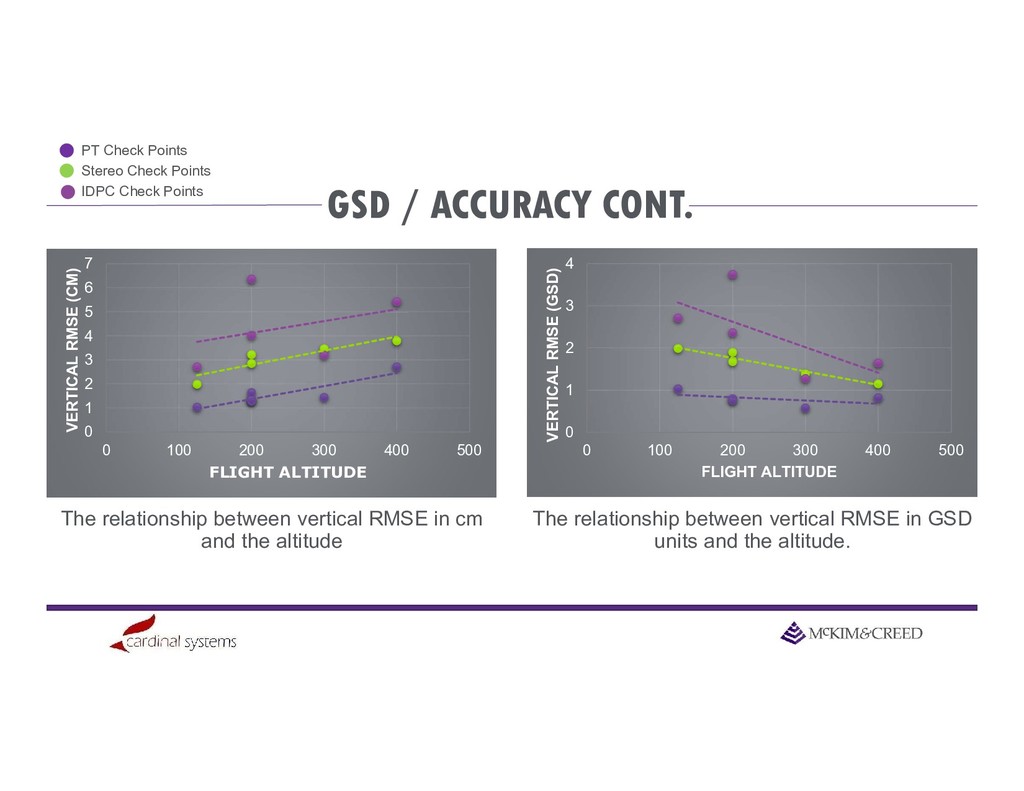
linear correlation squared were: • 0.8146 for Stereo measurements • 0.7909 for Photo Triangulation measurements • 0.1177 for Image derived point cloud measurements IDPC’s showed a higher level of noise and a weak correlation to the GSD resulting in a more randomized result.
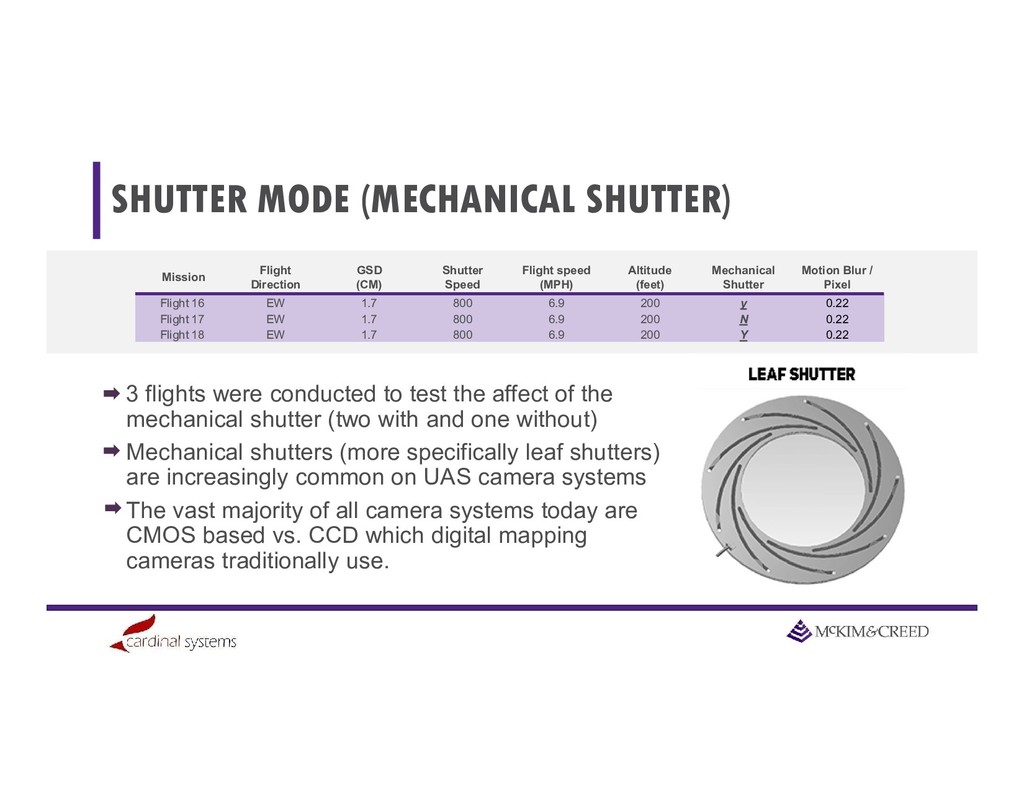
the affect of the mechanical shutter (two with and one without) Mechanical shutters (more specifically leaf shutters) are increasingly common on UAS camera systems The vast majority of all camera systems today are CMOS based vs. CCD which digital mapping cameras traditionally use. Mission Flight Direction GSD (CM) Shutter Speed Flight speed (MPH) Altitude (feet) Mechanical Shutter Motion Blur / Pixel Flight 16 EW 1.7 800 6.9 200 y 0.22 Flight 17 EW 1.7 800 6.9 200 N 0.22 Flight 18 EW 1.7 800 6.9 200 Y 0.22
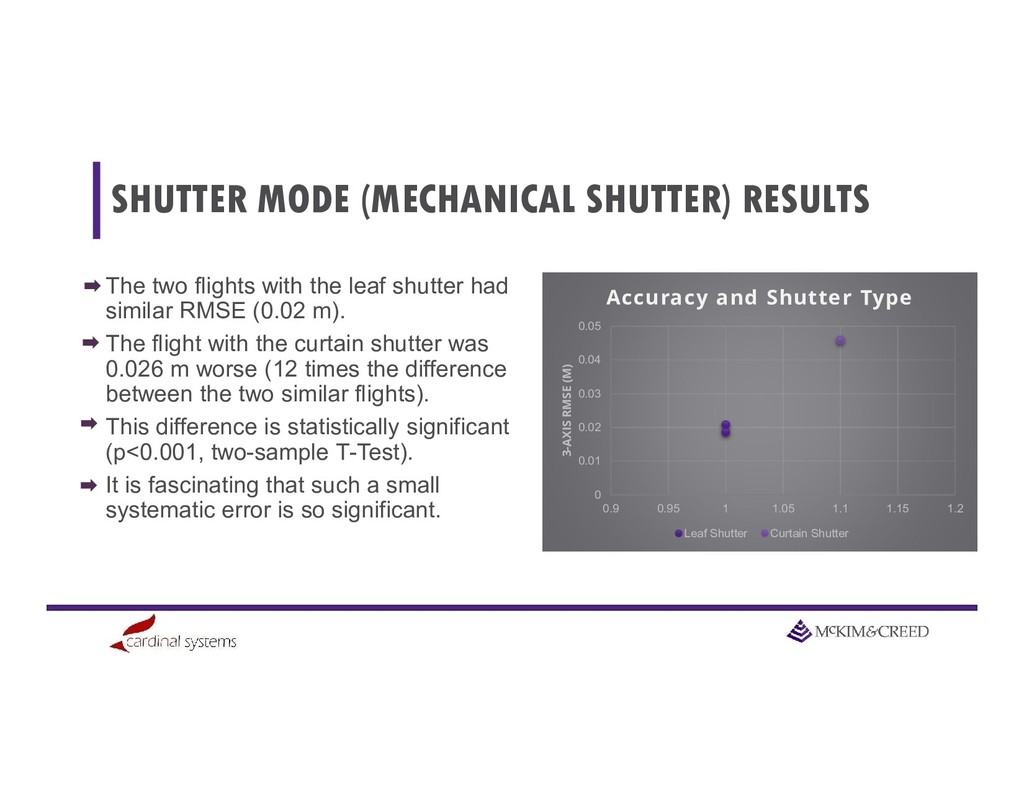
0.05 0.9 0.95 1 1.05 1.1 1.15 1.2 3-AXIS RMSE (M) Accuracy and Shutter Type Leaf Shutter Curtain Shutter The two flights with the leaf shutter had similar RMSE (0.02 m). The flight with the curtain shutter was 0.026 m worse (12 times the difference between the two similar flights). This difference is statistically significant (p<0.001, two-sample T-Test). It is fascinating that such a small systematic error is so significant.
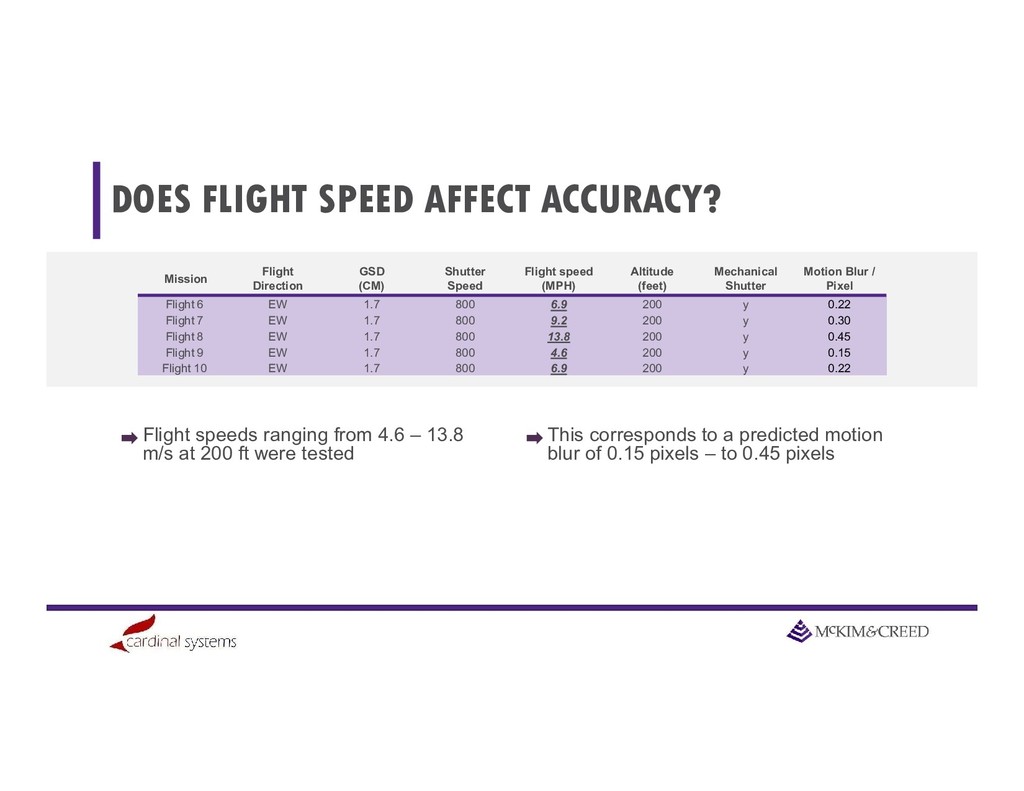
– 13.8 m/s at 200 ft were tested This corresponds to a predicted motion blur of 0.15 pixels – to 0.45 pixels Mission Flight Direction GSD (CM) Shutter Speed Flight speed (MPH) Altitude (feet) Mechanical Shutter Motion Blur / Pixel Flight 6 EW 1.7 800 6.9 200 y 0.22 Flight 7 EW 1.7 800 9.2 200 y 0.30 Flight 8 EW 1.7 800 13.8 200 y 0.45 Flight 9 EW 1.7 800 4.6 200 y 0.15 Flight 10 EW 1.7 800 6.9 200 y 0.22
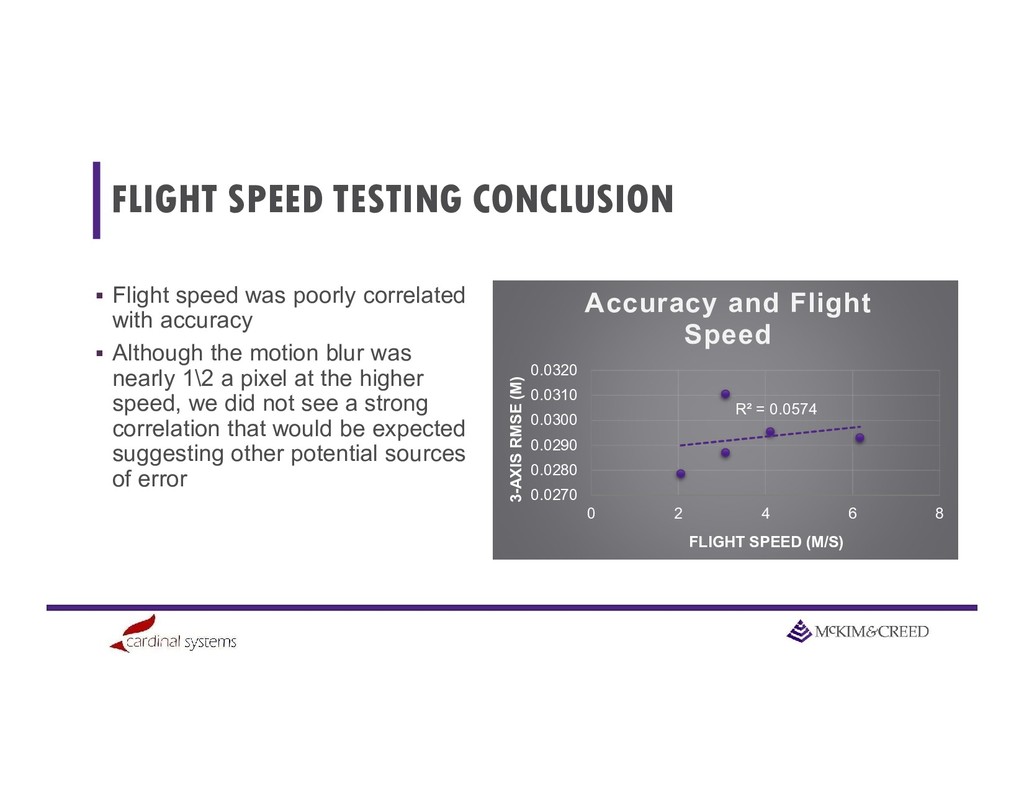
with accuracy Although the motion blur was nearly 1\2 a pixel at the higher speed, we did not see a strong correlation that would be expected suggesting other potential sources of error R² = 0.0574 0.0270 0.0280 0.0290 0.0300 0.0310 0.0320 0 2 4 6 8 3-AXIS RMSE (M) FLIGHT SPEED (M/S) Accuracy and Flight Speed
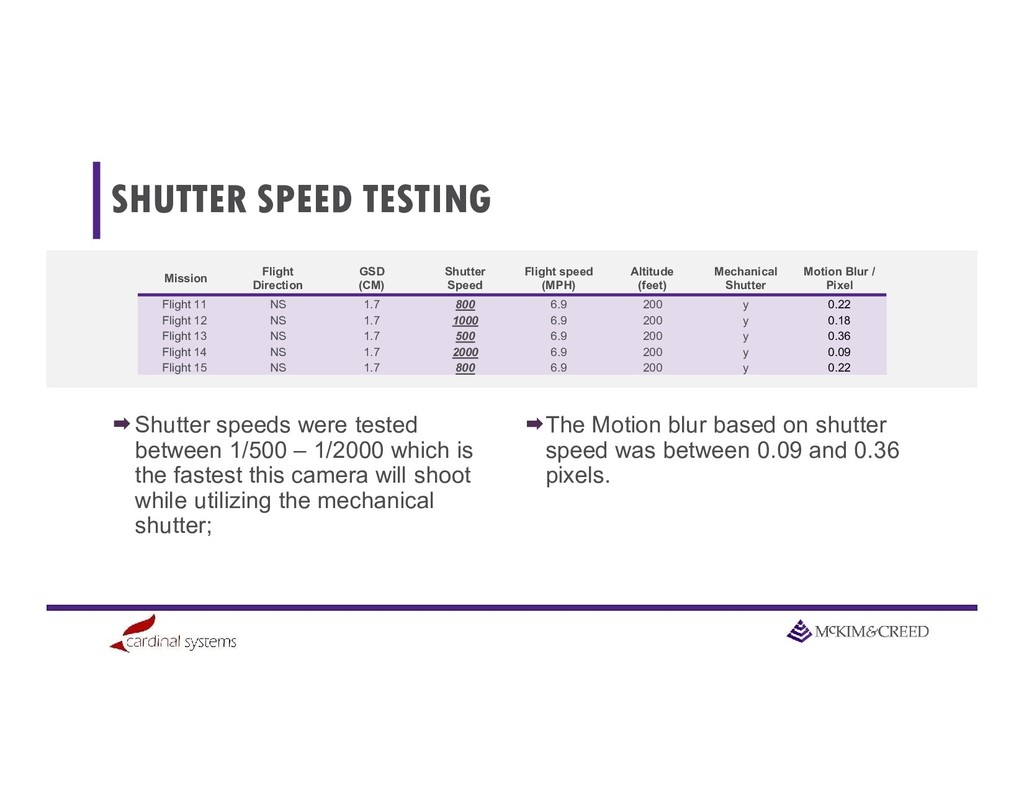
1/2000 which is the fastest this camera will shoot while utilizing the mechanical shutter; The Motion blur based on shutter speed was between 0.09 and 0.36 pixels. Mission Flight Direction GSD (CM) Shutter Speed Flight speed (MPH) Altitude (feet) Mechanical Shutter Motion Blur / Pixel Flight 11 NS 1.7 800 6.9 200 y 0.22 Flight 12 NS 1.7 1000 6.9 200 y 0.18 Flight 13 NS 1.7 500 6.9 200 y 0.36 Flight 14 NS 1.7 2000 6.9 200 y 0.09 Flight 15 NS 1.7 800 6.9 200 y 0.22
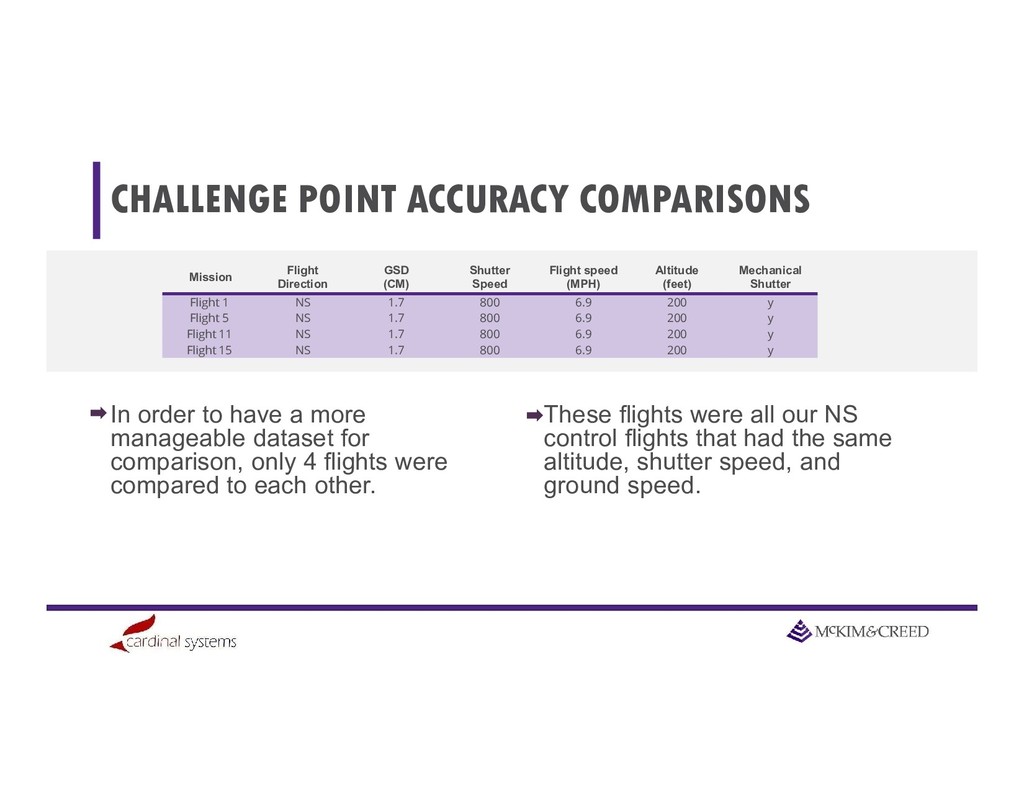
manageable dataset for comparison, only 4 flights were compared to each other. These flights were all our NS control flights that had the same altitude, shutter speed, and ground speed. Mission Flight Direction GSD (CM) Shutter Speed Flight speed (MPH) Altitude (feet) Mechanical Shutter Flight 1 NS 1.7 800 6.9 200 y Flight 5 NS 1.7 800 6.9 200 y Flight 11 NS 1.7 800 6.9 200 y Flight 15 NS 1.7 800 6.9 200 y
for a new solar panel installation. It was important to know location and shape of all features including height of each object to determine if they would obstruct the view of each panel. A detailed inventory of every existing rooftop features, the type of feature, and the height and location of those features was needed. Many of these items were as small as outlet boxes which required a high-fidelity approach
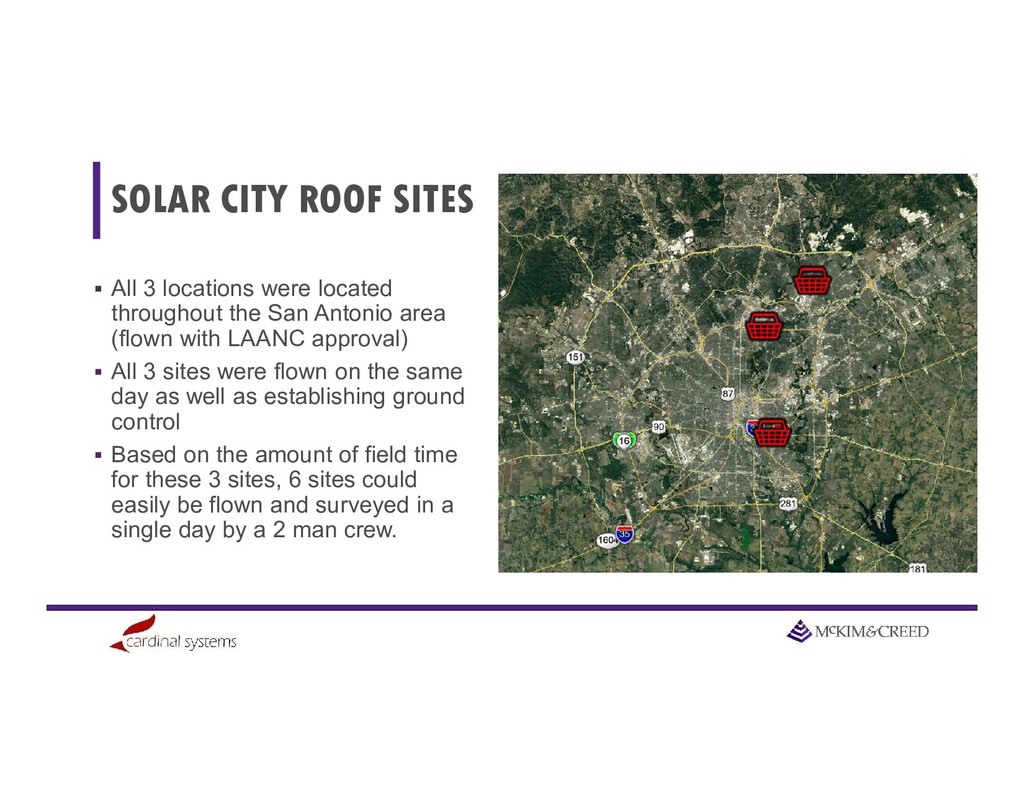
throughout the San Antonio area (flown with LAANC approval) All 3 sites were flown on the same day as well as establishing ground control Based on the amount of field time for these 3 sites, 6 sites could easily be flown and surveyed in a single day by a 2 man crew.
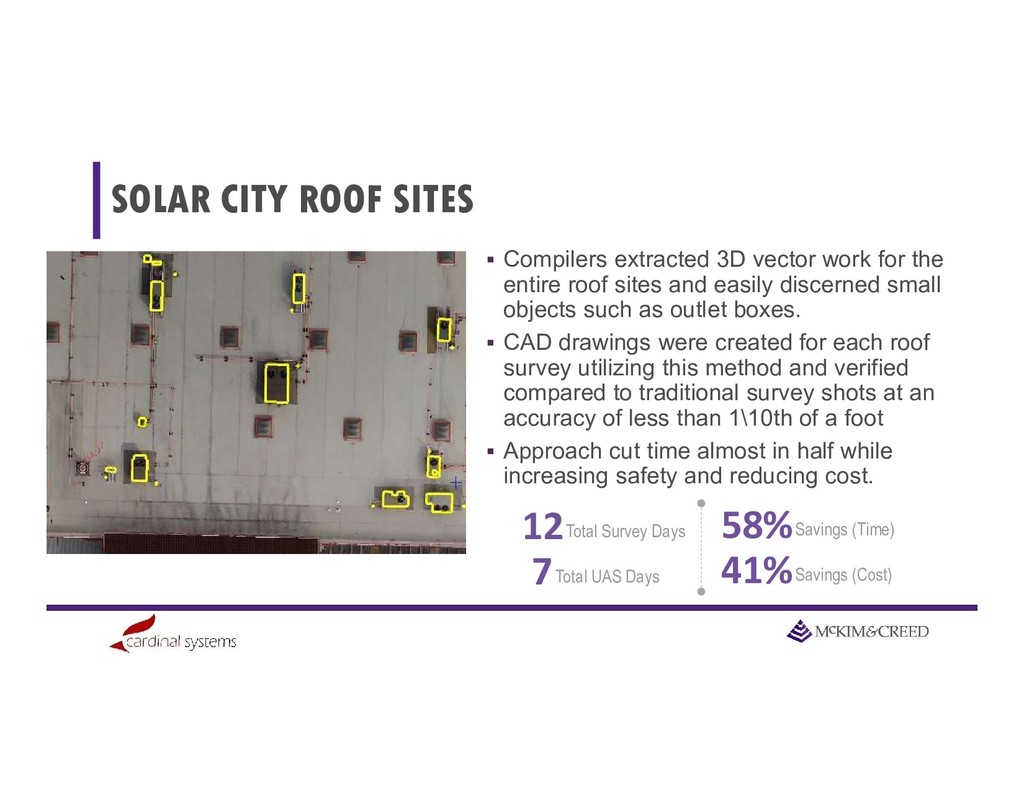
for the entire roof sites and easily discerned small objects such as outlet boxes. CAD drawings were created for each roof survey utilizing this method and verified compared to traditional survey shots at an accuracy of less than 1\10th of a foot Approach cut time almost in half while increasing safety and reducing cost. 12 7 58% 41% Total Survey Days Total UAS Days Savings (Time) Savings (Cost)
parapet walls, a cherry picker and harness system would have been required near the roof edge Survey personnel was placed on the roof using centrally located access to place checkpoints for additional verification Based on our new research, this will not be necessary for future projects and checkpoints can be placed on the ground as well.
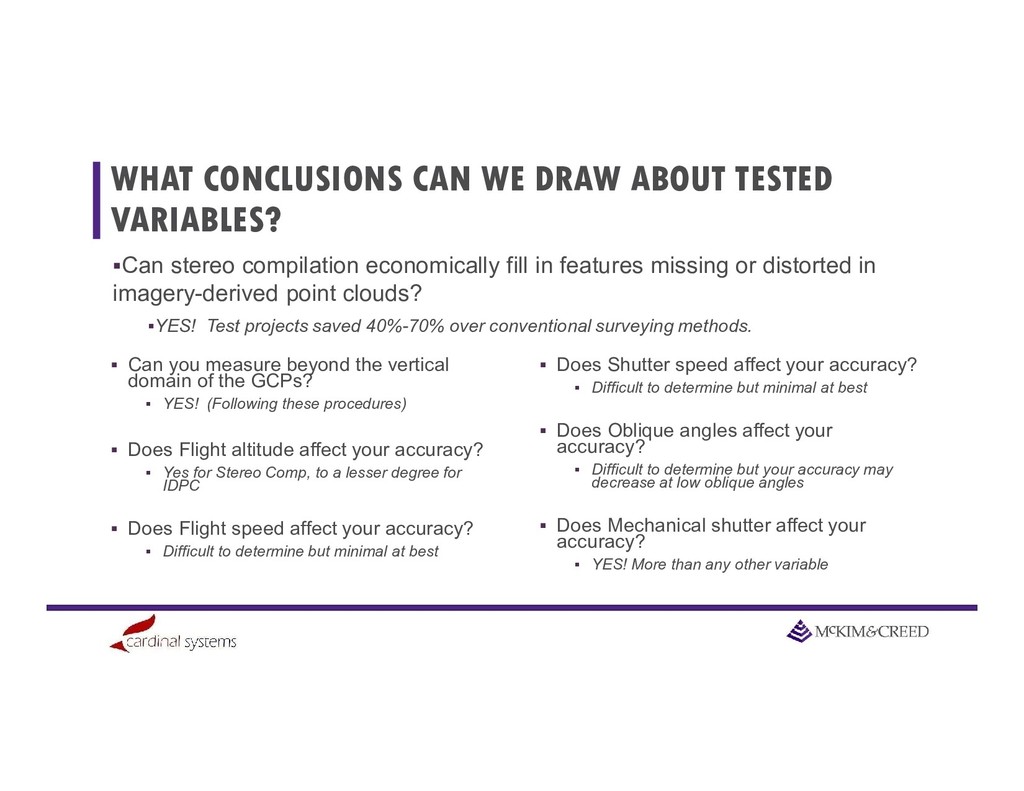
you measure beyond the vertical domain of the GCPs? YES! (Following these procedures) Does Flight altitude affect your accuracy? Yes for Stereo Comp, to a lesser degree for IDPC Does Flight speed affect your accuracy? Difficult to determine but minimal at best Does Shutter speed affect your accuracy? Difficult to determine but minimal at best Does Oblique angles affect your accuracy? Difficult to determine but your accuracy may decrease at low oblique angles Does Mechanical shutter affect your accuracy? YES! More than any other variable Can stereo compilation economically fill in features missing or distorted in imagery-derived point clouds? YES! Test projects saved 40%-70% over conventional surveying methods.
is required to further unlock the full accuracy potential of this approach however our research has shown that it is suitable for many applications and significantly increases the capability of camera based UAS systems Based on an averaged 3cm RMSEx and RMSEy tested accuracy the data would meet/exceed the Legacy ASPRS Map Standard of 1990 for 1:120 (1"=10’) for Class 1 planimetric data and 1:76 (1”=6.3’) based on National Mapping Accuracy Standards (NMAS) Given an averaged vertical accuracy 4cm RMSEz the equivalent FGDC National Standard for Spatial Data Accuracy (NSSDA), at 95% confidence level = 7.84 CM suitable for a vertical minimum contour interval of 0.39 ft.
can achieve high levels of accuracy on features that IDPC’s cannot Stereo compilation is a cost effective and can often be completed quicker than conventional survey Stereo compilation may not be a replacement for LiDAR in all cases but in many it can work just as well with significantly lower cost hardware Stereo compilation can help keep field personnel out of harms way There is still untapped potential in camera based UAS systems in mapping and survey