Professor Emeritus University of South Carolina Available @www.fgdc.gov/ngac Versions to appear in Photogrammetic Engineering and Remote Sensing ArcNews
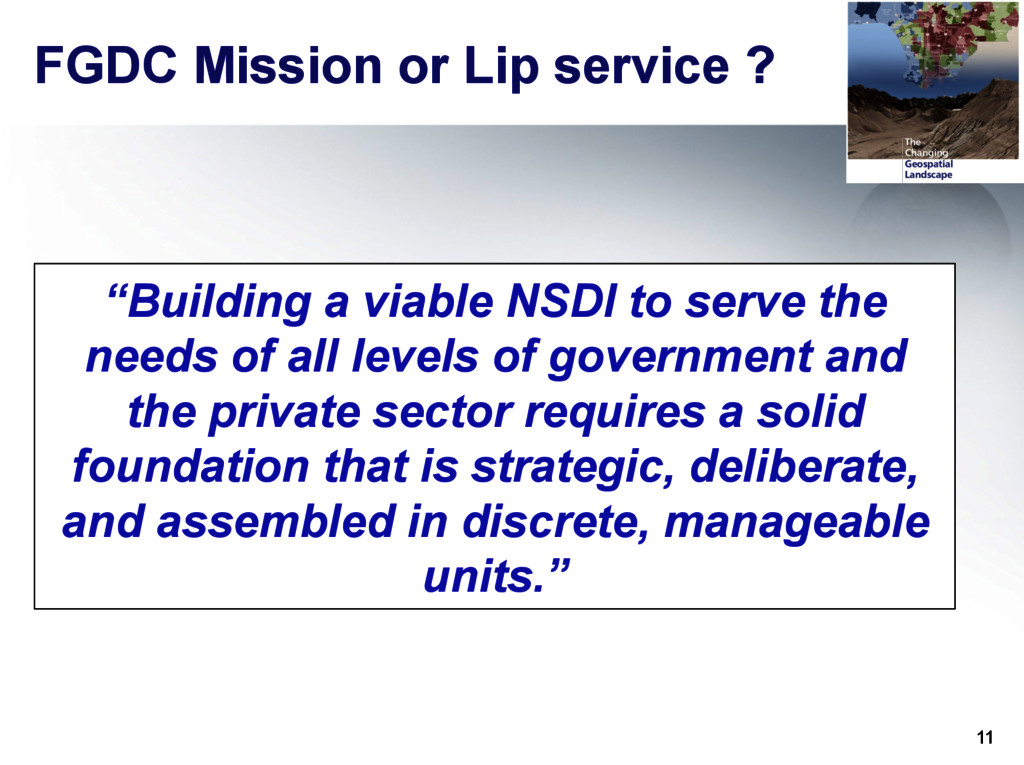
all levels of government and the private sector requires a solid foundation that is strategic, deliberate, and assembled in discrete, manageable units.” FGDC Mission or Lip service ?
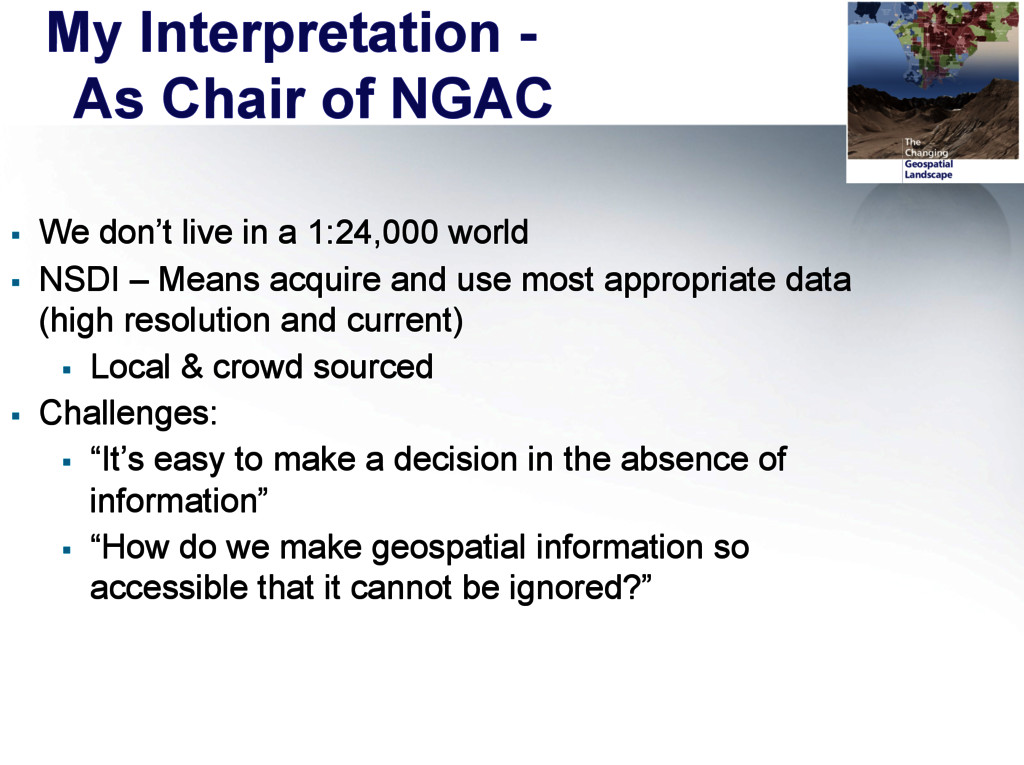
live in a 1:24,000 world § NSDI – Means acquire and use most appropriate data (high resolution and current) § Local & crowd sourced § Challenges: § “It’s easy to make a decision in the absence of information” § “How do we make geospatial information so accessible that it cannot be ignored?”
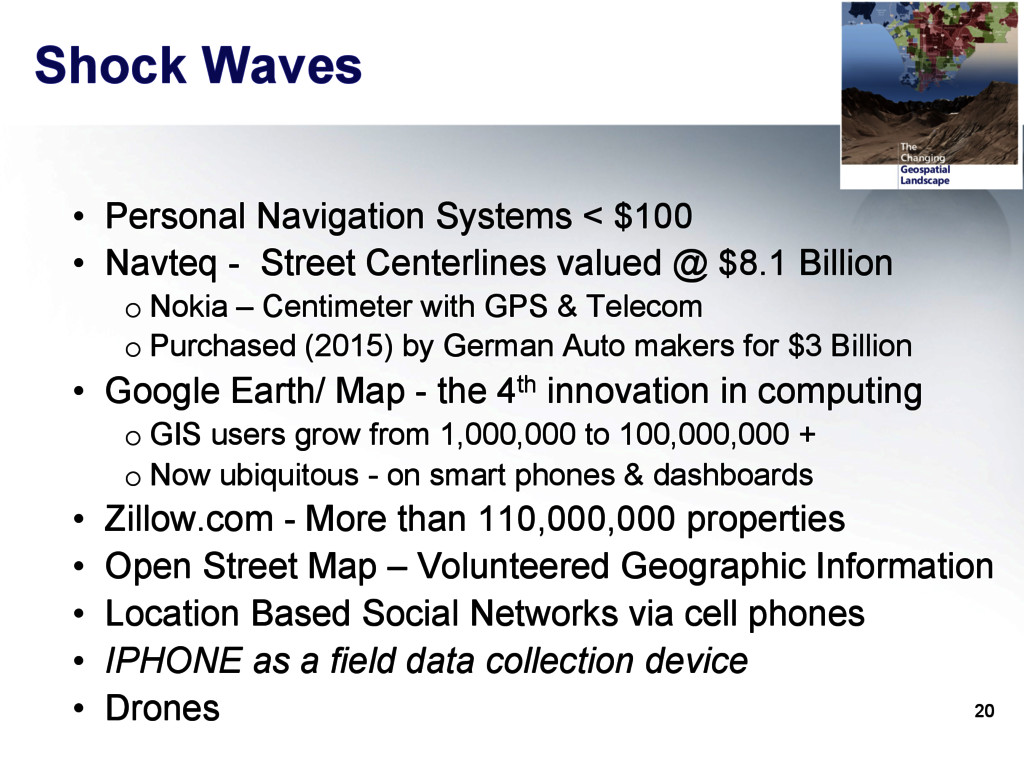
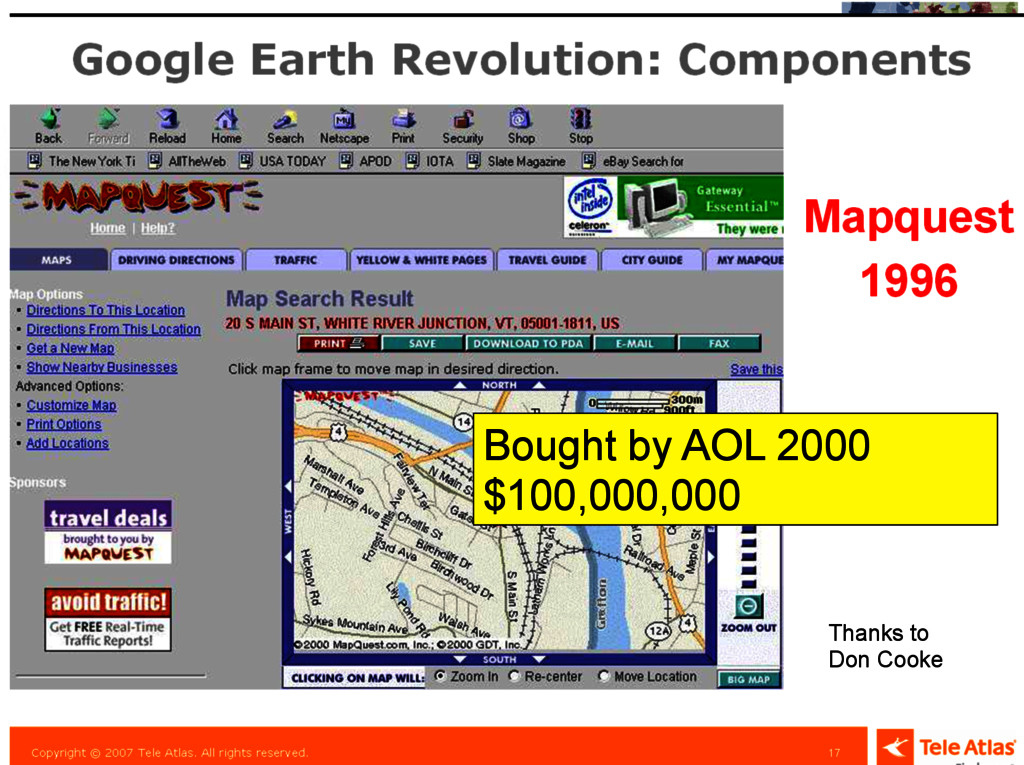
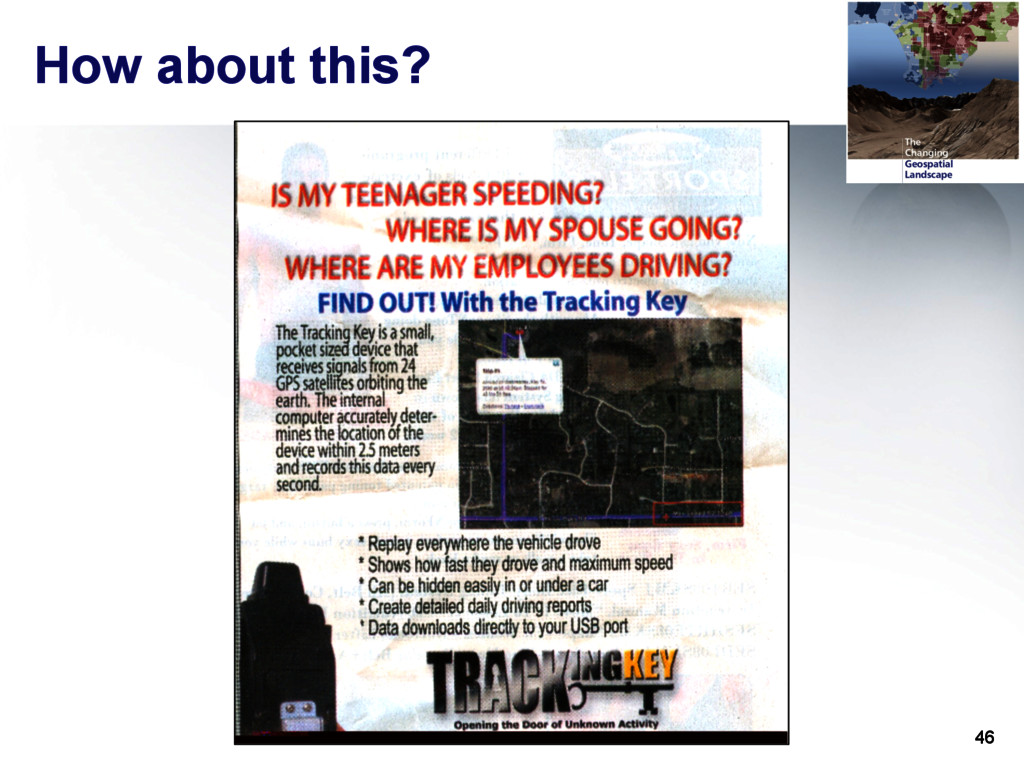
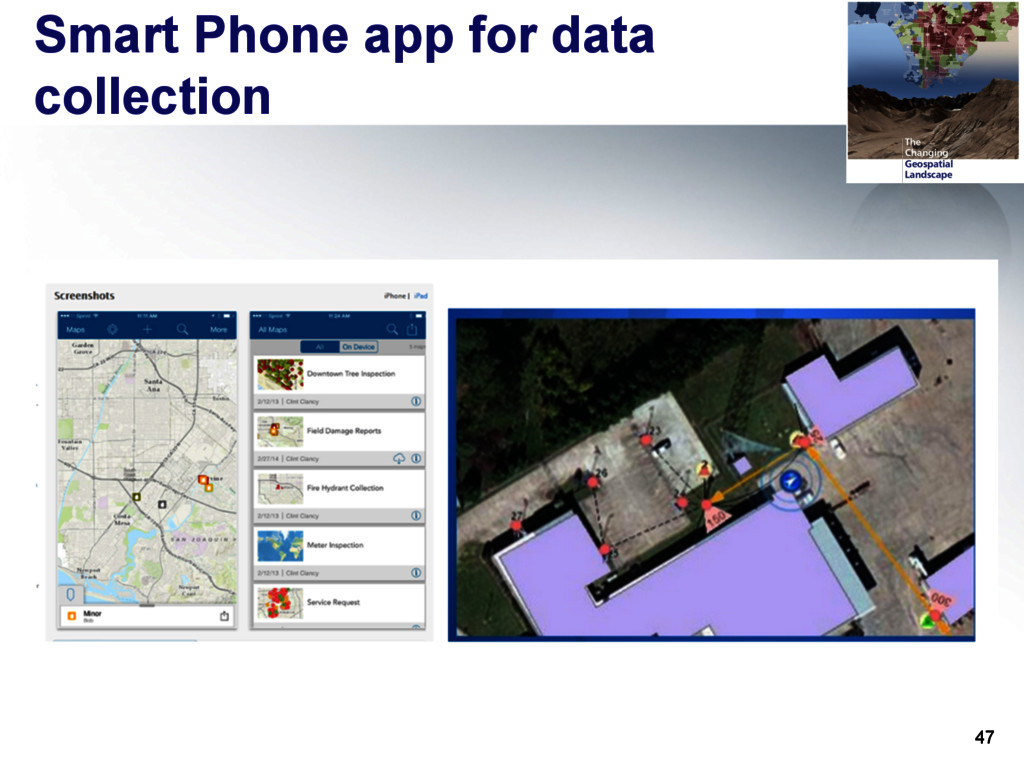
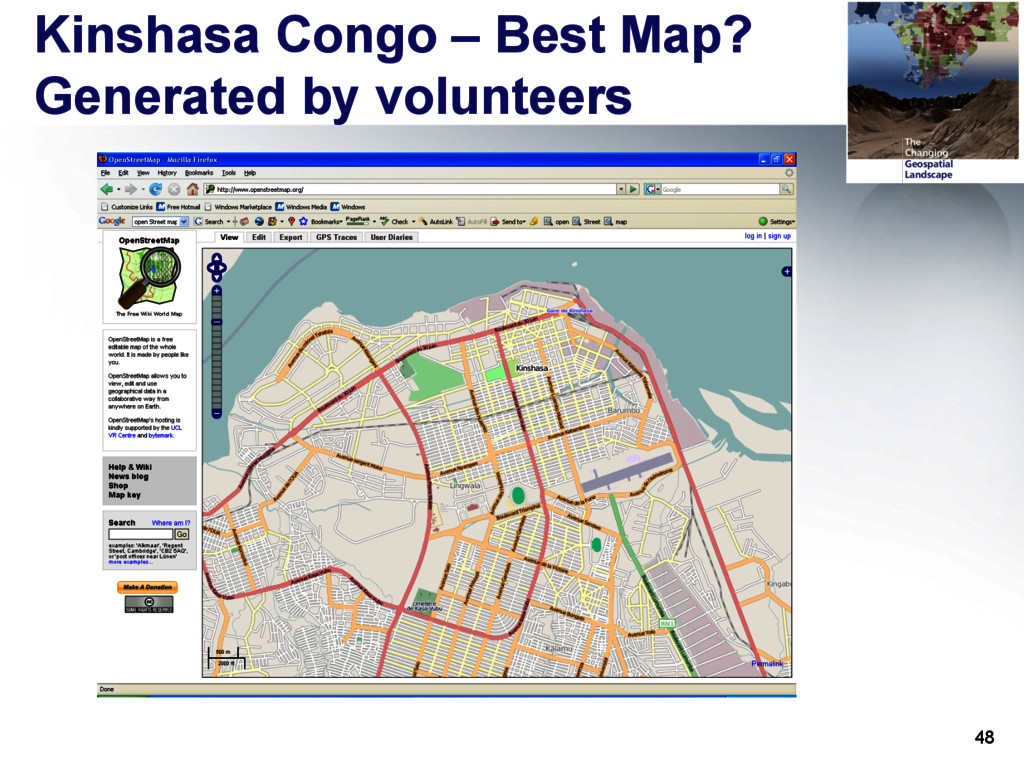
Navteq - Street Centerlines valued @ $8.1 Billion o Nokia – Centimeter with GPS & Telecom o Purchased (2015) by German Auto makers for $3 Billion • Google Earth/ Map - the 4th innovation in computing o GIS users grow from 1,000,000 to 100,000,000 + o Now ubiquitous - on smart phones & dashboards • Zillow.com - More than 110,000,000 properties • Open Street Map – Volunteered Geographic Information • Location Based Social Networks via cell phones • IPHONE as a field data collection device • Drones
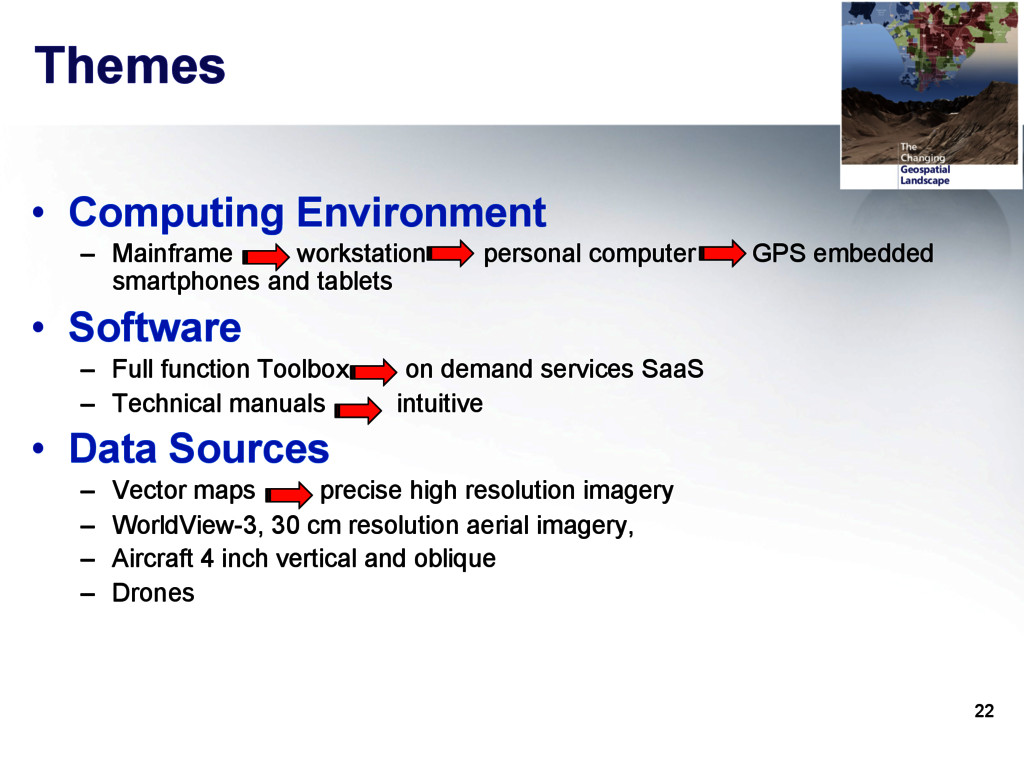
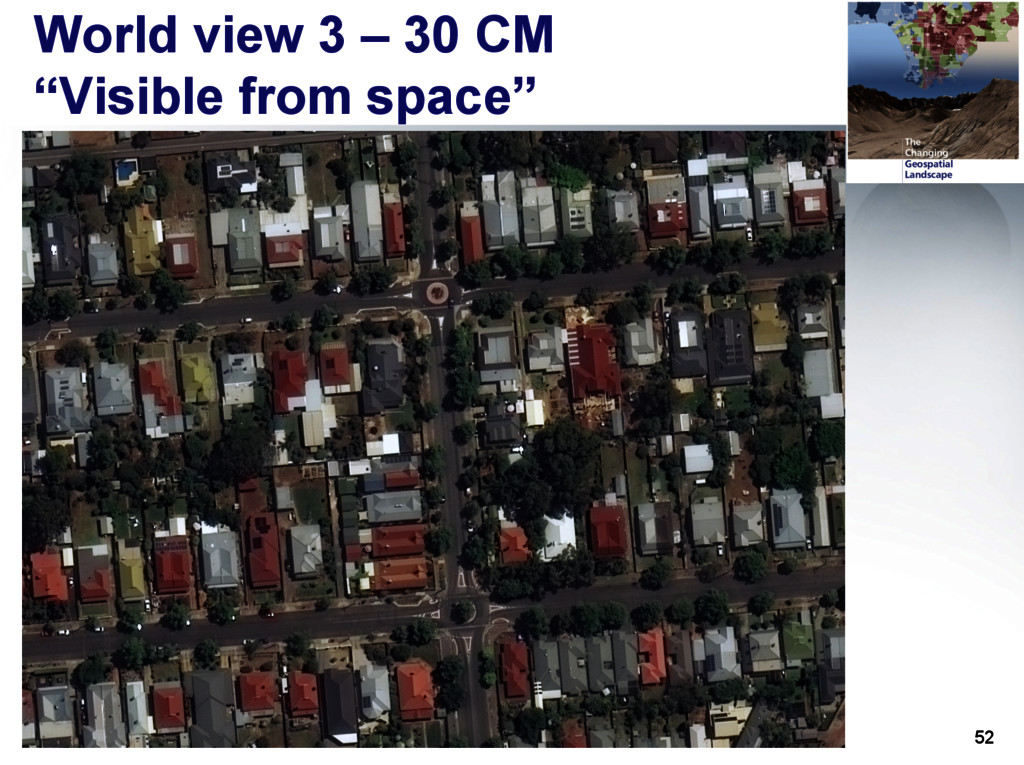
GPS embedded smartphones and tablets • Software – Full function Toolbox on demand services SaaS – Technical manuals intuitive • Data Sources – Vector maps precise high resolution imagery – WorldView-3, 30 cm resolution aerial imagery, – Aircraft 4 inch vertical and oblique – Drones
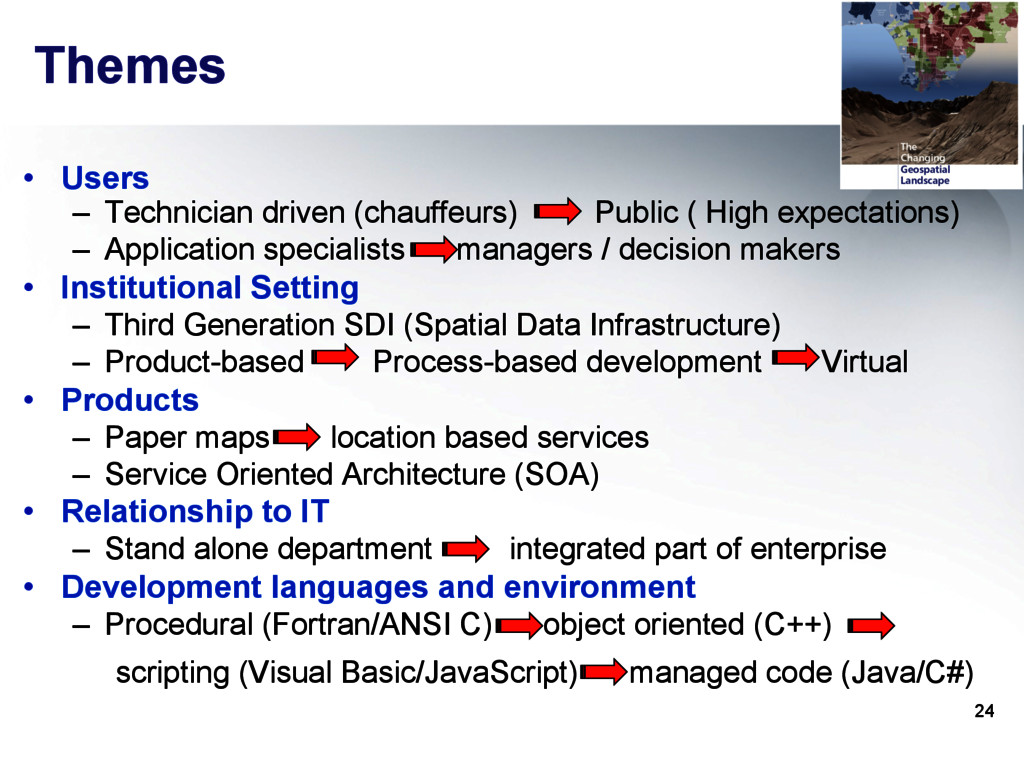
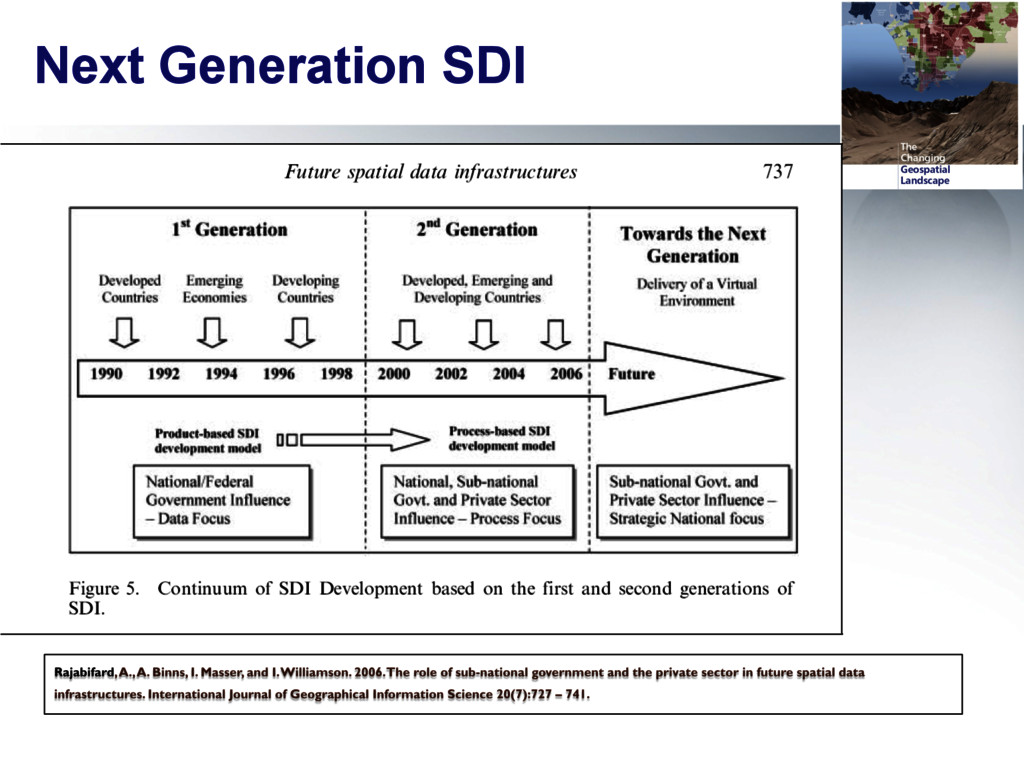
High expectations) – Application specialists managers / decision makers • Institutional Setting – Third Generation SDI (Spatial Data Infrastructure) – Product-based Process-based development Virtual • Products – Paper maps location based services – Service Oriented Architecture (SOA) • Relationship to IT – Stand alone department integrated part of enterprise • Development languages and environment – Procedural (Fortran/ANSI C) object oriented (C++) scripting (Visual Basic/JavaScript) managed code (Java/C#)
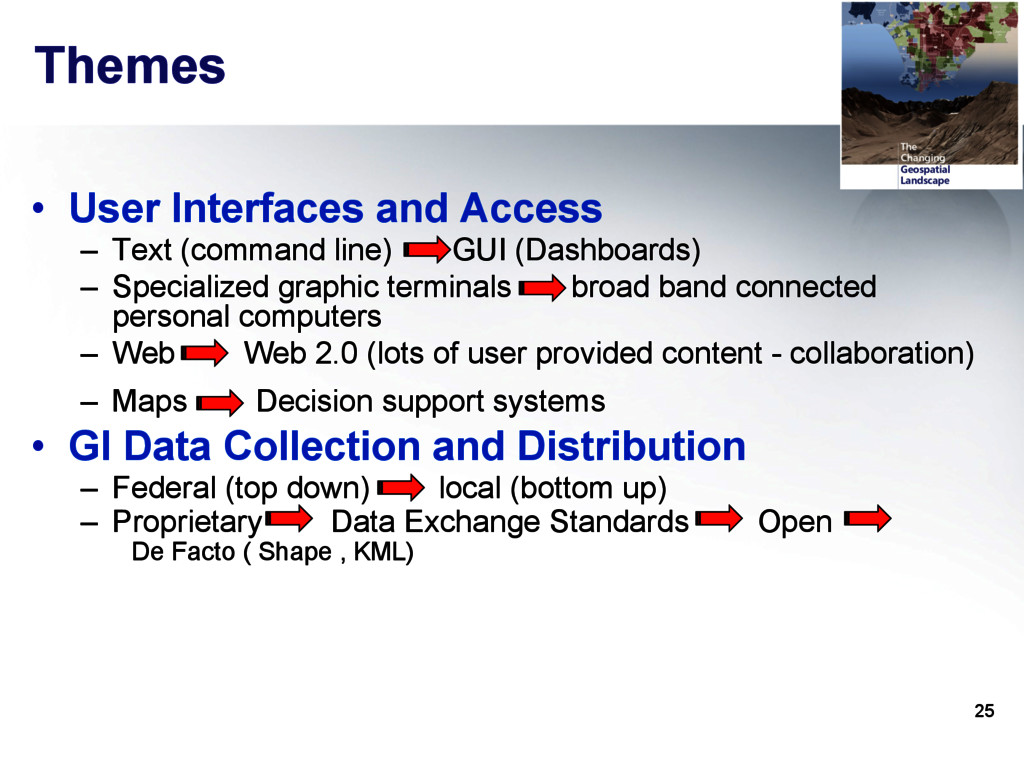
line) GUI (Dashboards) – Specialized graphic terminals broad band connected personal computers – Web Web 2.0 (lots of user provided content - collaboration) – Maps Decision support systems • GI Data Collection and Distribution – Federal (top down) local (bottom up) – Proprietary Data Exchange Standards Open De Facto ( Shape , KML)
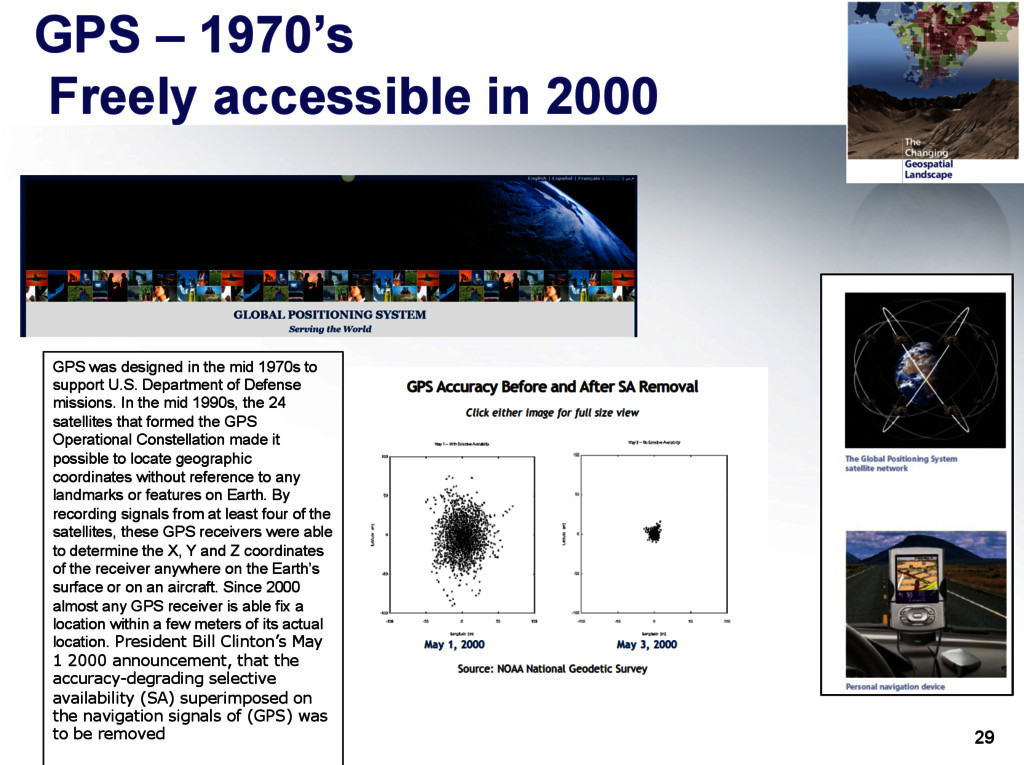
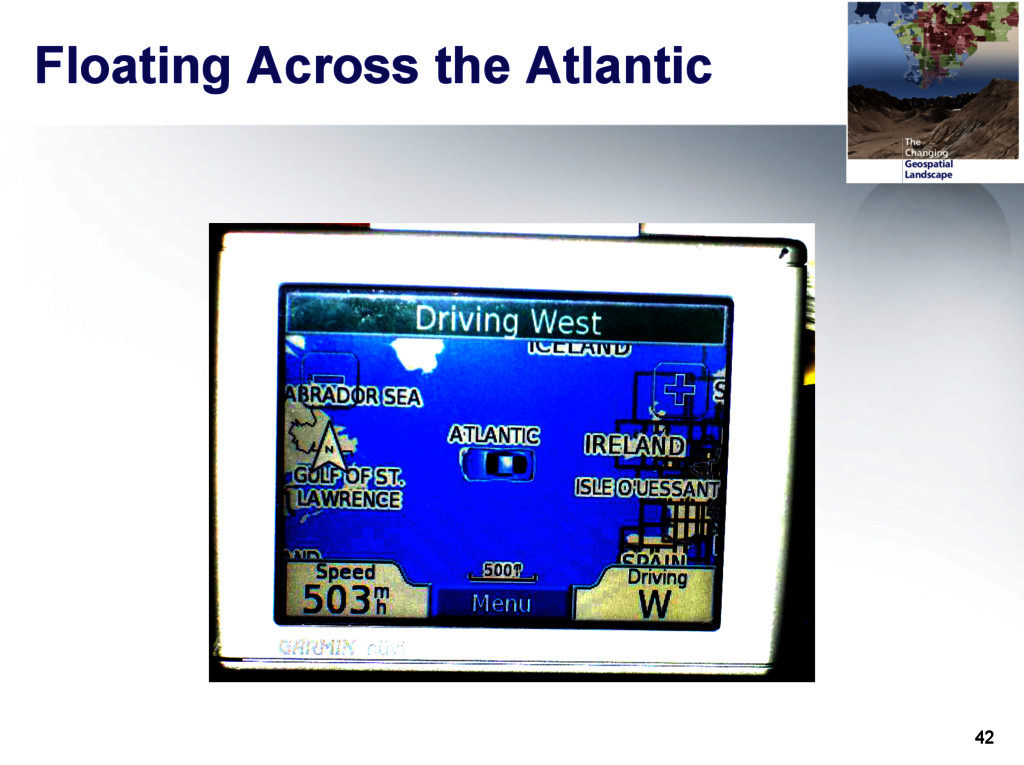
designed in the mid 1970s to support U.S. Department of Defense missions. In the mid 1990s, the 24 satellites that formed the GPS Operational Constellation made it possible to locate geographic coordinates without reference to any landmarks or features on Earth. By recording signals from at least four of the satellites, these GPS receivers were able to determine the X, Y and Z coordinates of the receiver anywhere on the Earth’s surface or on an aircraft. Since 2000 almost any GPS receiver is able fix a location within a few meters of its actual location. President Bill Clinton’s May 1 2000 announcement, that the accuracy-degrading selective availability (SA) superimposed on the navigation signals of (GPS) was to be removed
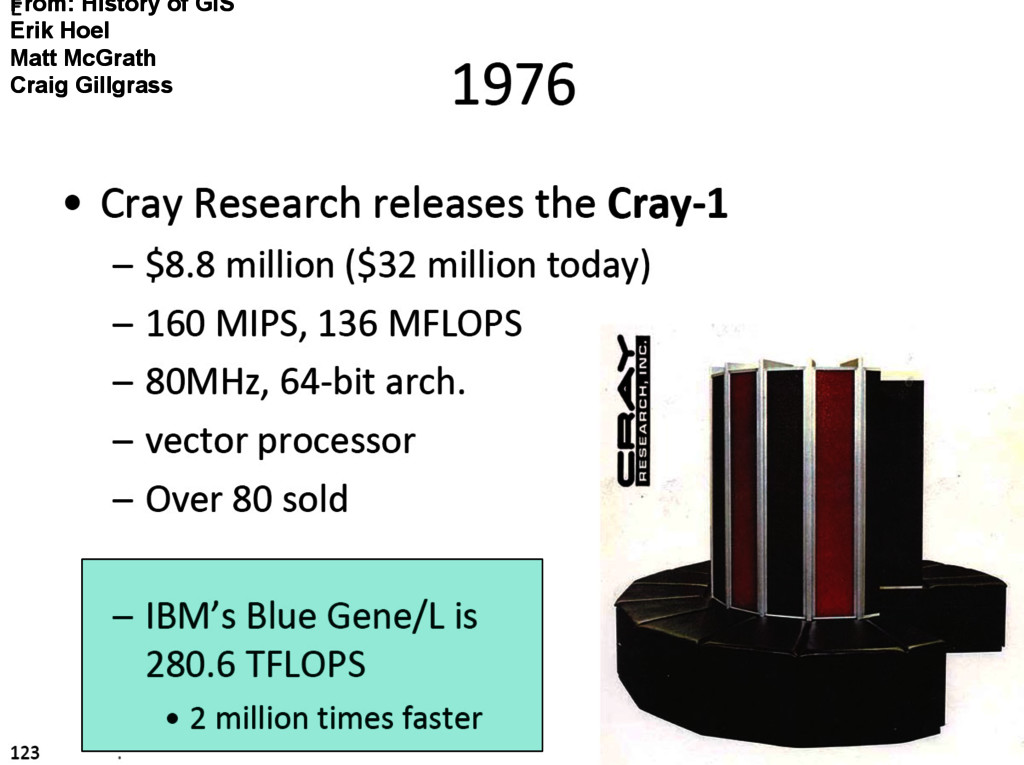
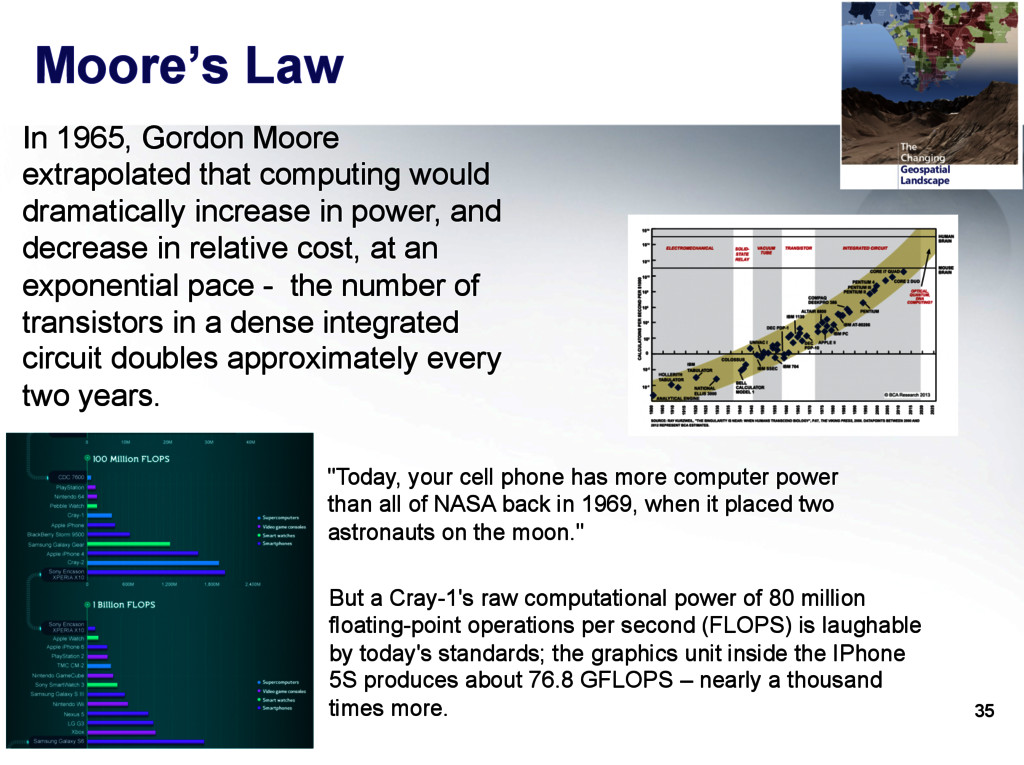
power than all of NASA back in 1969, when it placed two astronauts on the moon." But a Cray-1's raw computational power of 80 million floating-point operations per second (FLOPS) is laughable by today's standards; the graphics unit inside the IPhone 5S produces about 76.8 GFLOPS – nearly a thousand times more. In 1965, Gordon Moore extrapolated that computing would dramatically increase in power, and decrease in relative cost, at an exponential pace - the number of transistors in a dense integrated circuit doubles approximately every two years.
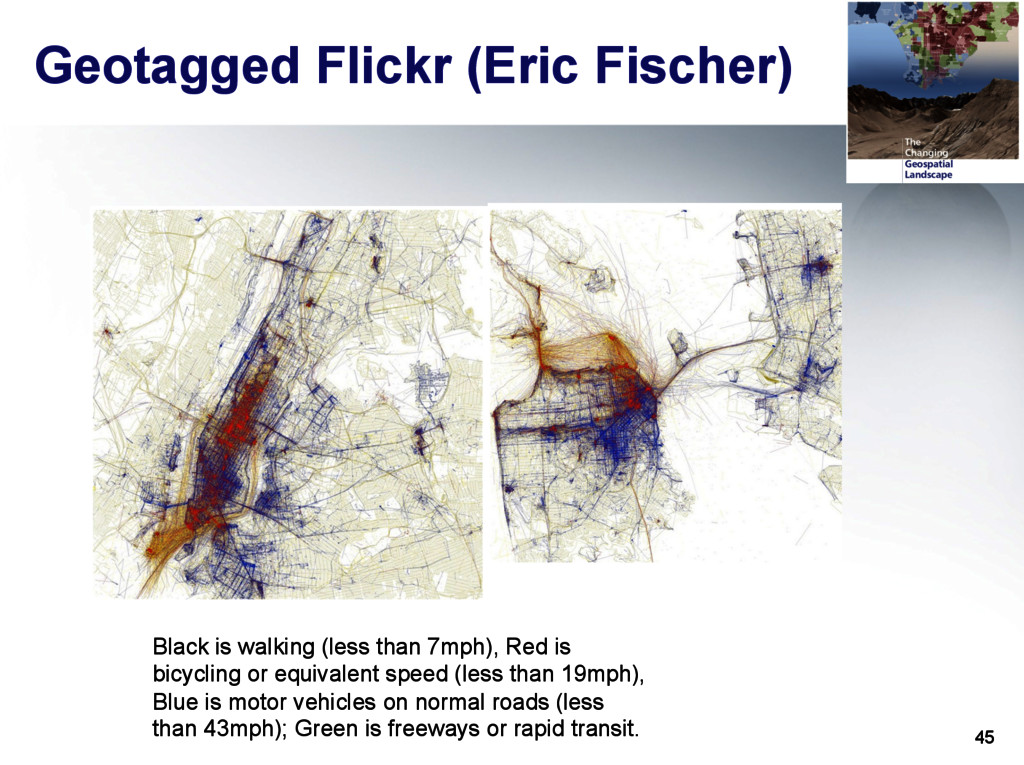
7mph), Red is bicycling or equivalent speed (less than 19mph), Blue is motor vehicles on normal roads (less than 43mph); Green is freeways or rapid transit.
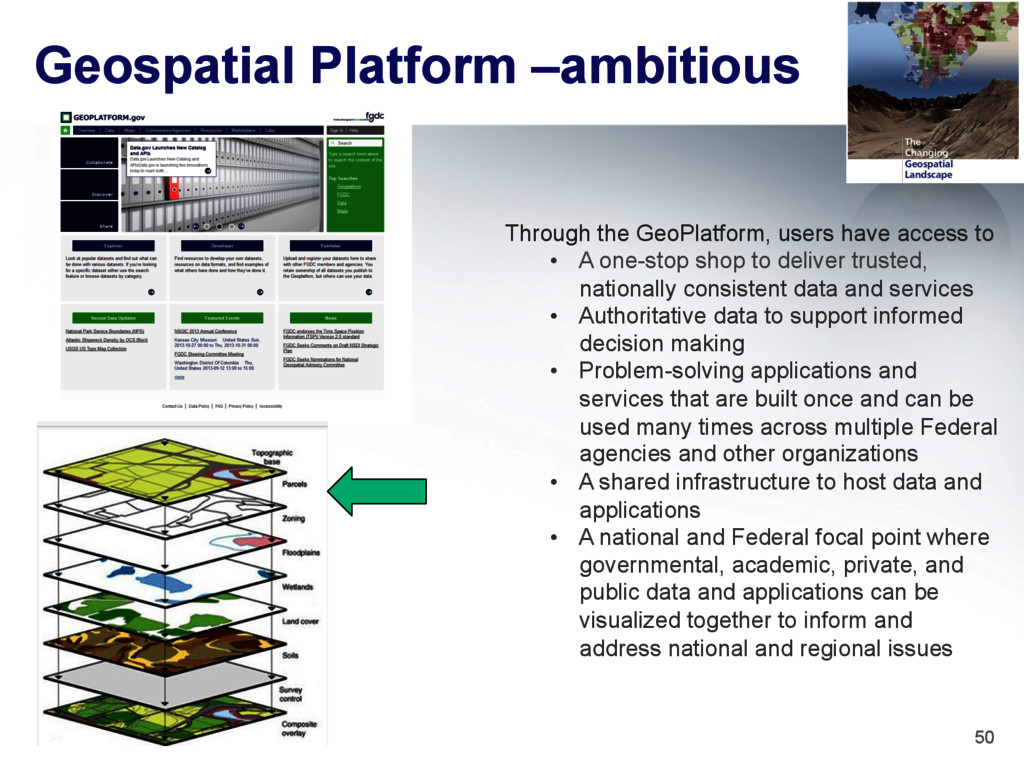
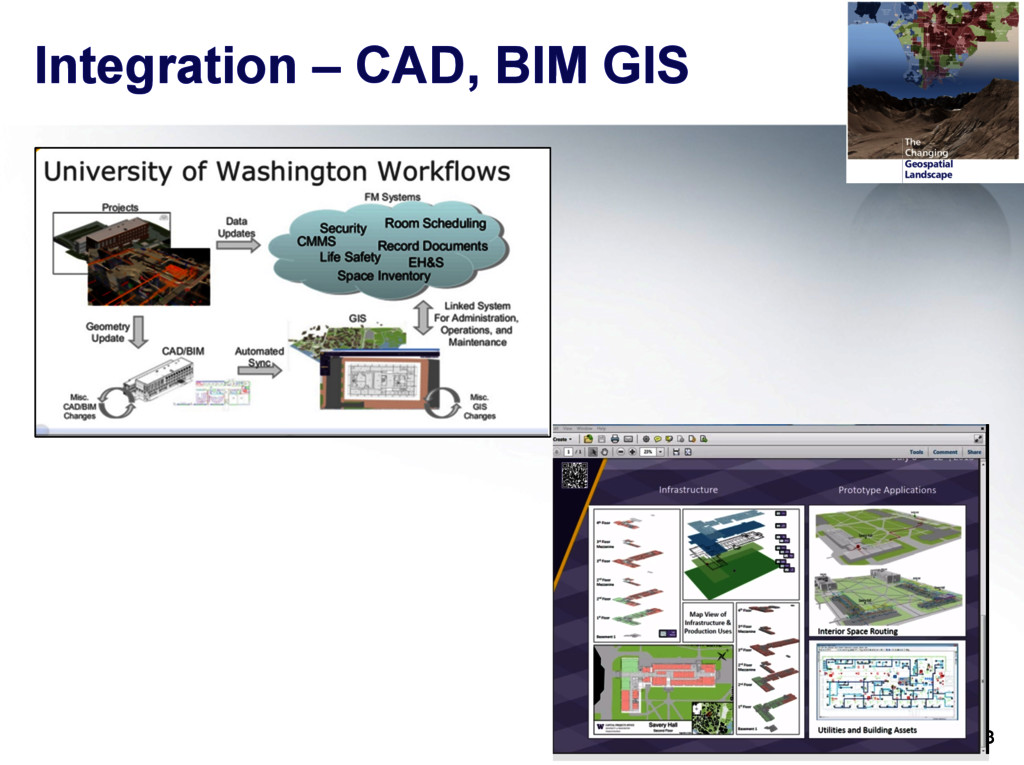
to • A one-stop shop to deliver trusted, nationally consistent data and services • Authoritative data to support informed decision making • Problem-solving applications and services that are built once and can be used many times across multiple Federal agencies and other organizations • A shared infrastructure to host data and applications • A national and Federal focal point where governmental, academic, private, and public data and applications can be visualized together to inform and address national and regional issues
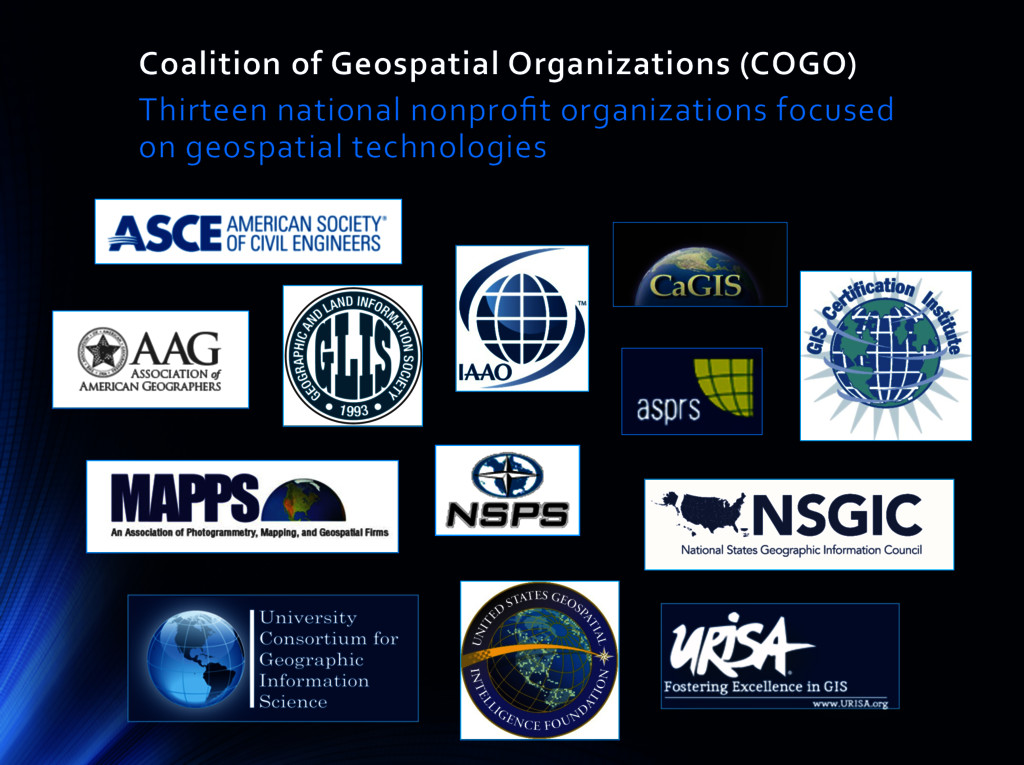
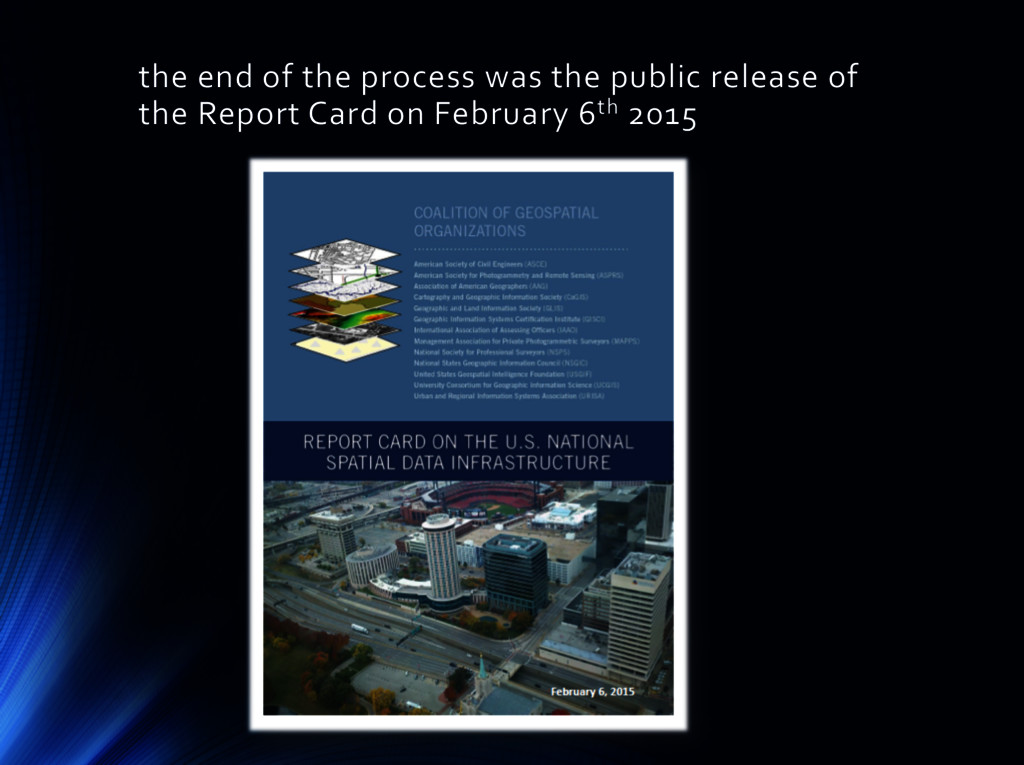
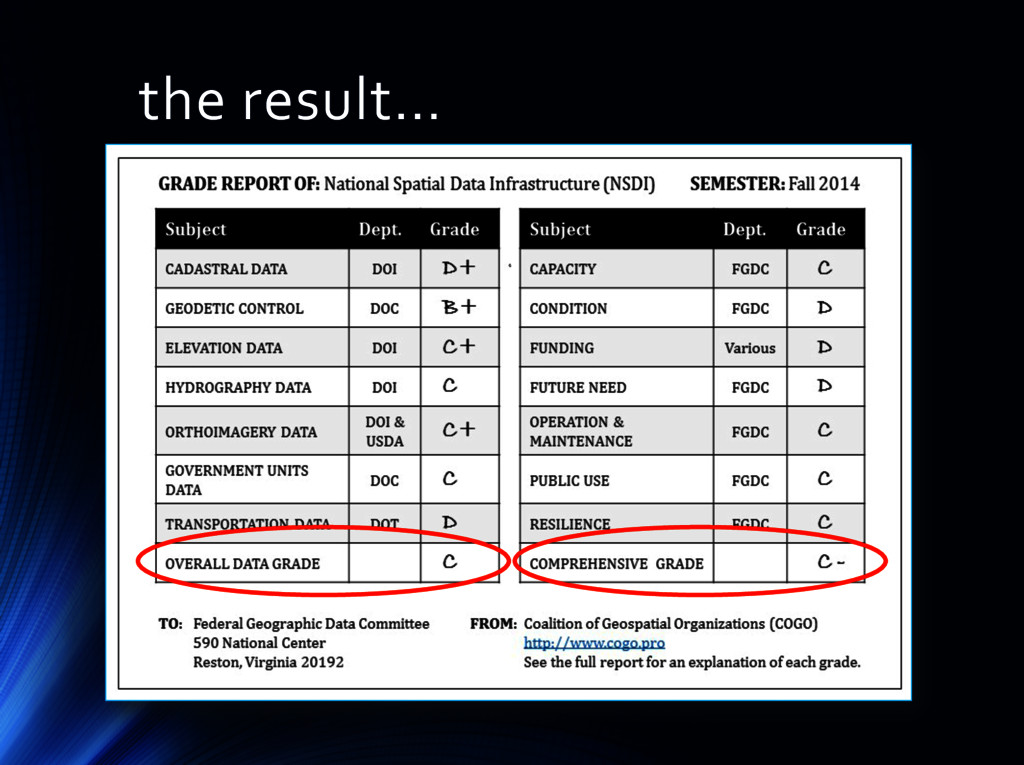
Data Infrastructure (NSDI) Prepared for the Coalition of Geospatial Organizations (COGO) DAVID J. COWEN, VICE CHAIRMAN PROFESSOR EMERITUS, UNIVERSITY OF SOUTH CAROLINA
the selection of the Expert Panel James E. Geringer Chair Dr. David J. Cowen Vice-‐Chair John J. Moeller Vice-‐Chair Susan Carson Lambert Thomas D. Rust Dr. John D. Bossler Robert T. Welch
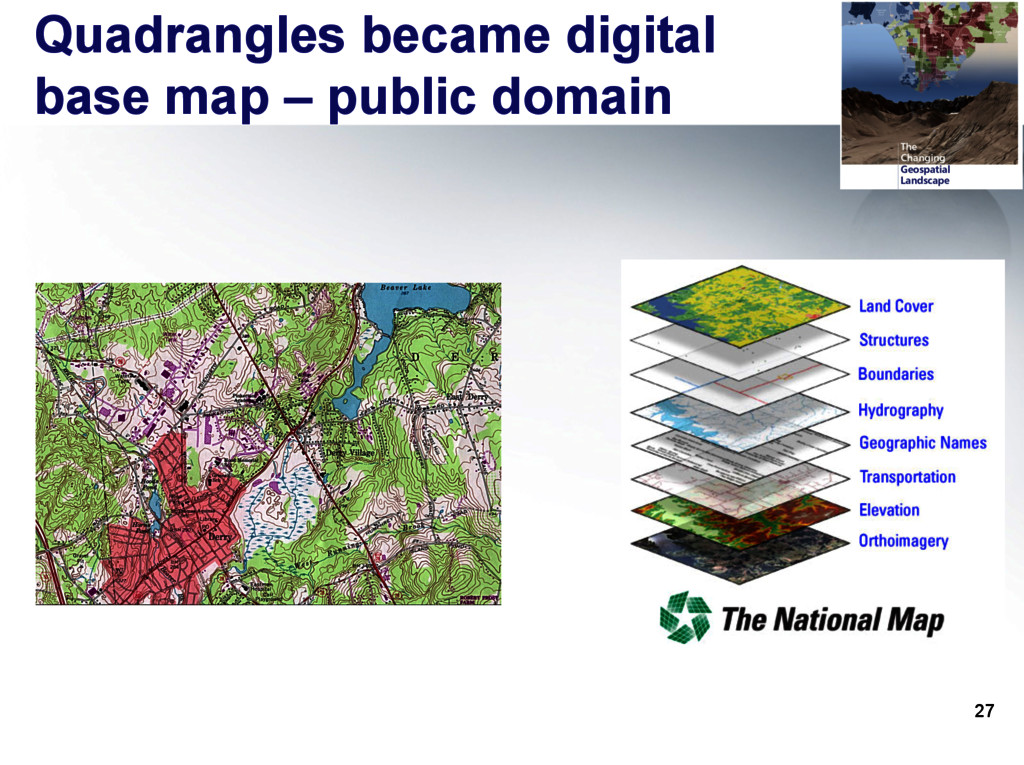
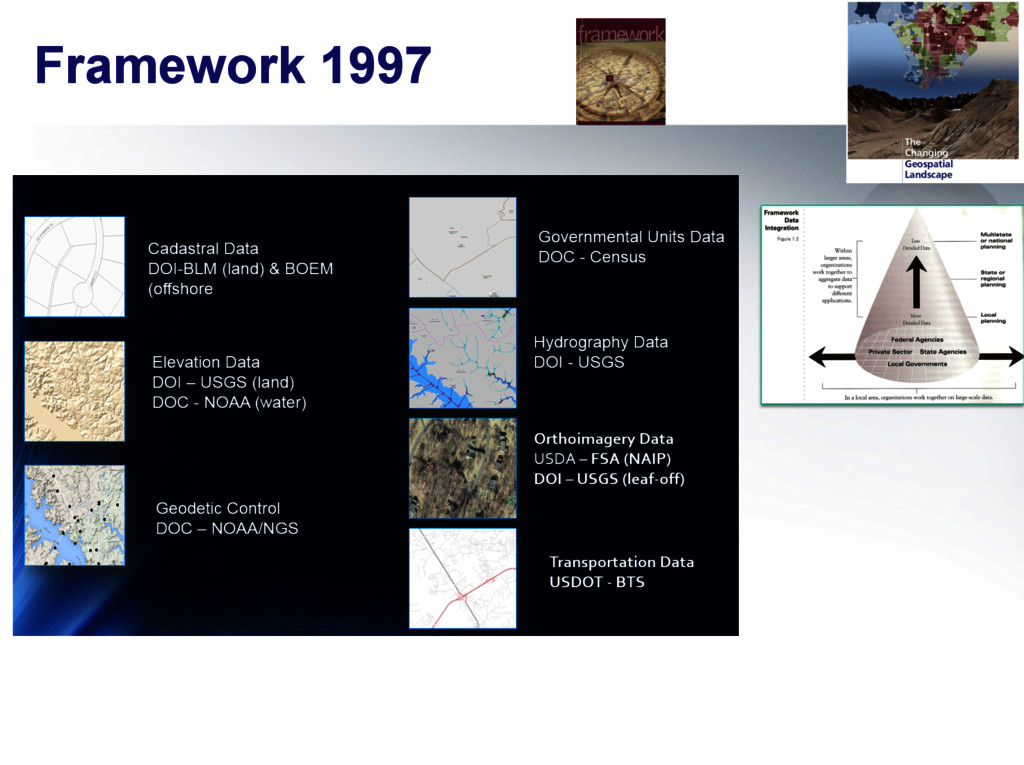
vision and the greatest potential value of the NSDI Framework have not yet been fulfilled. • Definitive sets of nationally consistent, fully integrated, and reliable data do not exist for the entire nation. • Current representations exist as seven separate themes rather than a fully integrated system. • Federal agencies charged with the stewardship of the seven Framework data layers face serious obstacles in terms of authority and funding. • The shift in data production from the federal government to the private sector and state and local government calls for new forms of partnership.
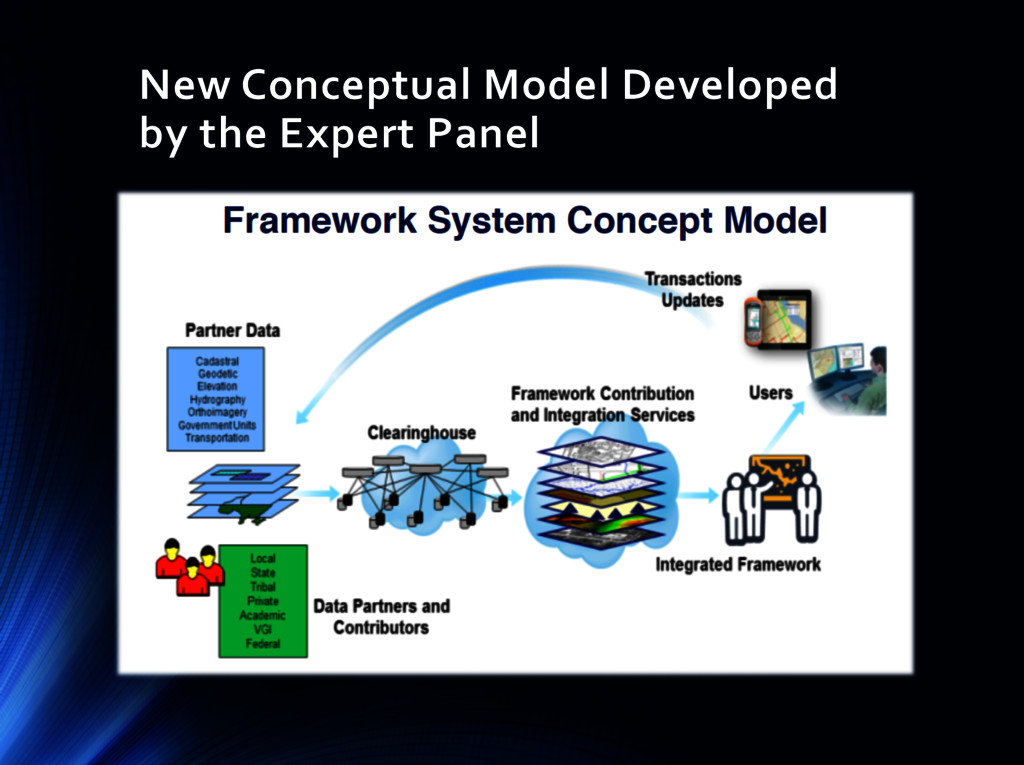
Framework needs to be reaffirmed. • A new model for Framework data needs to be adopted, and this new model must acknowledge the importance of local partners. • This model should be transaction based and emphasize the use of current information technologies, federated, and web-‐based capabilities; and support web-‐based services and applications.
needs to emphasize that the Framework is part of its Strategic Plan, and that it will work in collaboration with non-‐federal and non-‐ governmental partners to build an effective NSDI Framework. • In today’s environment the most accurate and current geospatial data are often collected by local government. A successful NSDI demands that these high resolution data become part of the Infrastructure. • Budgetary and leadership investments must be made to implement a new model.
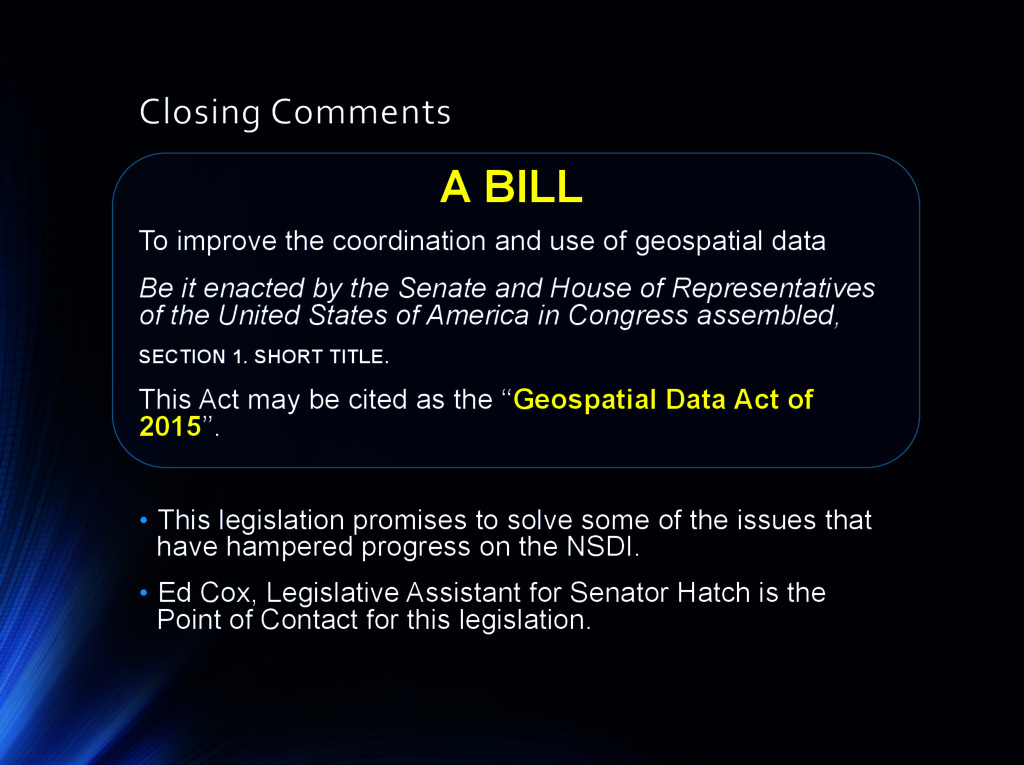
use of geospatial data Be it enacted by the Senate and House of Representatives of the United States of America in Congress assembled, SECTION 1. SHORT TITLE. This Act may be cited as the ‘‘Geospatial Data Act of 2015’’. • This legislation promises to solve some of the issues that have hampered progress on the NSDI. • Ed Cox, Legislative Assistant for Senator Hatch is the Point of Contact for this legislation.
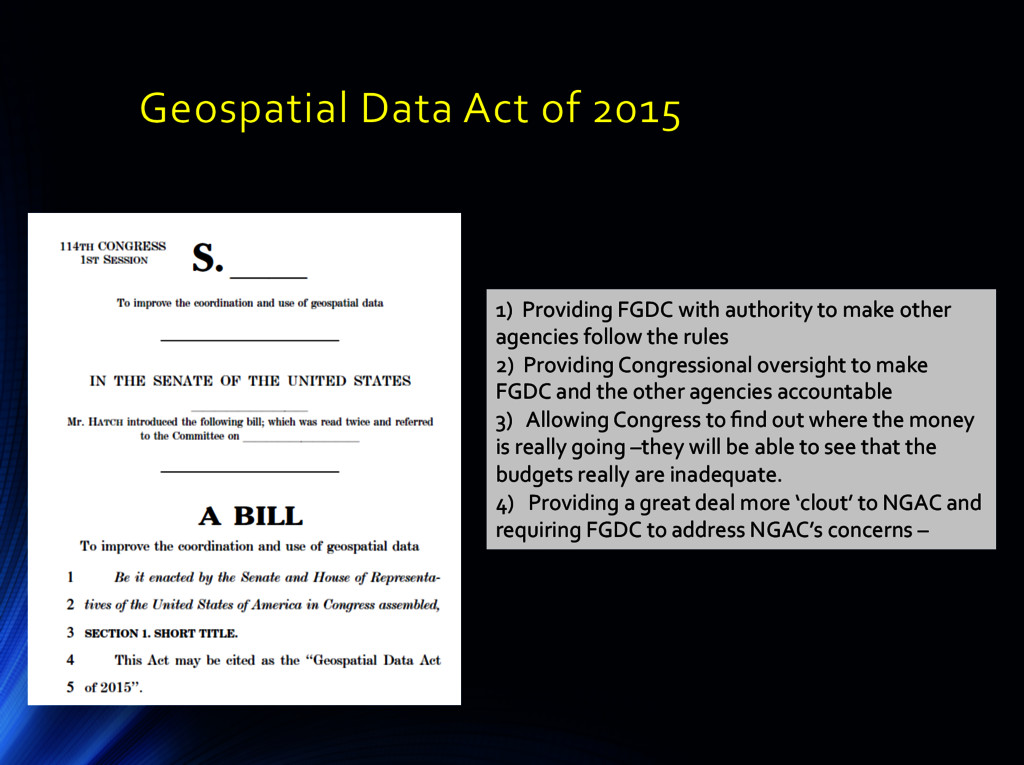
FGDC with authority to make other agencies follow the rules 2) Providing Congressional oversight to make FGDC and the other agencies accountable 3) Allowing Congress to find out where the money is really going –they will be able to see that the budgets really are inadequate. 4) Providing a great deal more ‘clout’ to NGAC and requiring FGDC to address NGAC’s concerns –
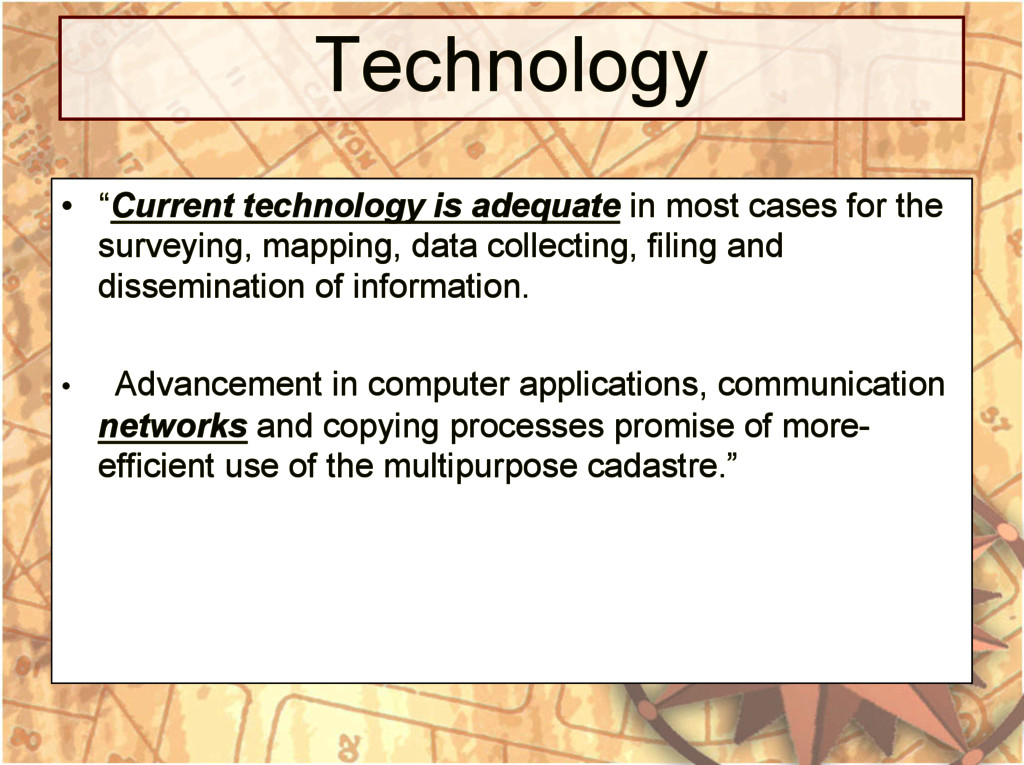
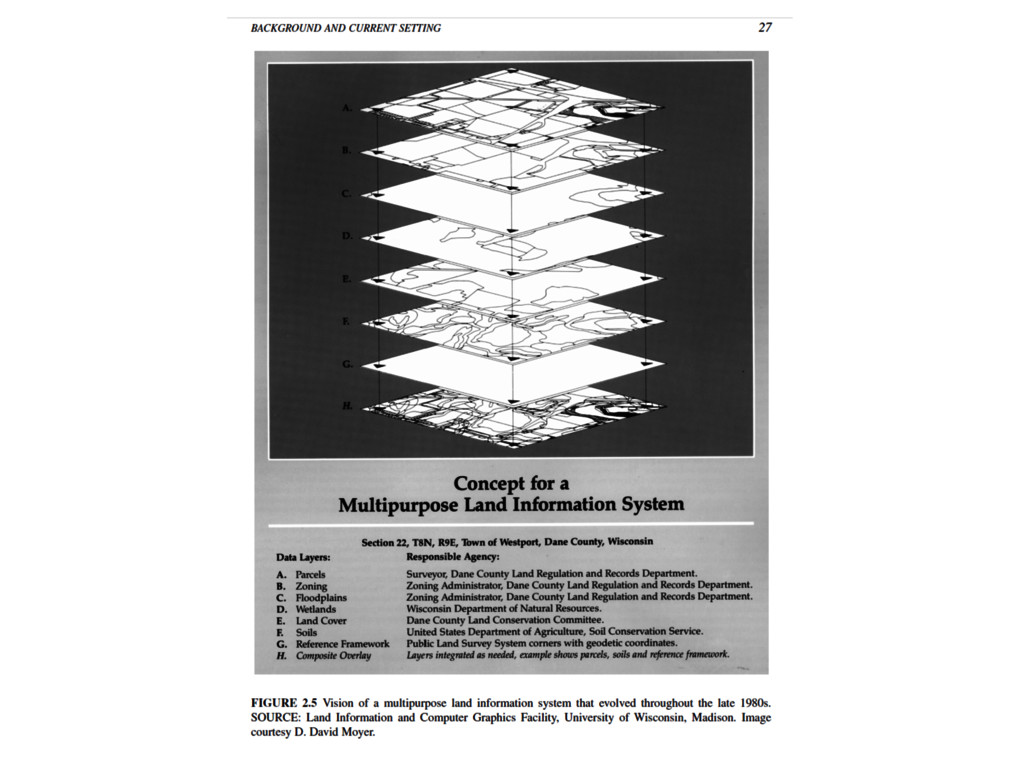
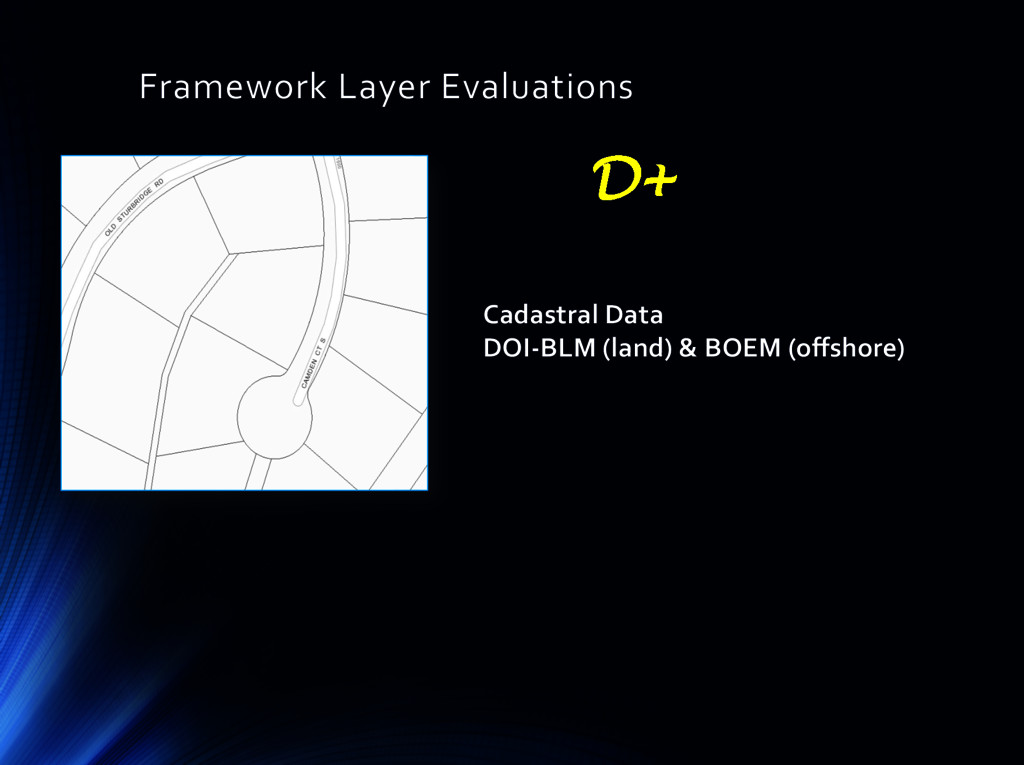
the surveying, mapping, data collecting, filing and dissemination of information. • Advancement in computer applications, communication networks and copying processes promise of more- efficient use of the multipurpose cadastre.”
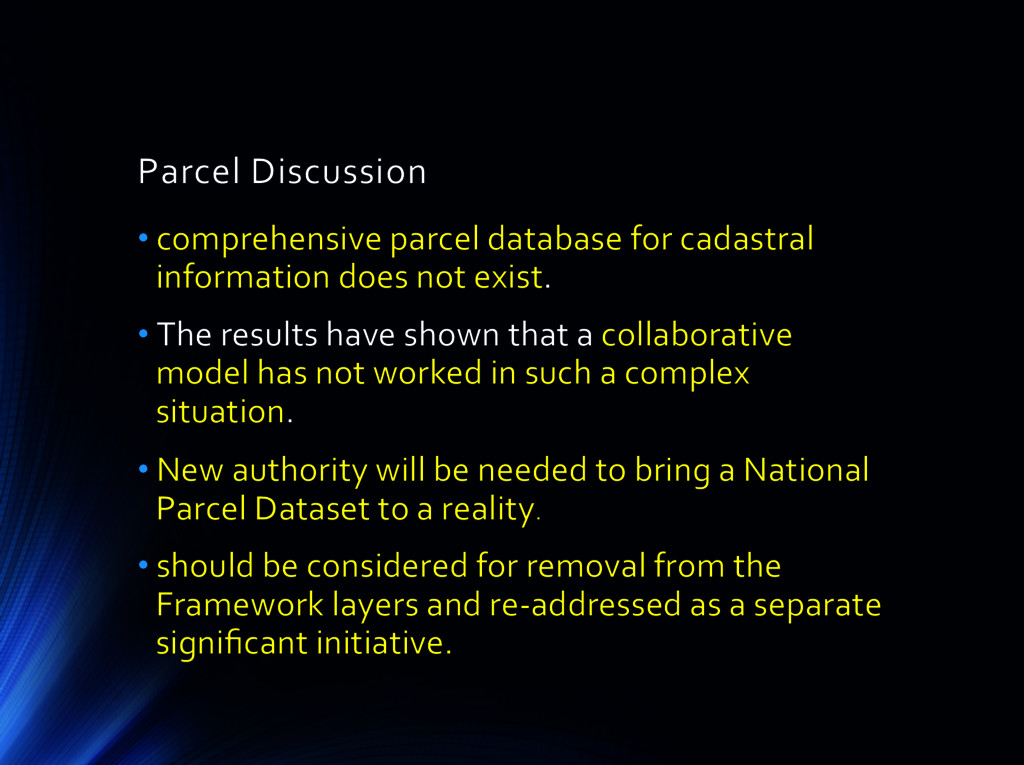
information does not exist. • The results have shown that a collaborative model has not worked in such a complex situation. • New authority will be needed to bring a National Parcel Dataset to a reality. • should be considered for removal from the Framework layers and re-‐addressed as a separate significant initiative.
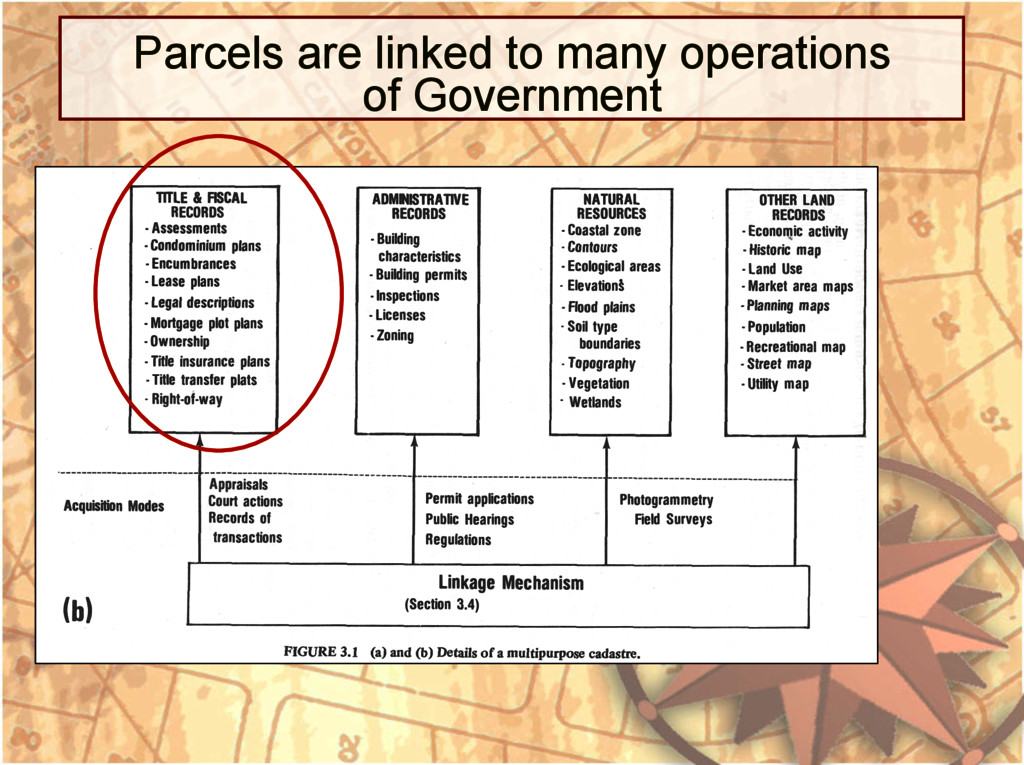
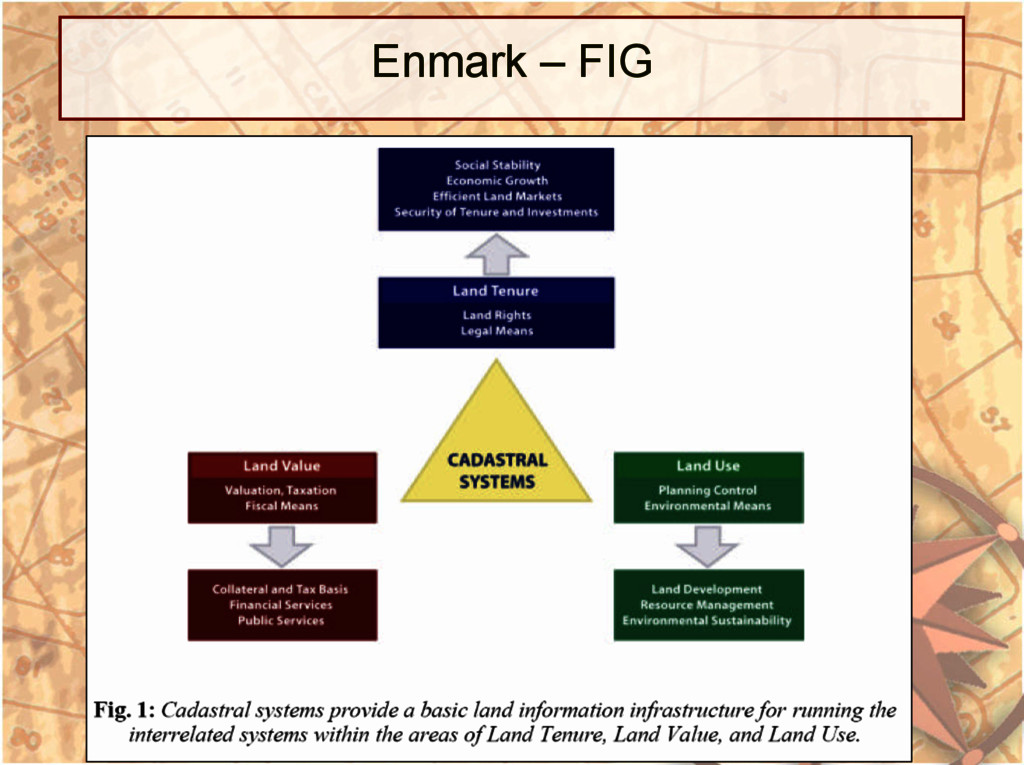
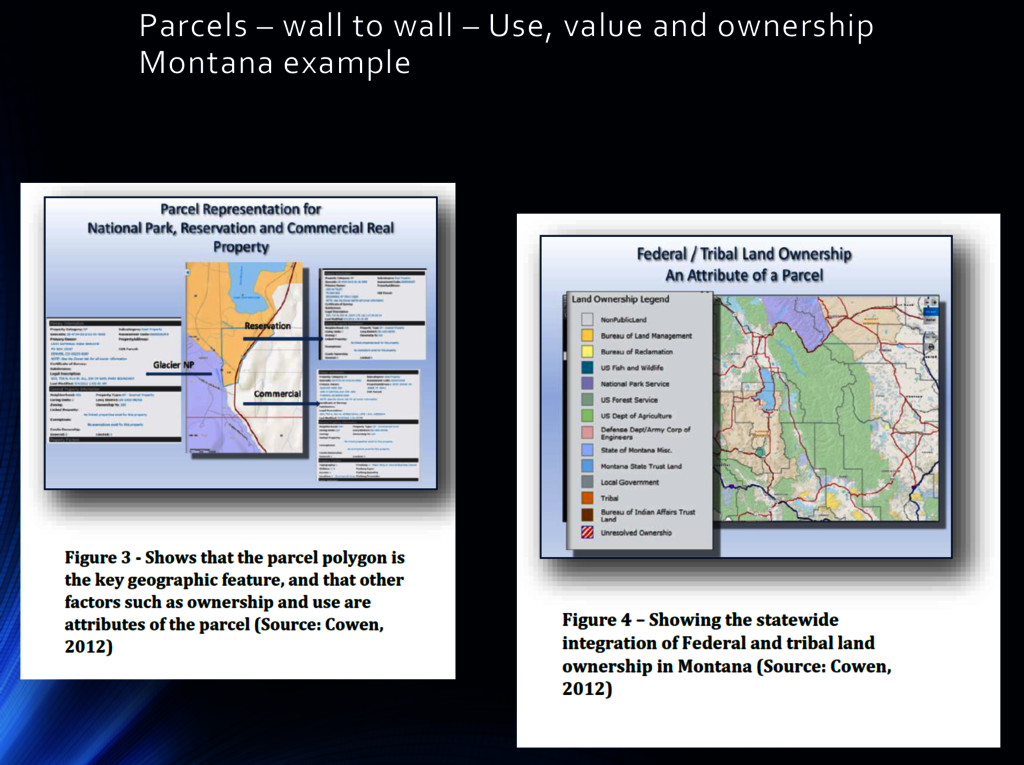
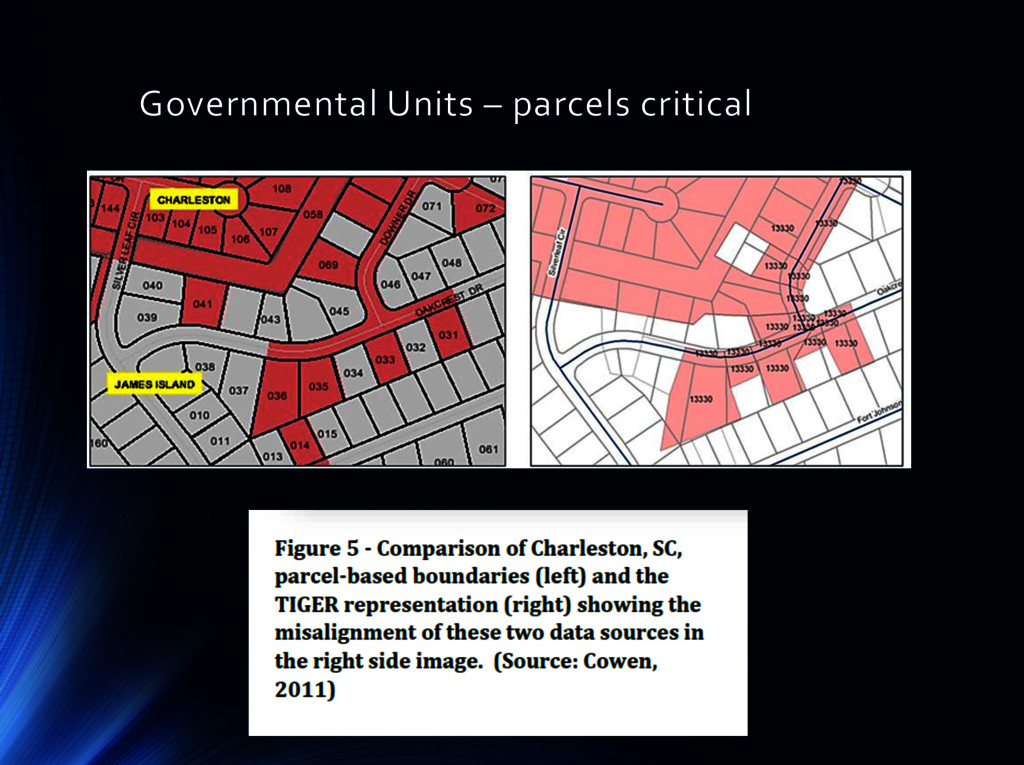
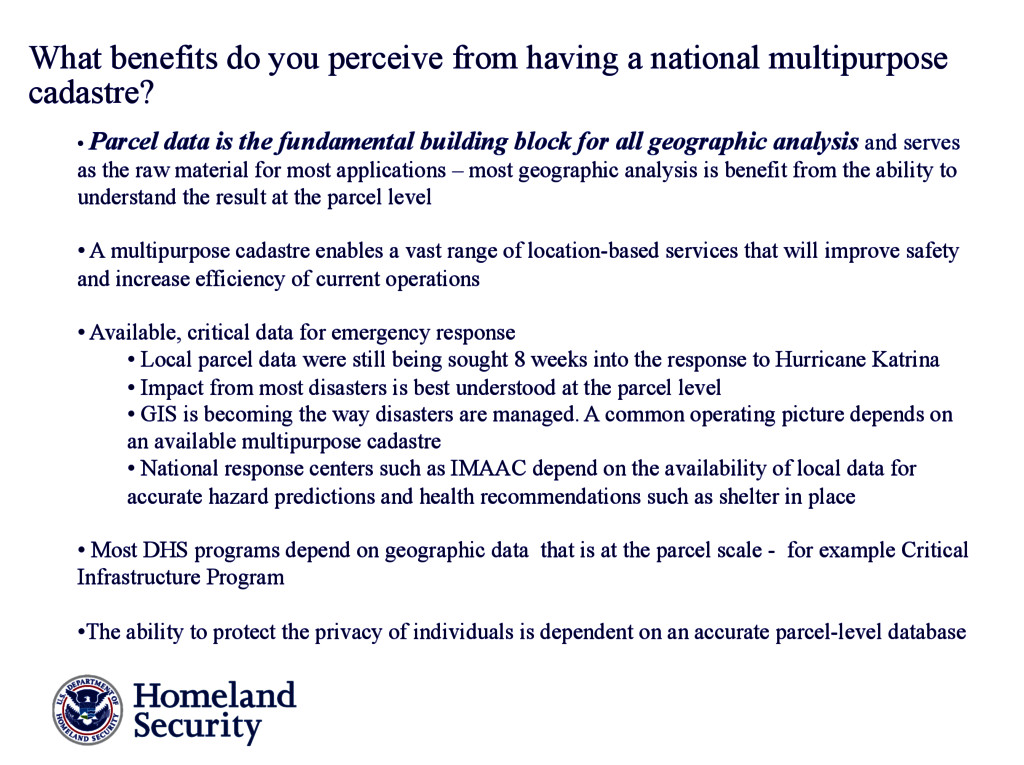
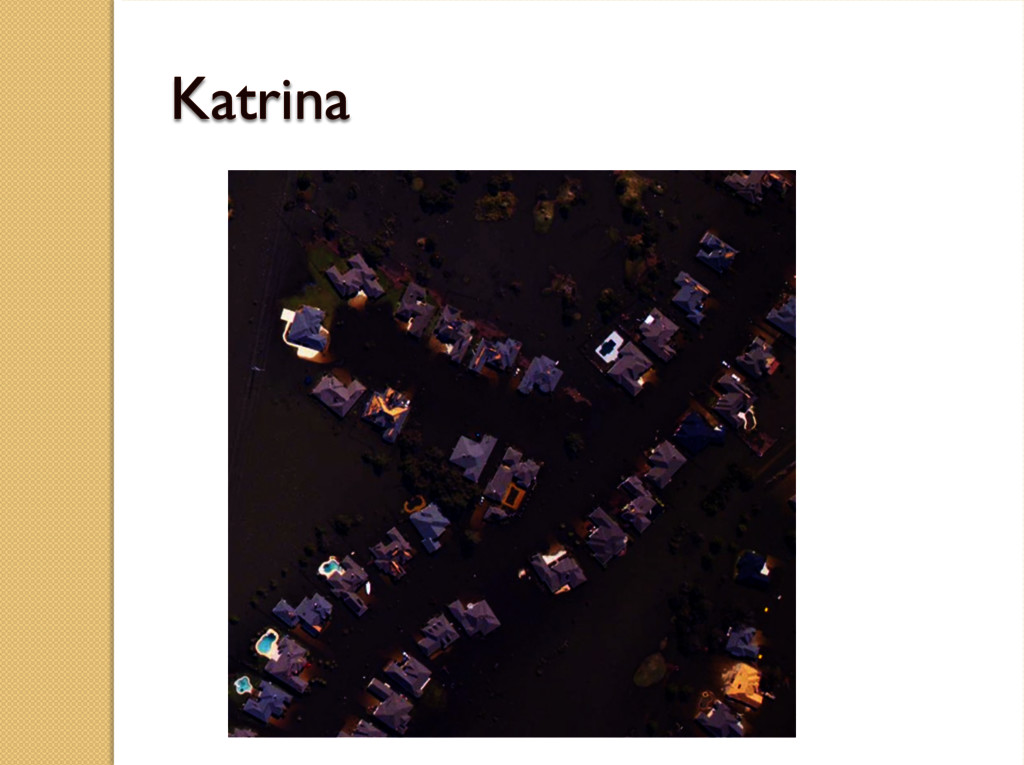
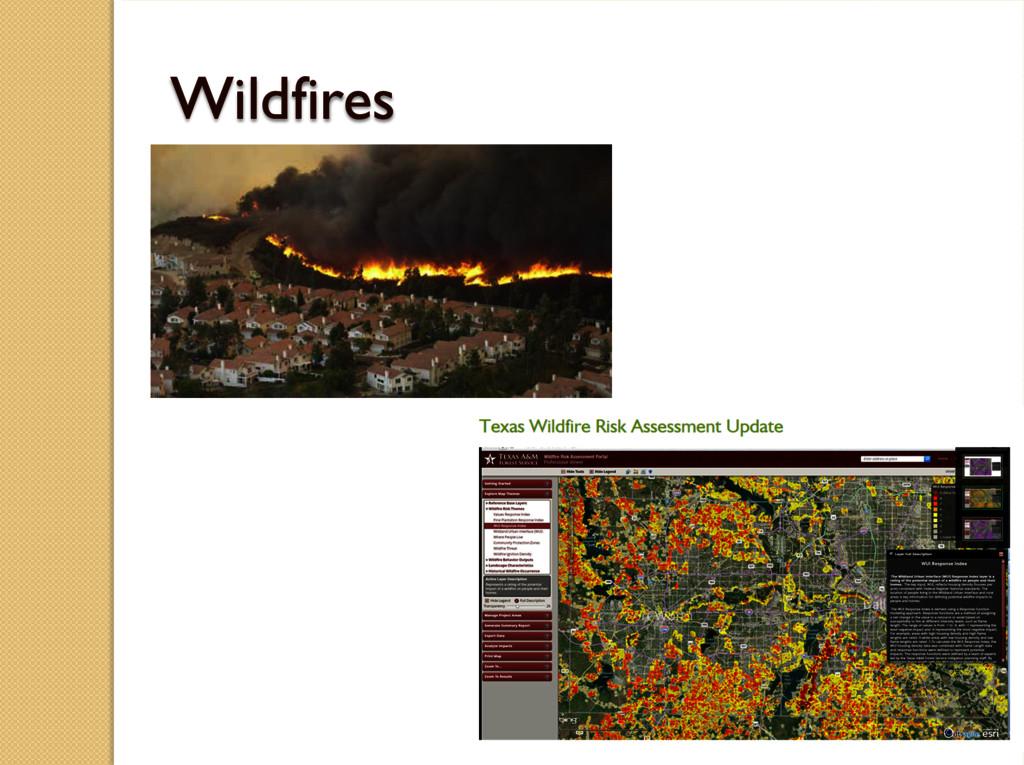
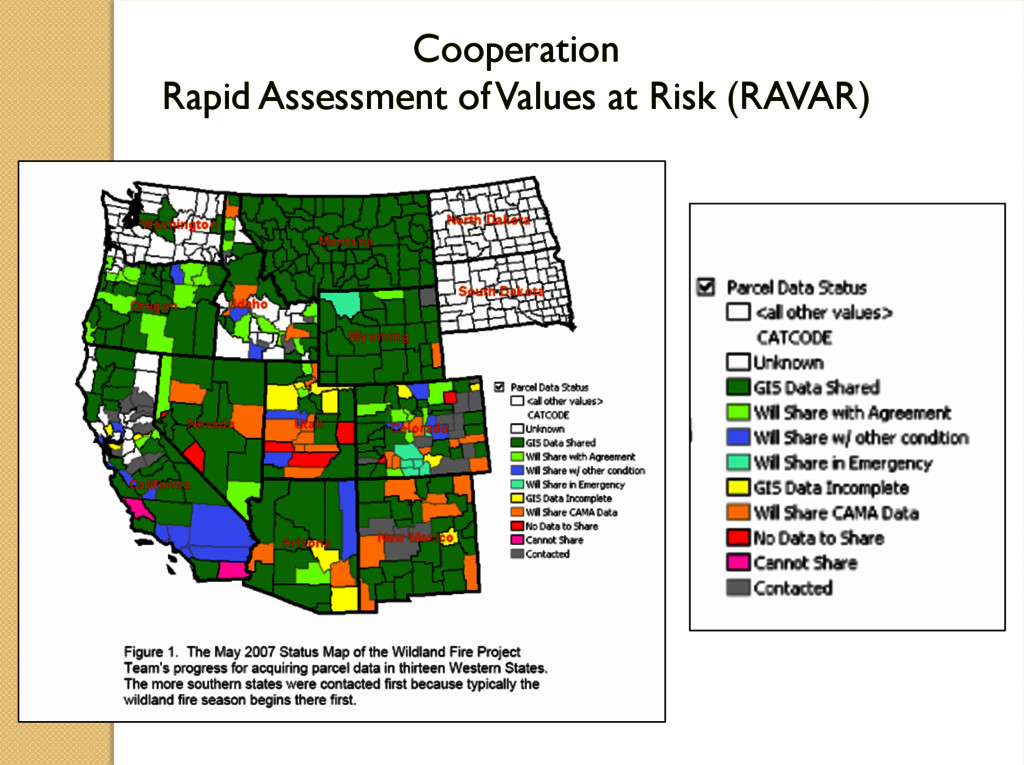
perceive from having a national multipurpose cadastre? • Parcel data is the fundamental building block for all geographic analysis and serves as the raw material for most applications – most geographic analysis is benefit from the ability to understand the result at the parcel level • A multipurpose cadastre enables a vast range of location-based services that will improve safety and increase efficiency of current operations • Available, critical data for emergency response • Local parcel data were still being sought 8 weeks into the response to Hurricane Katrina • Impact from most disasters is best understood at the parcel level • GIS is becoming the way disasters are managed. A common operating picture depends on an available multipurpose cadastre • National response centers such as IMAAC depend on the availability of local data for accurate hazard predictions and health recommendations such as shelter in place • Most DHS programs depend on geographic data that is at the parcel scale - for example Critical Infrastructure Program • The ability to protect the privacy of individuals is dependent on an accurate parcel-level database
World) for Not Having a Public Property Rights Infrastructure? Daniel ROBERGE, Canada and Bengt KJELLSON, Sweden “… we believe that a good property rights infrastructure could have mitigated the effect of the land market crisis and thereby avoided the loss of many hundreds or even thousands of billion dollars.” FIG Working Week 2009 Surveyors Key Role in Accelerated Development Eilat, Israel, 3-8 May 2009
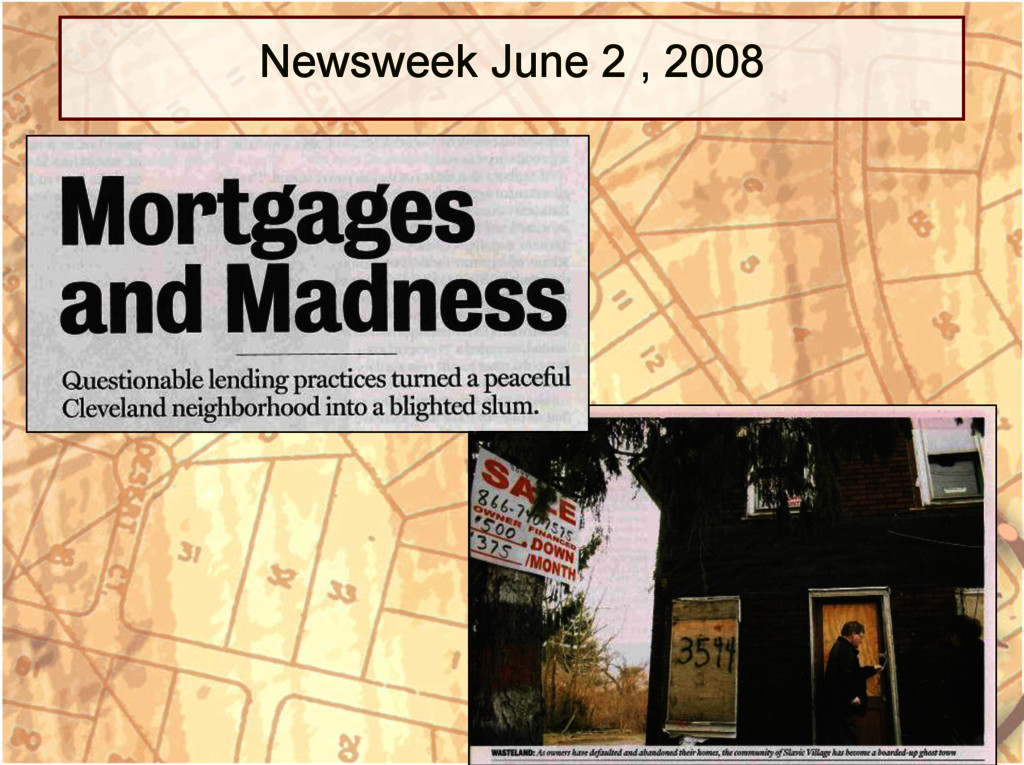
The National Task Force on Predatory Lending Chaired by Secretary Cuomo and Secretary Summers “Curbing Predatory Home Mortgage Lending” FHA will customize data from its Neighborhood Watch system to develop early warning indicators of emerging foreclosure "Hot Zones." … help local officials better assess real estate trends and spot possible patterns of appraisal abuse. This public information will include performance data on individual appraisers generated by the Credit Watch for Appraisers system and posted on the HUD website. • http://www.huduser.org/publications/hsgfin/curbing.html
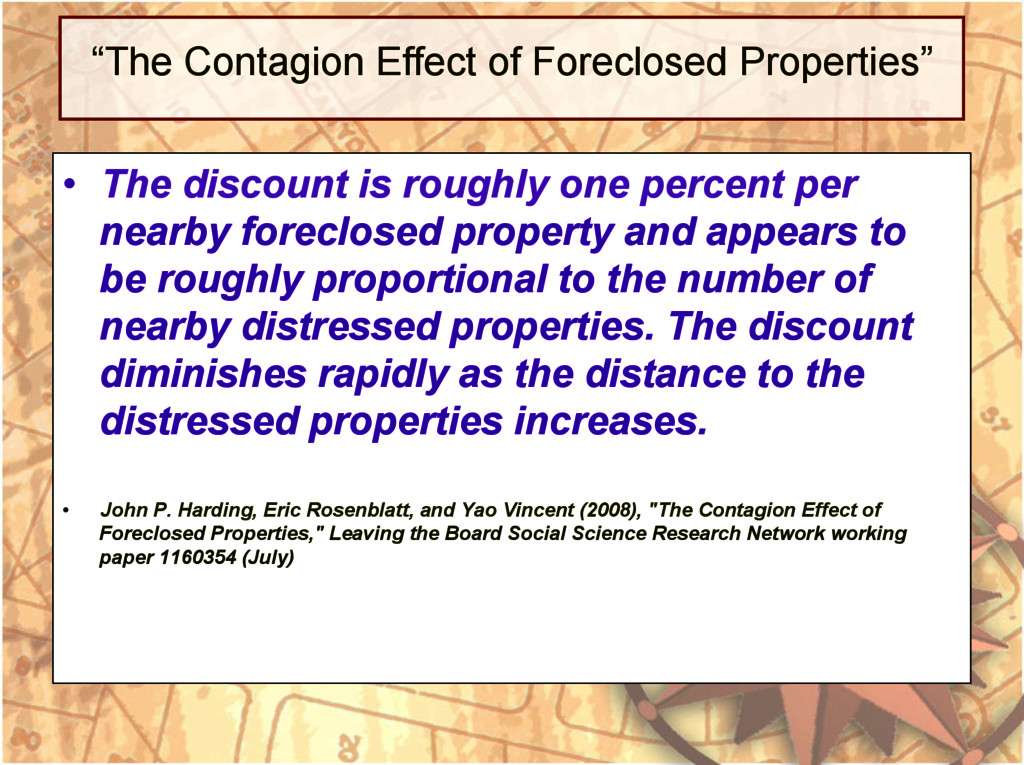
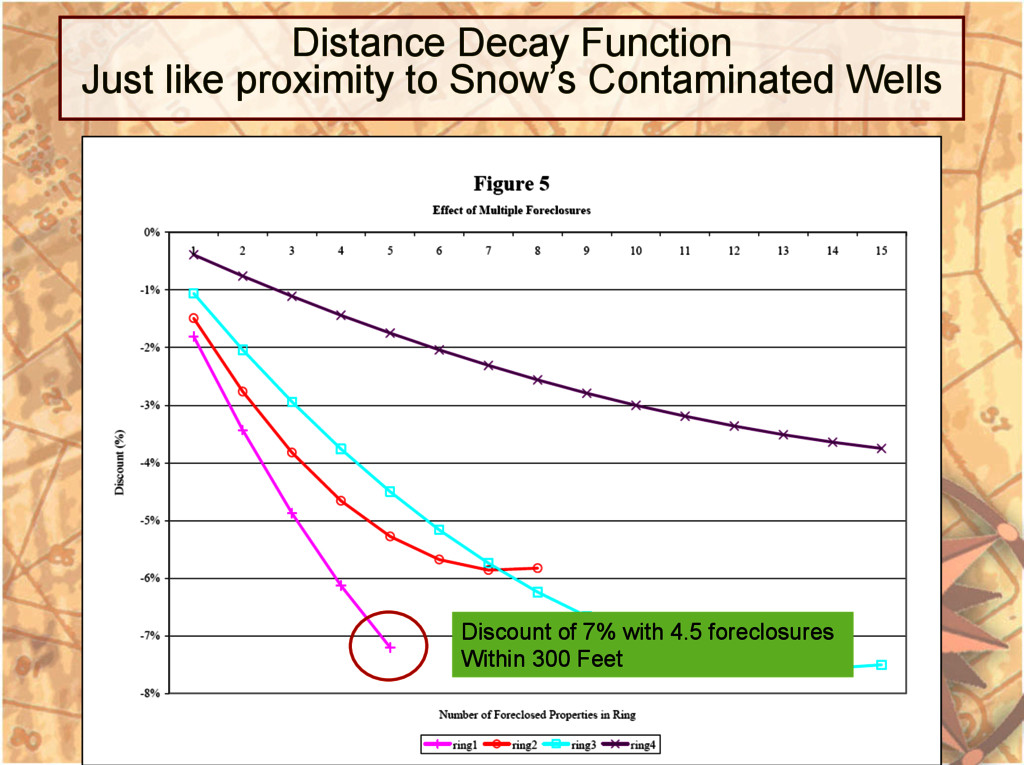
social costs. Communities suffer when foreclosures are clustered, adding further to the downward pressure on property values. Lower property values in turn translate to lower tax revenues for local governments, and increases in the number of vacant homes can foster vandalism and crime.” * Source: Federal Reserve System Conference on Housing and Mortgage Markets, Washington, D.C. *Reference :John P. Harding, Eric Rosenblatt, and Yao Vincent (2008), "The Contagion Effect of Foreclosed Properties," Leaving the Board Social Science Research Network working paper 1160354 (July).
roughly one percent per nearby foreclosed property and appears to be roughly proportional to the number of nearby distressed properties. The discount diminishes rapidly as the distance to the distressed properties increases. • John P. Harding, Eric Rosenblatt, and Yao Vincent (2008), "The Contagion Effect of Foreclosed Properties," Leaving the Board Social Science Research Network working paper 1160354 (July)
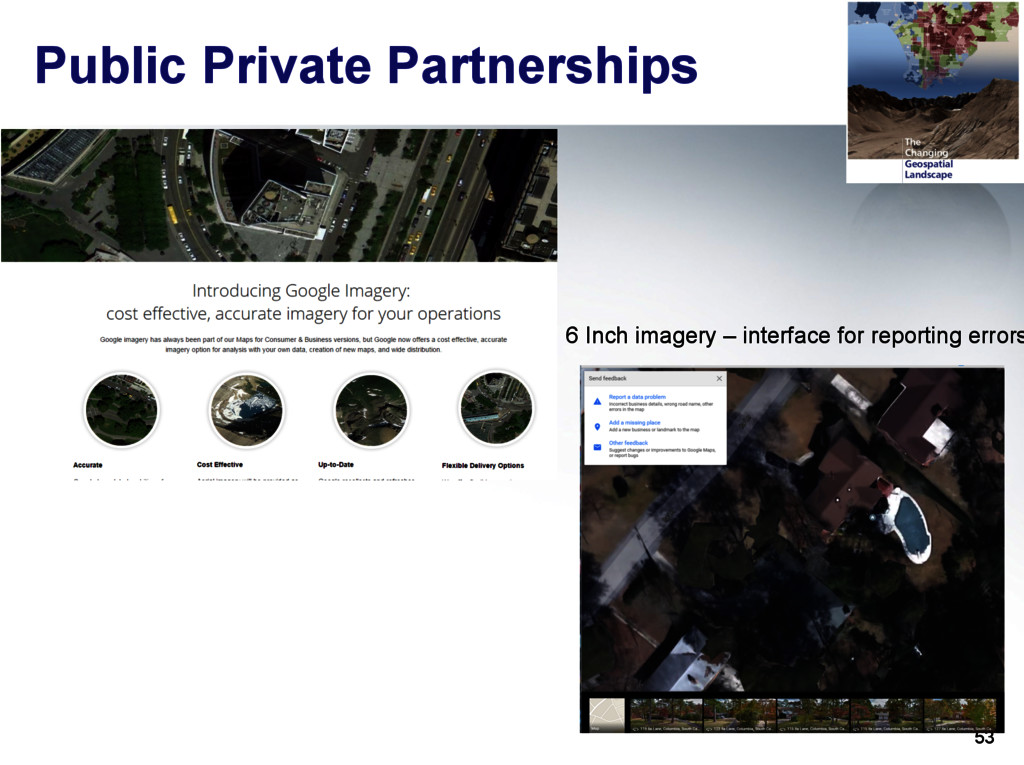
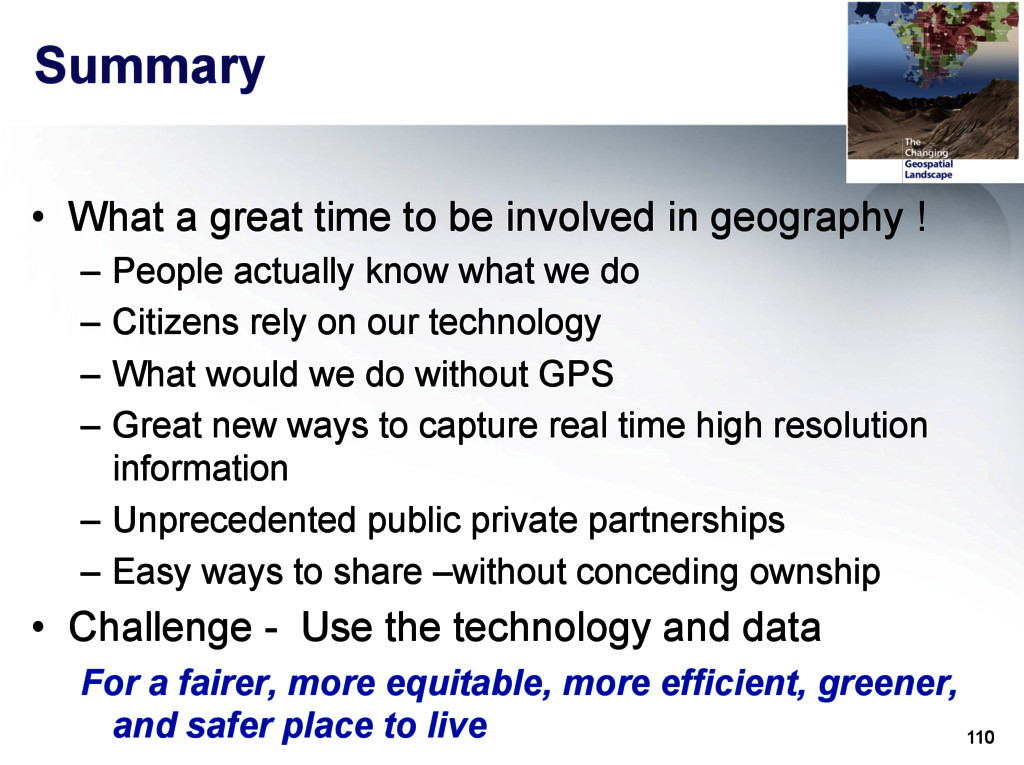
in geography ! – People actually know what we do – Citizens rely on our technology – What would we do without GPS – Great new ways to capture real time high resolution information – Unprecedented public private partnerships – Easy ways to share –without conceding ownship • Challenge - Use the technology and data For a fairer, more equitable, more efficient, greener, and safer place to live