III. Tuberculosis Background IV. Access to Care Background V. Statistical Analysis Background VI. Project Maps VII. Poisson Regression Findings VIII. Conclusion
Health Promotion & Behavioral Science, The University of Texas Health Science Center at Houston • In Progress DRPH Epidemiology & Environmental Health, Texas A&M Health Science Center School of Public Health
better able to understand: • Populations at risk • Health Outcomes • Risk Factors • Associations between Risk Factors and Health Outcomes • Health Interventions
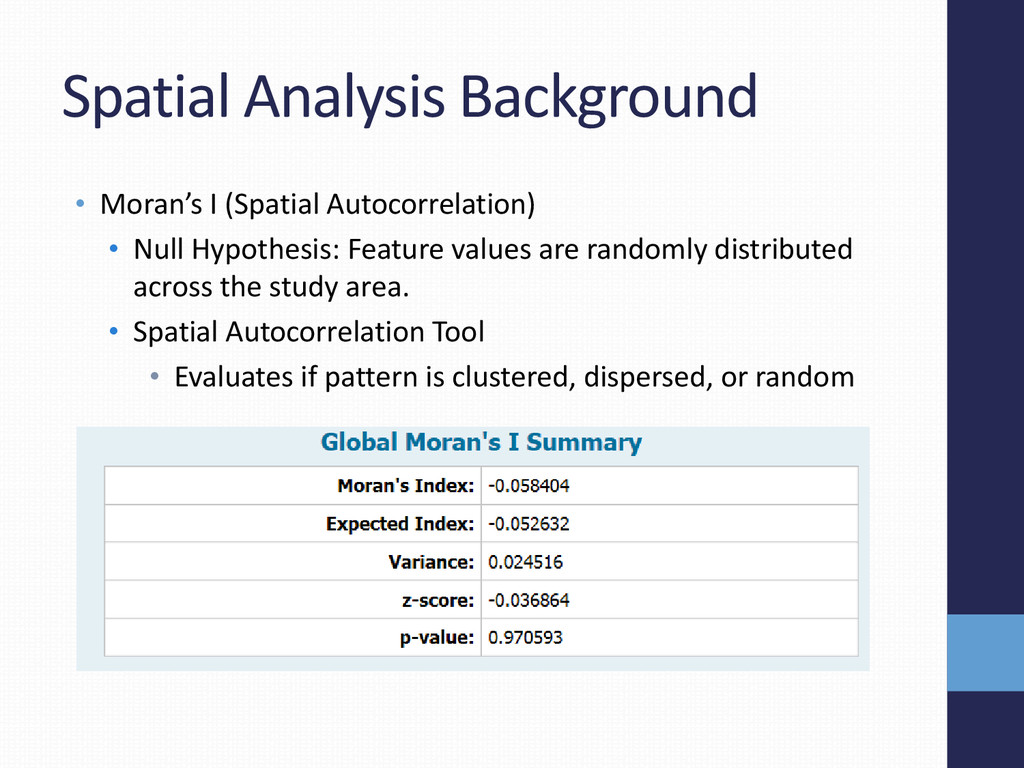
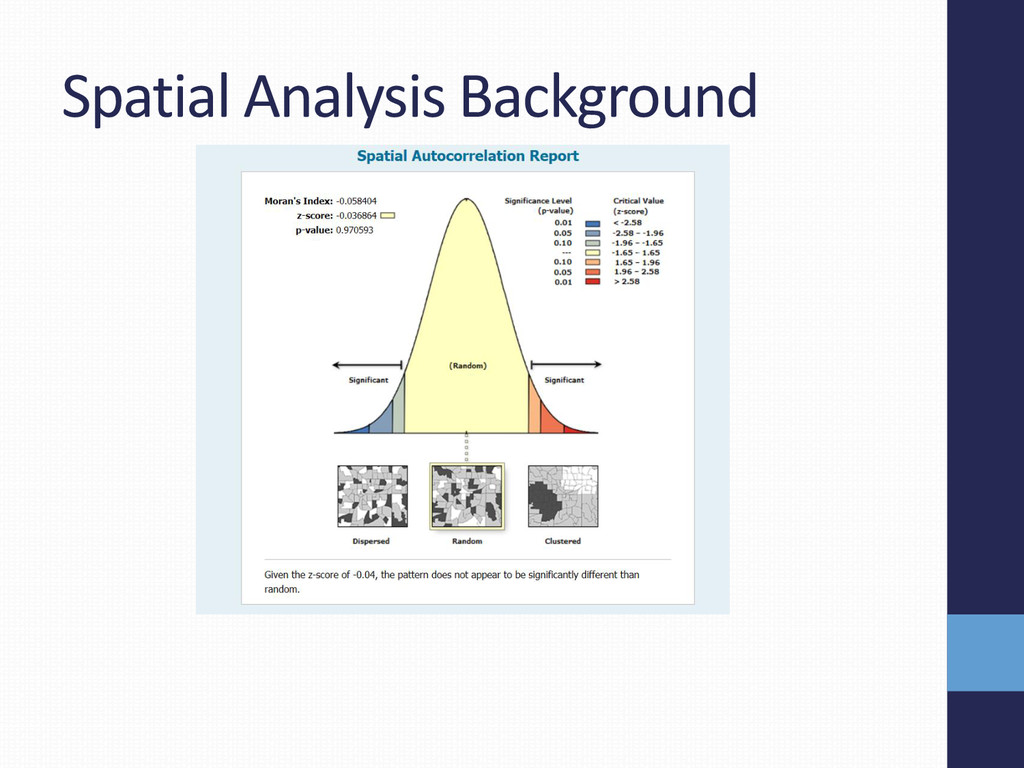
Hypothesis: Feature values are randomly distributed across the study area. • Spatial Autocorrelation Tool • Evaluates if pattern is clustered, dispersed, or random
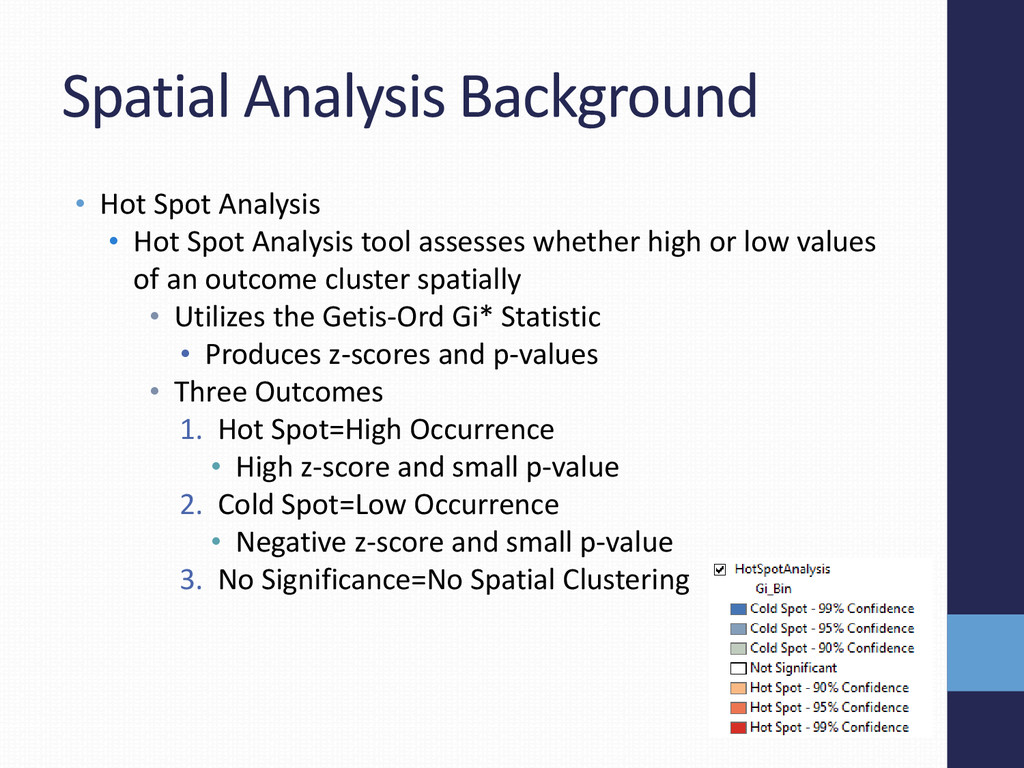
Analysis tool assesses whether high or low values of an outcome cluster spatially • Utilizes the Getis-Ord Gi* Statistic • Produces z-scores and p-values • Three Outcomes 1. Hot Spot=High Occurrence • High z-score and small p-value 2. Cold Spot=Low Occurrence • Negative z-score and small p-value 3. No Significance=No Spatial Clustering
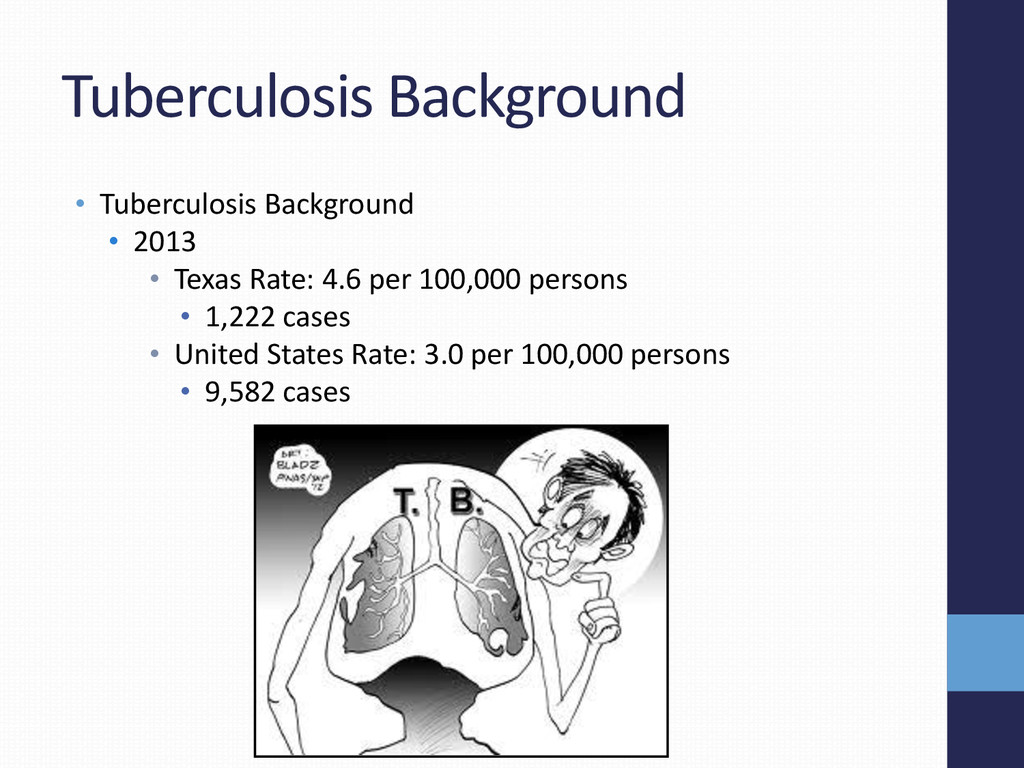
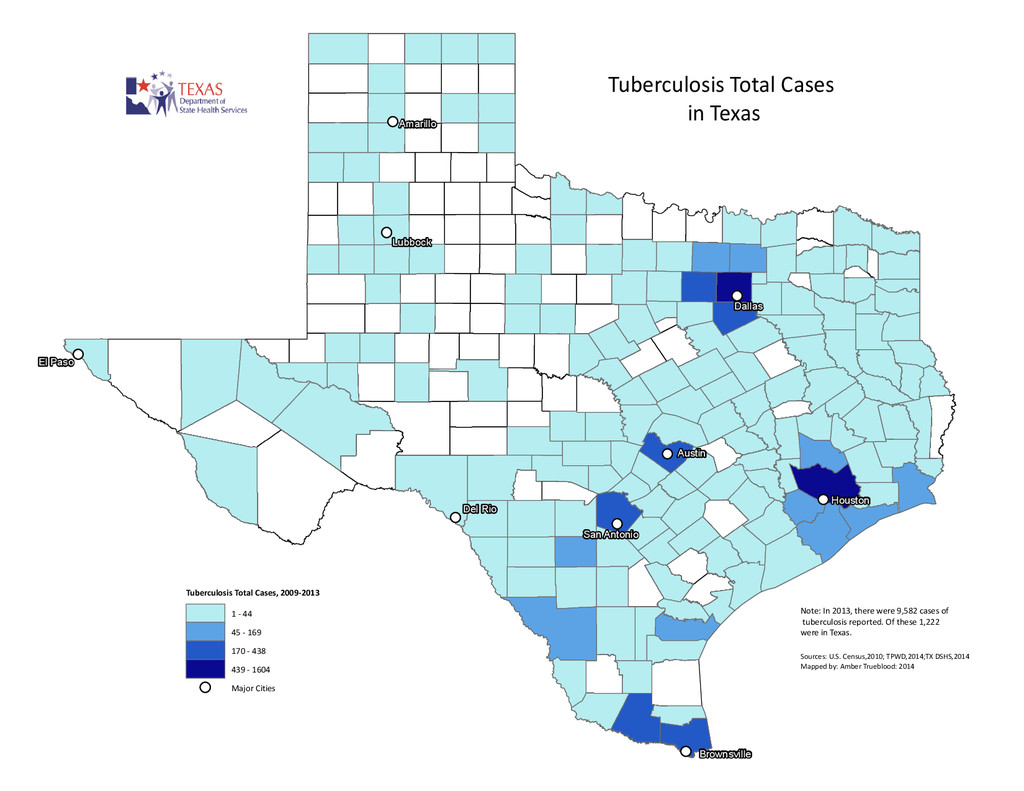
San Antonio Tuberculosis Total Cases in Texas Sources: U.S. Census,2010; TPWD,2014;TX DSHS,2014 Mapped by: Amber Trueblood: 2014 Note: In 2013, there were 9,582 cases of tuberculosis reported. Of these 1,222 were in Texas. Tuberculosis Total Cases, 2009-2013 1 - 44 45 - 169 170 - 438 439 - 1604 Major Cities
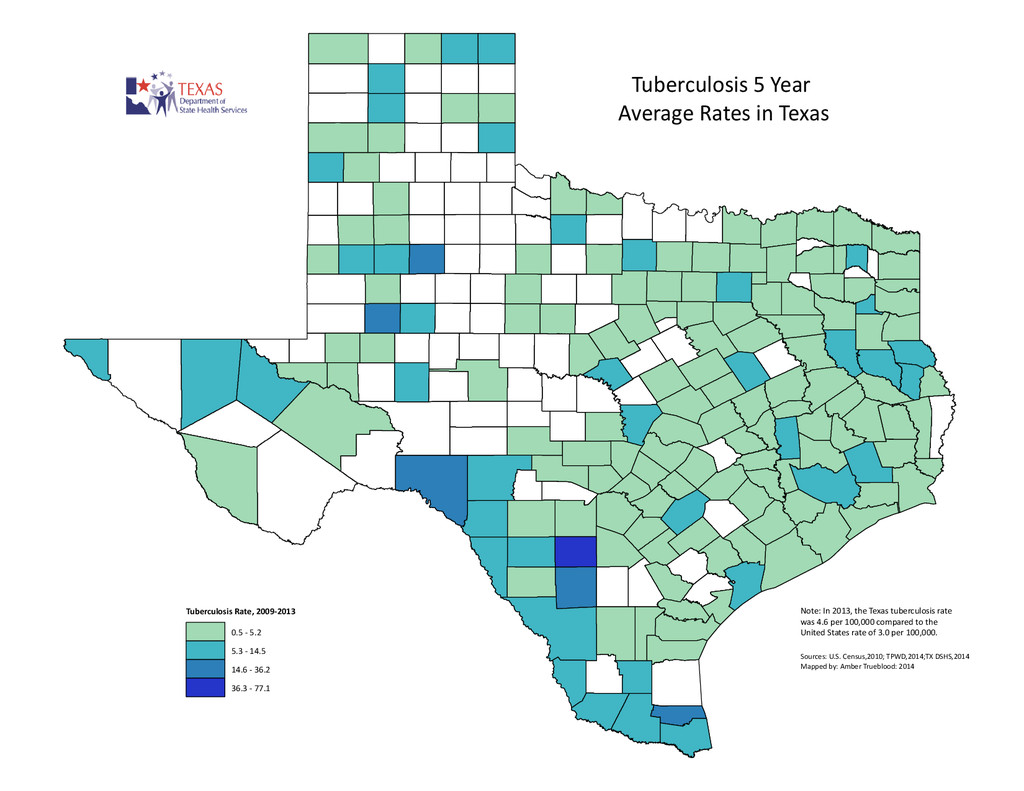
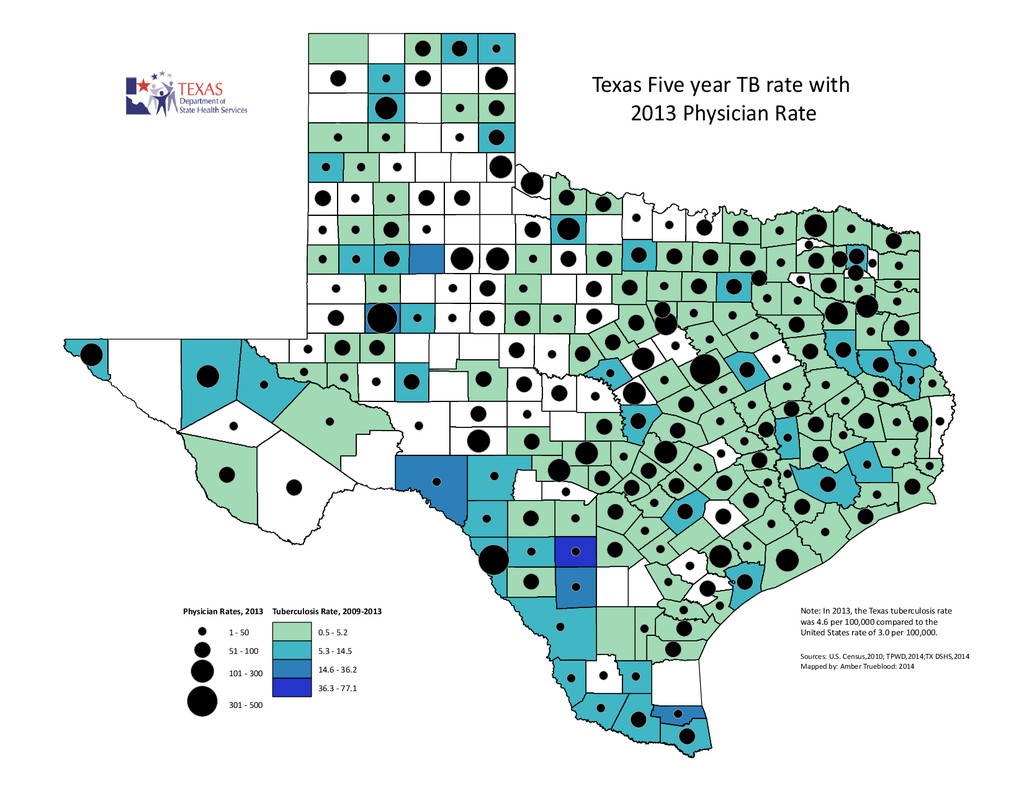
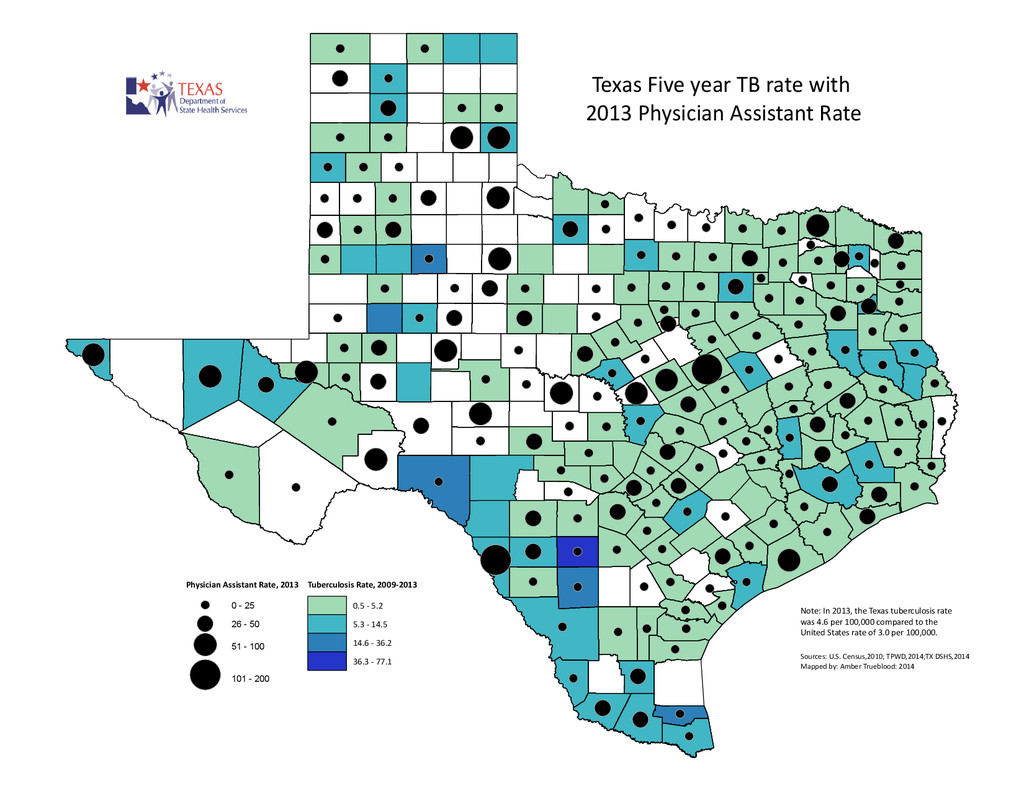
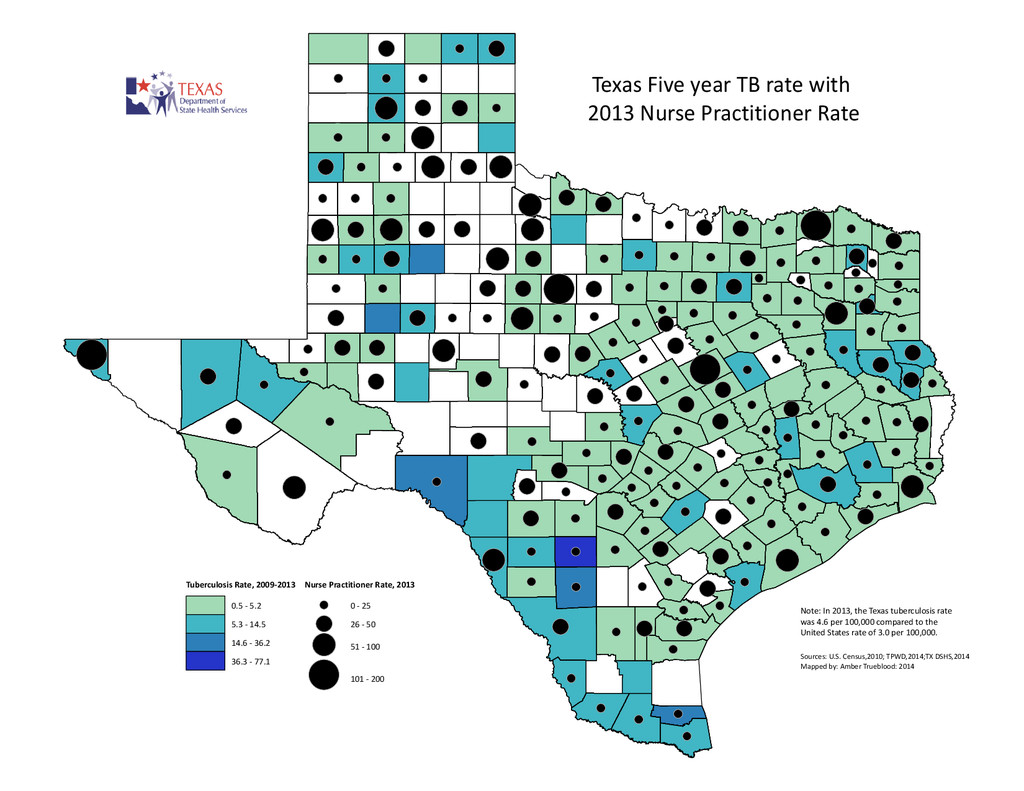
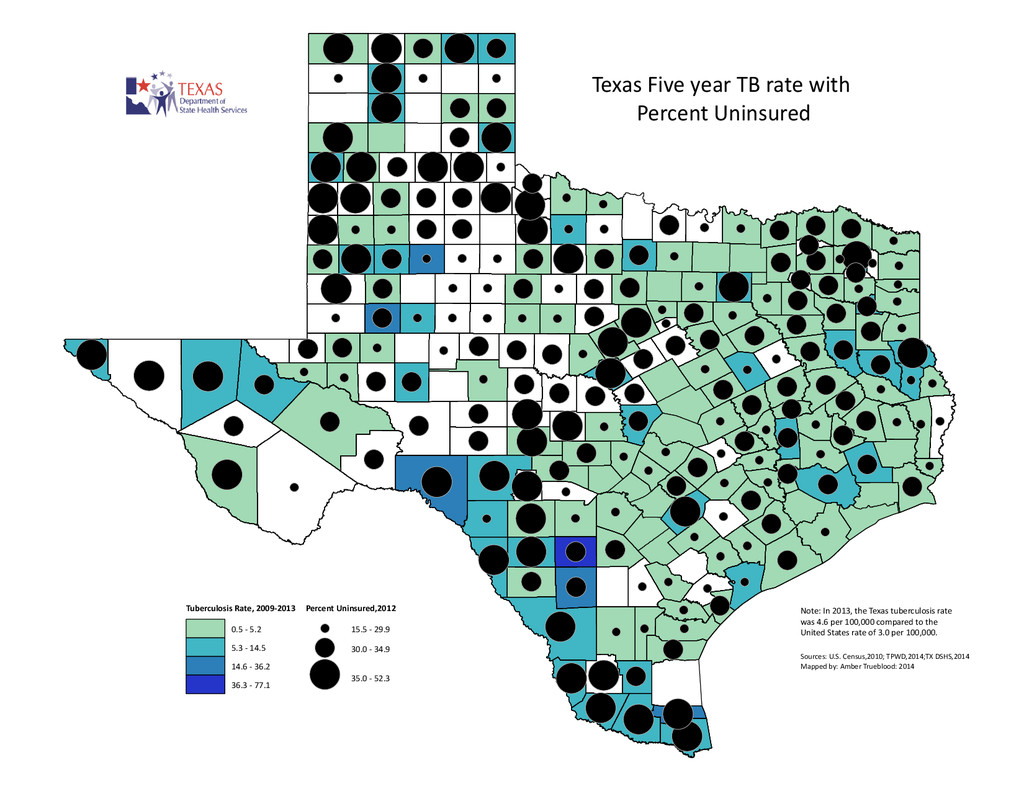
TPWD,2014;TX DSHS,2014 Mapped by: Amber Trueblood: 2014 Note: In 2013, the Texas tuberculosis rate was 4.6 per 100,000 compared to the United States rate of 3.0 per 100,000. Tuberculosis Rate, 2009-2013 0.5 - 5.2 5.3 - 14.5 14.6 - 36.2 36.3 - 77.1
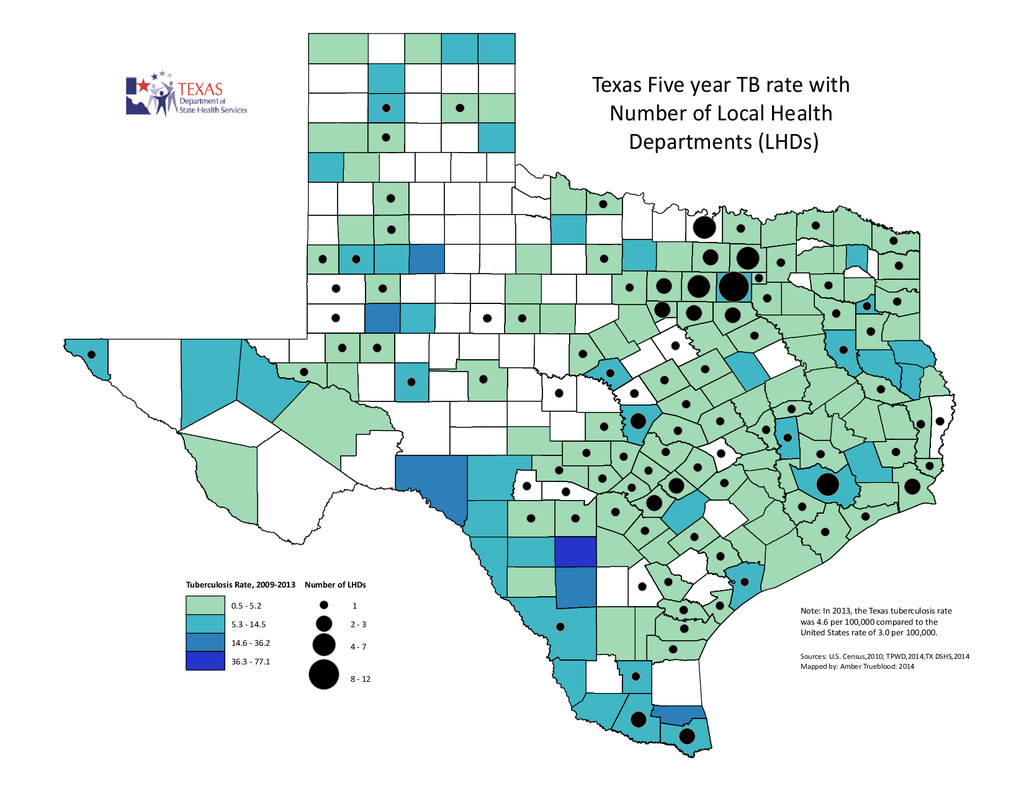
Departments (LHDs) Sources: U.S. Census,2010; TPWD,2014;TX DSHS,2014 Mapped by: Amber Trueblood: 2014 Note: In 2013, the Texas tuberculosis rate was 4.6 per 100,000 compared to the United States rate of 3.0 per 100,000. Tuberculosis Rate, 2009-2013 0.5 - 5.2 5.3 - 14.5 14.6 - 36.2 36.3 - 77.1 Number of LHDs 1 2 - 3 4 - 7 8 - 12
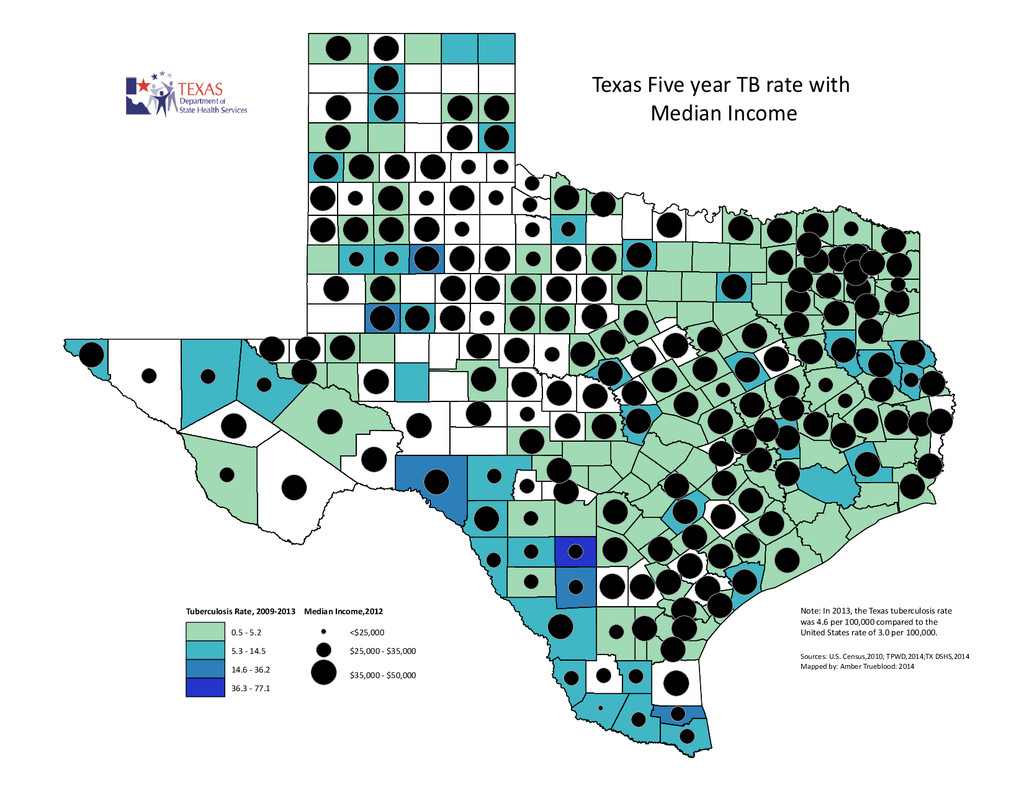
Census,2010; TPWD,2014;TX DSHS,2014 Mapped by: Amber Trueblood: 2014 Note: In 2013, the Texas tuberculosis rate was 4.6 per 100,000 compared to the United States rate of 3.0 per 100,000. Tuberculosis Rate, 2009-2013 0.5 - 5.2 5.3 - 14.5 14.6 - 36.2 36.3 - 77.1 Median Income,2012 <$25,000 $25,000 - $35,000 $35,000 - $50,000
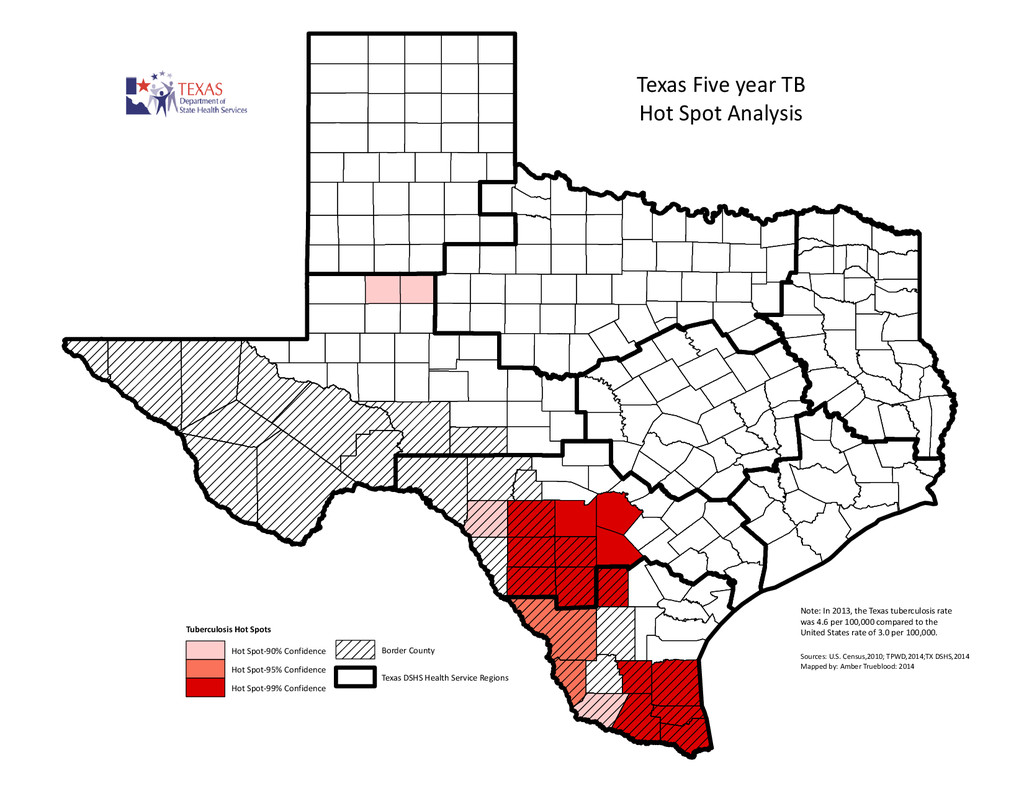
TPWD,2014;TX DSHS,2014 Mapped by: Amber Trueblood: 2014 Note: In 2013, the Texas tuberculosis rate was 4.6 per 100,000 compared to the United States rate of 3.0 per 100,000. Tuberculosis Hot Spots Hot Spot-90% Confidence Hot Spot-95% Confidence Hot Spot-99% Confidence Border County Texas DSHS Health Service Regions
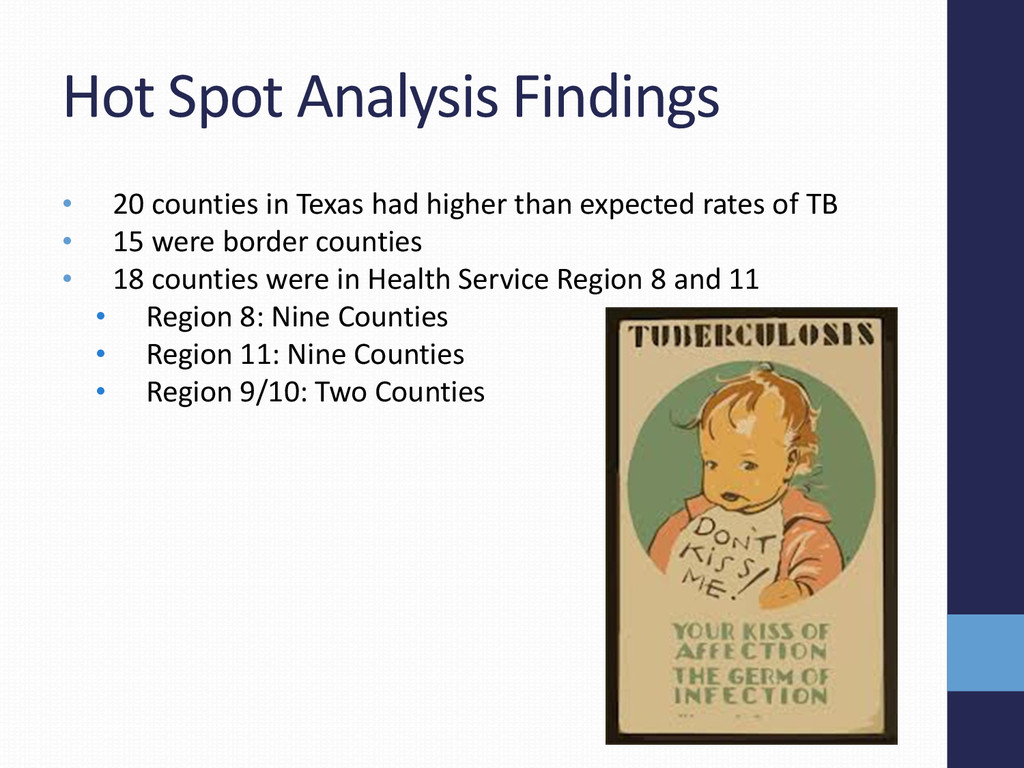
higher than expected rates of TB • 15 were border counties • 18 counties were in Health Service Region 8 and 11 • Region 8: Nine Counties • Region 11: Nine Counties • Region 9/10: Two Counties
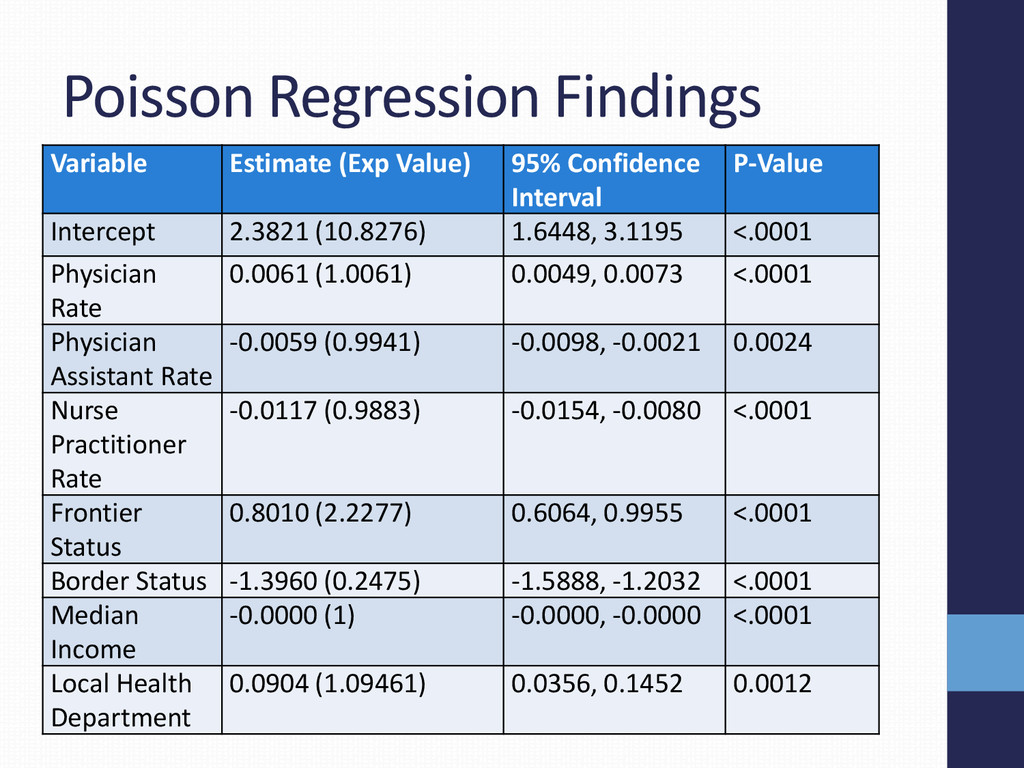
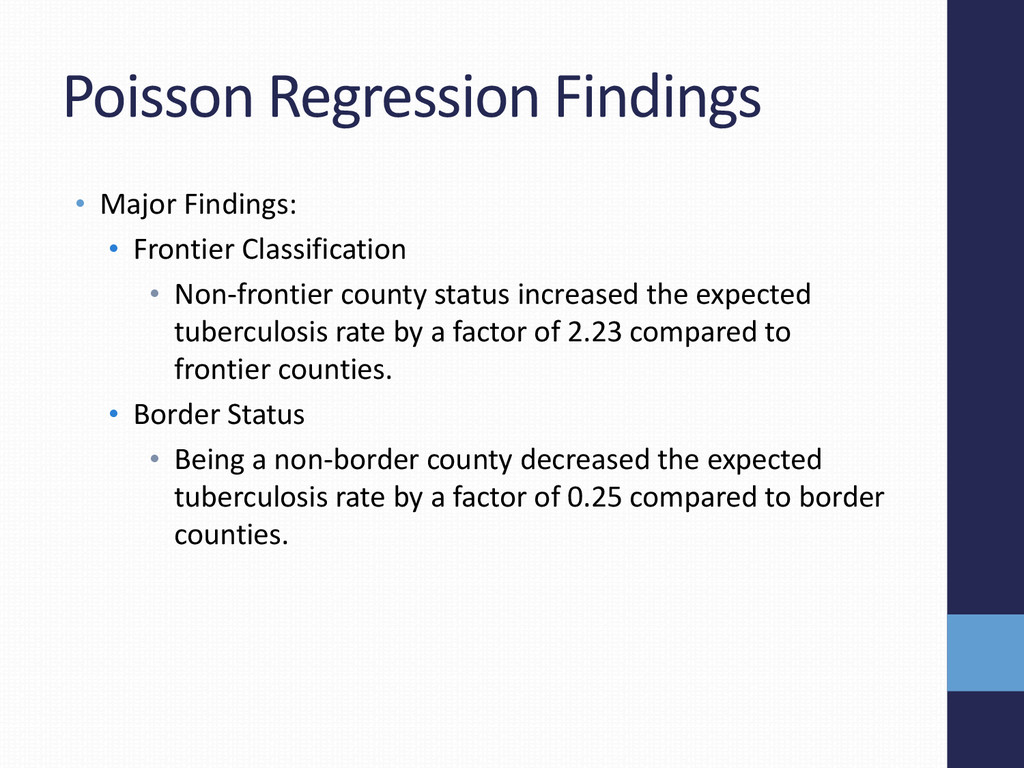
Non-frontier county status increased the expected tuberculosis rate by a factor of 2.23 compared to frontier counties. • Border Status • Being a non-border county decreased the expected tuberculosis rate by a factor of 0.25 compared to border counties.
• Date of Available Data • Using Rates vs Counts • Local Health Departments (LHDs) Limited Available Information • Cannot differentiate services provided by each LHDs
. Retrieved on April 4, 2014 from http://resources.arcgis.com/en/help/main/10.1/index.html#//005p00000021000000 • Shah, Tayyan Ikram; Bell, Scott.(2013). Exploring the Intra-Urban Variations in the Relationship among Geographic Accessibility to PHC Services and Socio-demographic Factors. Conference HealthGIS. • Texas Department of State Health Services. (2013). Texas TB Data (2008-2012). Retrieved on March 3, 2014, from https://www.dshs.state.tx.us/idcu/disease/tb/statistics/ • Window on State Government. (2013). Texas in Focus: A View of Opportunities. Retrieved on May 4, 2014, from http://www.window.state.tx.us/specialrpt/tif/healthcare.html