Upgrade to Pro
— share decks privately, control downloads, hide ads and more …
Speaker Deck
Features
Speaker Deck
PRO
Sign in
Sign up for free
Search
Search
How to probe prometheus & grafana. What is helm
Search
Sponsored
·
Ship Features Fearlessly
Turn features on and off without deploys. Used by thousands of Ruby developers.
→
threetreeslight
November 17, 2018
Technology
54
0
Share
Embed
Copy iframe code
Copy JS code
Copy link
Start on current slide
How to probe prometheus & grafana. What is helm
How to probe prometheus & grafana. What is helm on shinjuku mokumoku programming vol.20
threetreeslight
November 17, 2018
More Decks by threetreeslight
See All by threetreeslight
実録 採用一投入魂
threetreeslight
0
41
Bottleneck is You
threetreeslight
0
130
Japan Office Society オフィスはスタートアップの成長を助長するのか?阻害するのか?
threetreeslight
0
130
スタートアップは見極められたくない
threetreeslight
0
59
VPoEの責務とは
threetreeslight
0
95
CiecleCIでもくもく会を支える技術
threetreeslight
0
69
Ego vs higher self
threetreeslight
0
51
Performance Hack 101
threetreeslight
0
120
複数のスタートアップを 通して得た失敗と学び
threetreeslight
0
90
Other Decks in Technology
See All in Technology
Oracle Exadata Database Service on Cloud@Customer X11M (ExaDB-C@C) サービス概要
oracle4engineer
PRO
2
8.4k
「守りたい体験」を渡すだけで E2E を生成させられるようになった話
hinac0
0
170
AI Agent SaaS を支える自社仮想化基盤への挑戦と実運用 / ai-agent-saas-virtualization
flatt_security
3
4.1k
LLM/Agent評価:トップ営業の発言を「正解」にする 〜暗黙的正解による評価を営業資産に変える〜
takkuhiro
1
230
SRE依存からの脱却 運用を開 発チームへ移す、 フルサイ クル開 発体制の実践
joooee0000
0
3.1k
ガバナンスの「ちょうどいい落とし所」を探れ!開発スピードを妨げない運用判断の勘所 / SRE NEXT 2026
genda
1
240
オブザーバビリティ、本当に活用できてる? 〜API連携×生成AIで成熟度を自動評価〜
dmmsre
1
3.5k
AI、CDK と協働する Full TypeScript アプリケーション開発 / Full TypeScript Application with AI and CDK
geekplus_tech
2
360
Making sense of Google’s agentic dev tools
glaforge
1
280
アップデートで何が変わった?デモで学んで使いこなすIBM Bob2.0
muehara
0
110
誤解だらけの開発生産性 / Myths and Misconceptions about Developer Productivity
i35_267
2
780
2年前に削除したPHPクラスが、 ある日突然決済をエラーにした
ykagano
1
280
Featured
See All Featured
Intergalactic Javascript Robots from Outer Space
tanoku
273
27k
コードの90%をAIが書く世界で何が待っているのか / What awaits us in a world where 90% of the code is written by AI
rkaga
62
45k
Code Review Best Practice
trishagee
74
20k
Chasing Engaging Ingredients in Design
codingconduct
0
240
Six Lessons from altMBA
skipperchong
29
4.3k
Building a Scalable Design System with Sketch
lauravandoore
463
34k
The Hidden Cost of Media on the Web [PixelPalooza 2025]
tammyeverts
2
350
Docker and Python
trallard
47
4k
The World Runs on Bad Software
bkeepers
PRO
72
12k
Hiding What from Whom? A Critical Review of the History of Programming languages for Music
tomoyanonymous
3
970
Design of three-dimensional binary manipulators for pick-and-place task avoiding obstacles (IECON2024)
konakalab
0
490
Collaborative Software Design: How to facilitate domain modelling decisions
baasie
1
260
Transcript
How to probe prometheus & grafana What is helm @threetreeslight
on shinjuku mokumoku programming #20 1 / 19
Who VP of Engineering at Event Organizer おじさん Repro 2
/ 19
今⽇やること blog 監視のgrafana において外形監視が落ちるを解決す る Istio のchart を基にprometheus とgrafana の設定⾒直す
3 / 19
できたこと blog 監視のgrafana において外形監視が落ちるを解決 する Istio のchart を基にprometheus とgrafana の設定⾒直す
あわせて helm chart の構成理解 istio の正常(多分)稼働 4 / 19
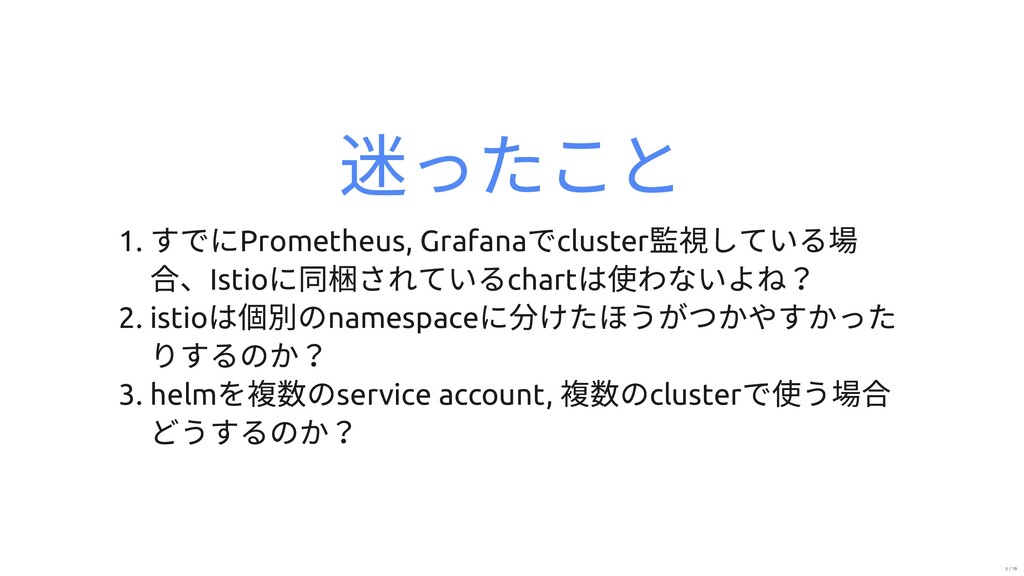
迷ったこと 1. すでにPrometheus, Grafana でcluster 監視している場 合、Istio に同梱されているchart は使わないよね? 2.
istio は個別のnamespace に分けたほうがつかやすかった りするのか? 3. helm を複数のservice account, 複数のcluster で使う場合 どうするのか? 5 / 19
せっかくなので いくつかtips ご紹介 6 / 19
healthcheck Prometheus Grafana 7 / 19
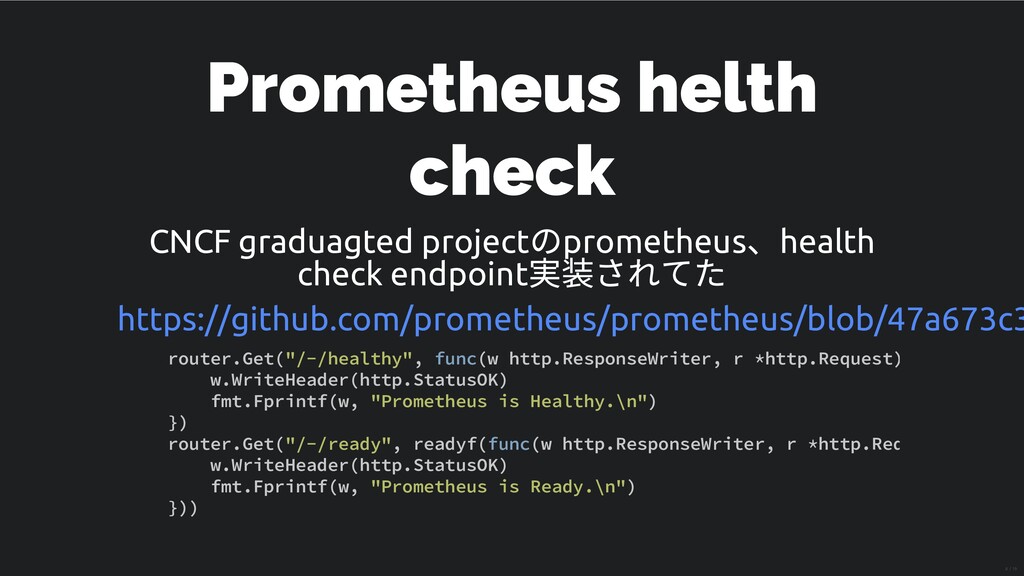
Prometheus helth check CNCF graduagted project のprometheus 、health check endpoint
実装されてた https://github.com/prometheus/prometheus/blob/47a673c3 router.Get("/-/healthy", func(w http.ResponseWriter, r *http.Request) w.WriteHeader(http.StatusOK) fmt.Fprintf(w, "Prometheus is Healthy.\n") }) router.Get("/-/ready", readyf(func(w http.ResponseWriter, r *http.Req w.WriteHeader(http.StatusOK) fmt.Fprintf(w, "Prometheus is Ready.\n") })) 8 / 19
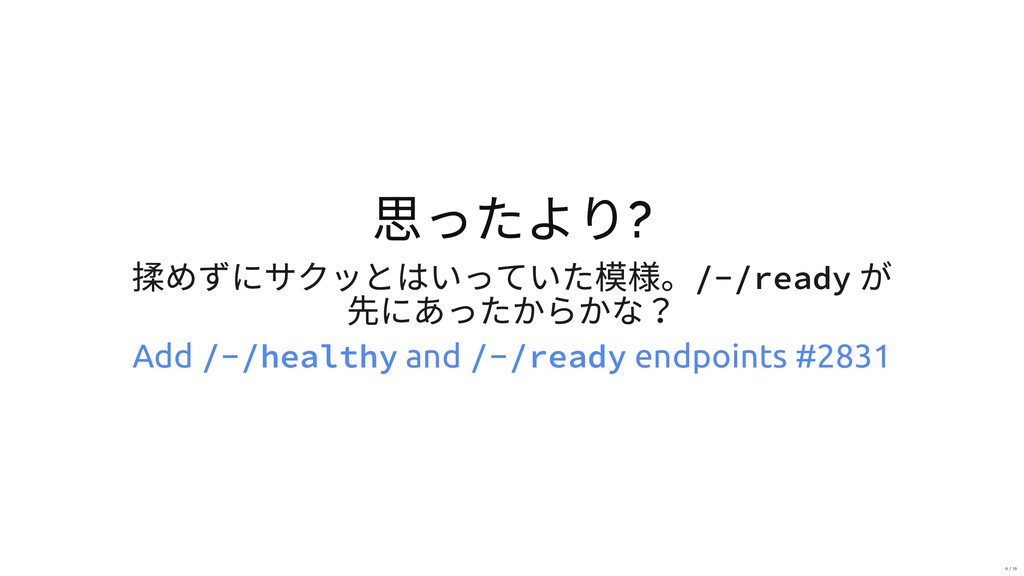
思ったより? 揉めずにサクッとはいっていた模様。/-/ready が 先にあったからかな? Add /-/healthy and /-/ready endpoints #2831
9 / 19
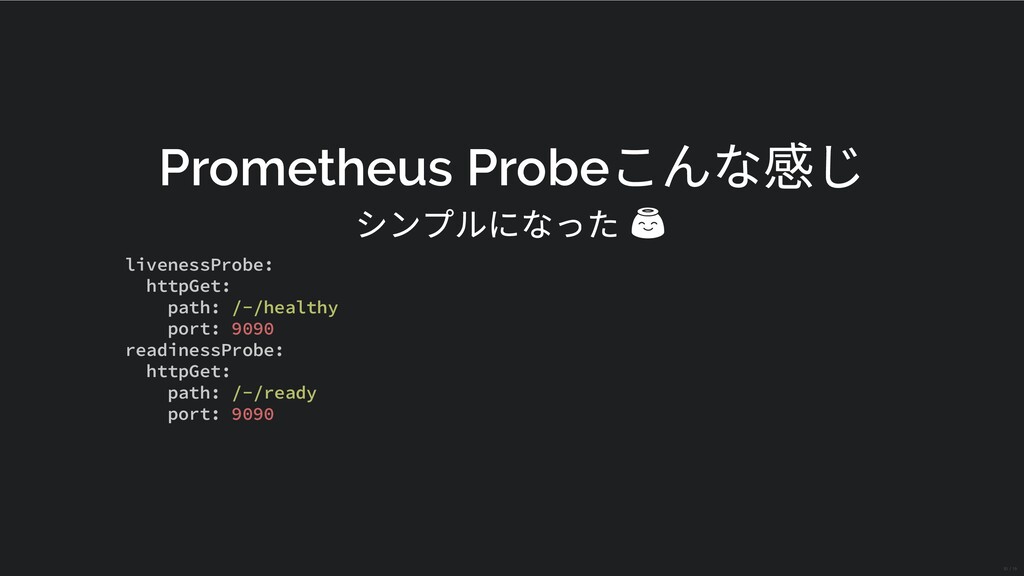
Prometheus Probe こんな感じ シンプルになった livenessProbe: httpGet: path: /-/healthy port: 9090
readinessProbe: httpGet: path: /-/ready port: 9090 10 / 19
Grafana health check で /api/health endpoint が提供されて いた。 Grafana 4.3
https://github.com/grafana/grafana/blob/e78c1b4abc7eda7 func (hs *HTTPServer) healthHandler(ctx *macaron.Context) { notHeadOrGet := ctx.Req.Method != http.MethodGet && ctx.Req.Method != if notHeadOrGet || ctx.Req.URL.Path != "/api/health" { return } data := simplejson.New() data.Set("database", "ok") data.Set("version", setting.BuildVersion) data.Set("commit", setting.BuildCommit) 11 / 19
ぼちぼちコメントが それなりにこまっていたということだろうか?ぼち ぼちコメントが有る。 grafana のicon が帰ってくるかどうかでwork around しているひともいるぐらい。 アクセスすると認証前だったらlogin 画⾯に⾶ばされ
たり、そもそもそのログイン画⾯がちょいと重かっ たりするから欲しい気持ちめっちゃわかる。 Monitoring Grafana #3302 12 / 19
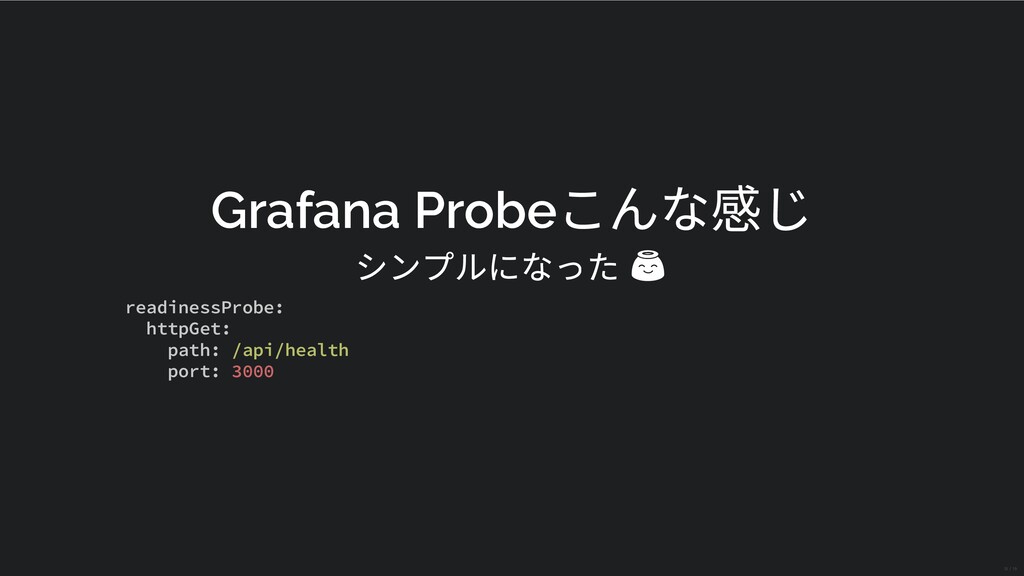
Grafana Probe こんな感じ シンプルになった readinessProbe: httpGet: path: /api/health port: 3000
13 / 19
health check の仕組み が提供されているとよい よね 14 / 19
helm chart 15 / 19
What is helm helm ( ) とは、CNCF ( ) でhosting
されている kubernetes 上のpackage manager 。 https://helm.sh/ https://www.cncf.io/ 16 / 19
stop the copy-and- paste madness. この表現がなされるほどのyaml wall 1. Helm は単純にkubernetes
のresource をGo templating し ているだけ 2. local にchart をおいて複数cluster に展開することもでき るので便利だったりする 細かい話はblog にあげていく 17 / 19
Tips 終わり 18 / 19
頑張っていく 19 / 19