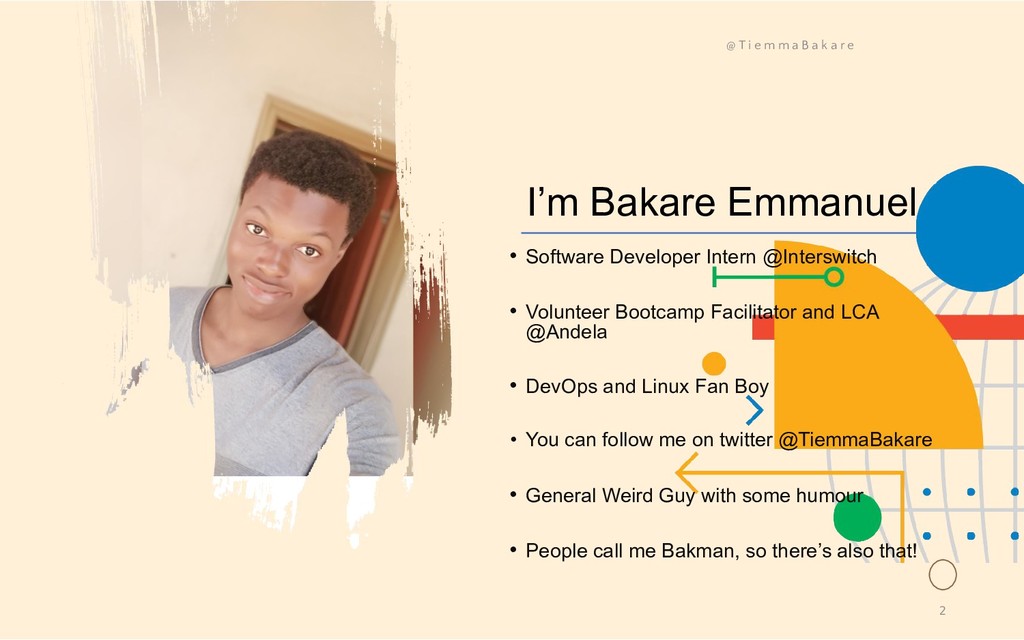
Bootcamp Facilitator and LCA @Andela • DevOps and Linux Fan Boy • You can follow me on twitter @TiemmaBakare • General Weird Guy with some humour • People call me Bakman, so there’s also that! @ T i e m m a B a k a r e 2
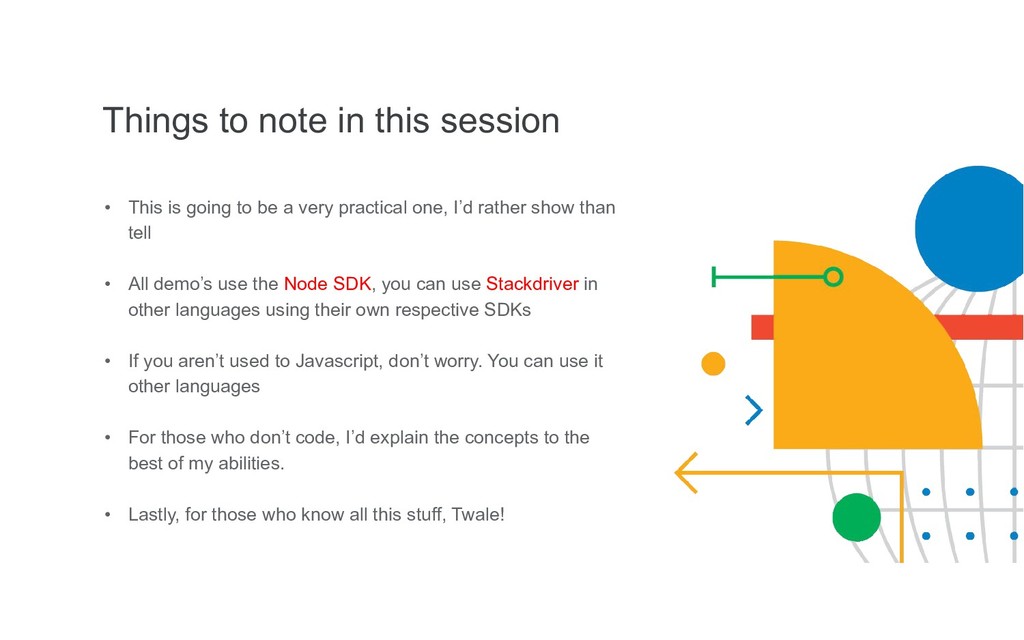
to be a very practical one, I’d rather show than tell • All demo’s use the Node SDK, you can use Stackdriver in other languages using their own respective SDKs • If you aren’t used to Javascript, don’t worry. You can use it other languages • For those who don’t code, I’d explain the concepts to the best of my abilities. • Lastly, for those who know all this stuff, Twale!
which aims to help you analyze the logs your application develops to help you find and diagnose possible performance / error issues. If you want to see the full documented services, check here: https://cloud.google.com/stackdriver/docs/
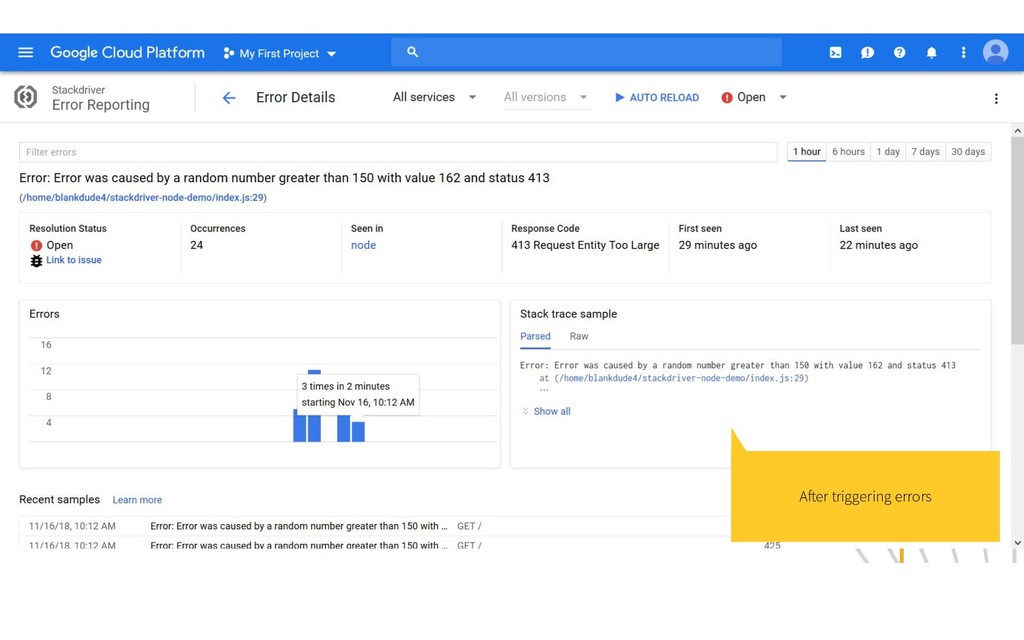
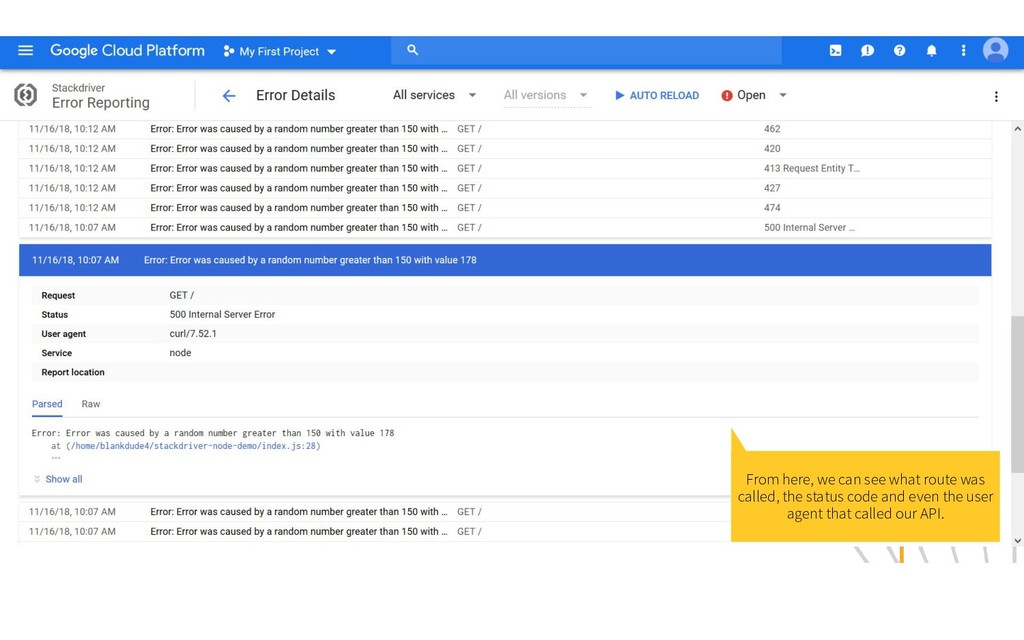
to send errors that occurs in our application to Stackdriver so that they can be analyzed much better. To put this into perspective, how do you know when your data has nearly finished without you checking? That’s what this does, it helps you with gathering things that broke in your application so that you can see it after it happened and take action.
for easy use in your application. It currently supports the following languages: • Go • Java • Node.js • PHP • Python • Ruby • .NET For this demo, I’d be using the Node SDK.
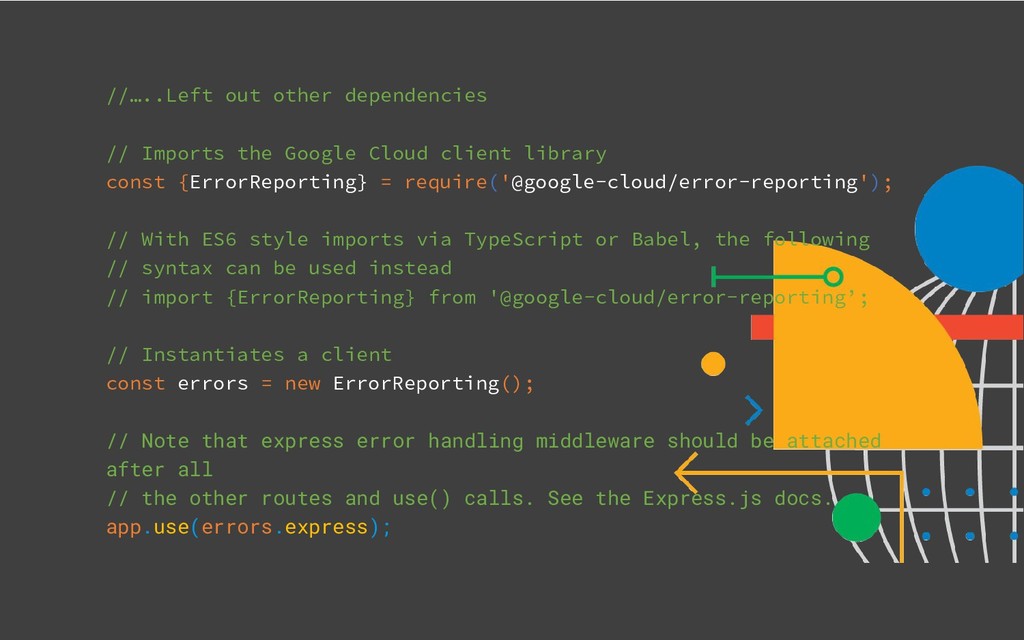
library const {ErrorReporting} = require('@google-cloud/error-reporting'); // With ES6 style imports via TypeScript or Babel, the following // syntax can be used instead // import {ErrorReporting} from '@google-cloud/error-reporting’; // Instantiates a client const errors = new ErrorReporting(); // Note that express error handling middleware should be attached after all // the other routes and use() calls. See the Express.js docs. app.use(errors.express);
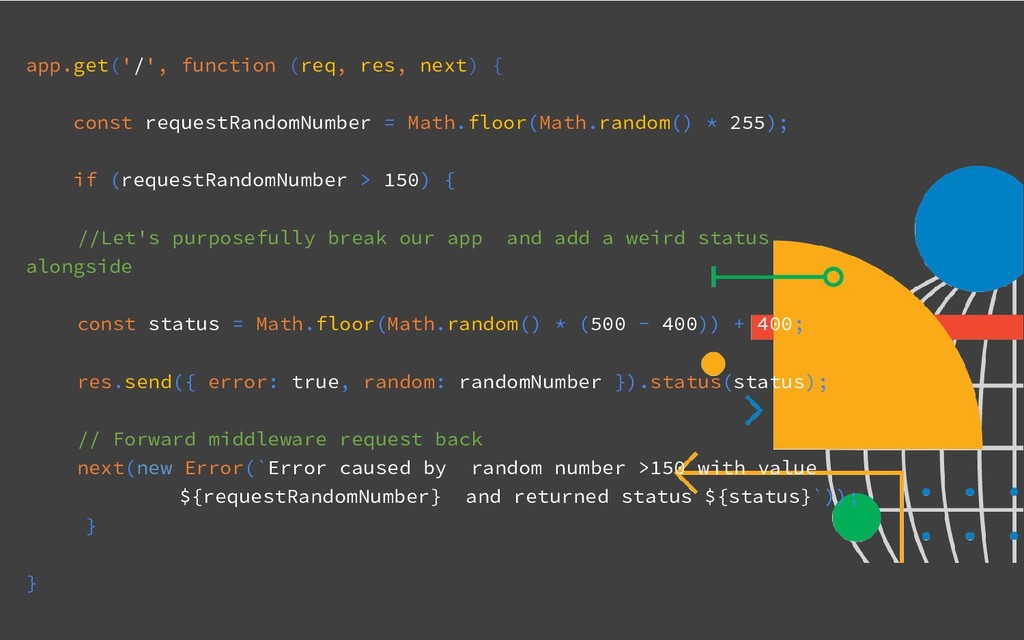
* 255); if (requestRandomNumber > 150) { //Let's purposefully break our app and add a weird status alongside const status = Math.floor(Math.random() * (500 - 400)) + 400; res.send({ error: true, random: randomNumber }).status(status); // Forward middleware request back next(new Error(`Error caused by random number >150 with value ${requestRandomNumber} and returned status ${status}`)); } }
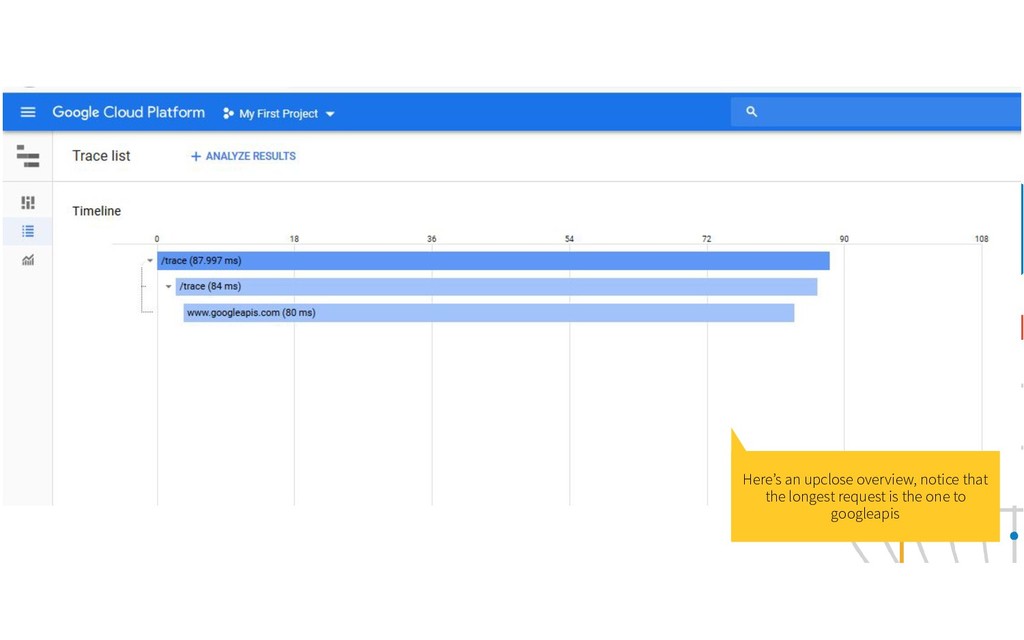
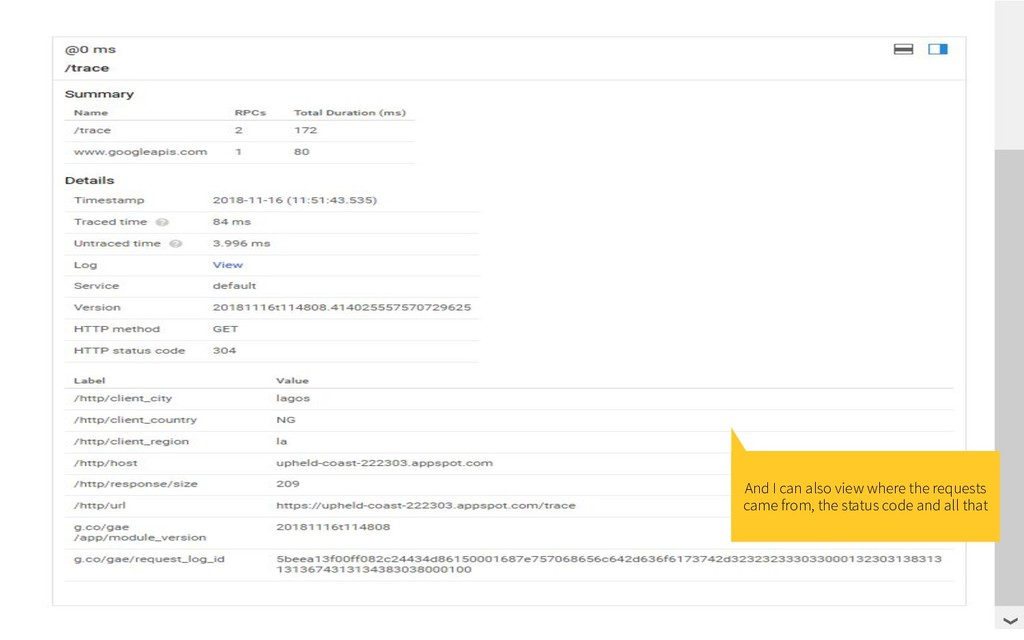
of logging to record information about a program's execution. It tells us things like how long the request took, what other APIs were called during its run, how long it took to render the template and all that. It’s like debugging API calls using a traceroute which is where I’m heading to.
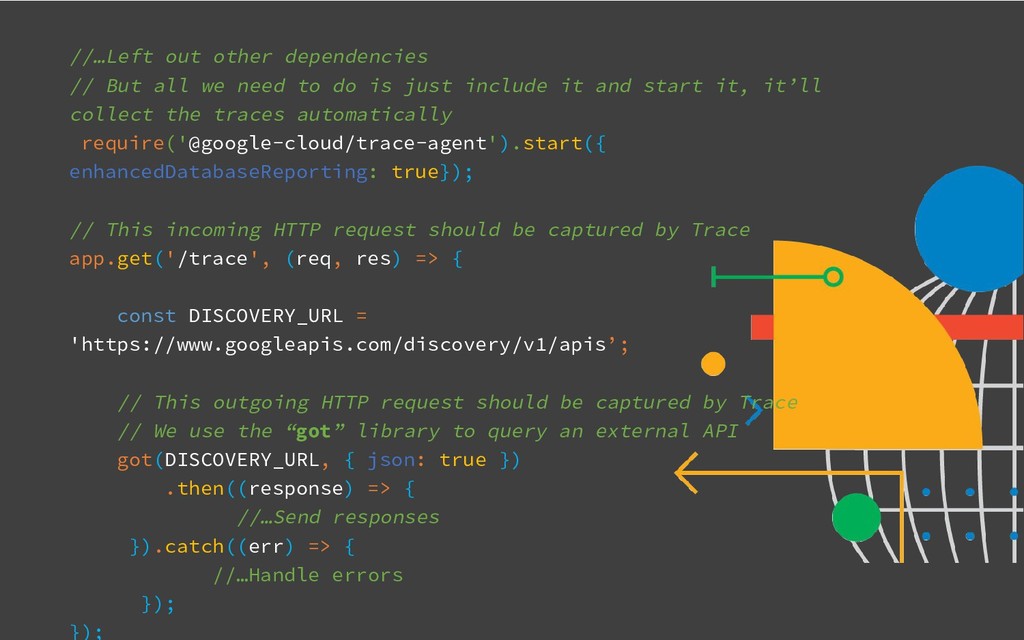
do is just include it and start it, it’ll collect the traces automatically require('@google-cloud/trace-agent').start({ enhancedDatabaseReporting: true}); // This incoming HTTP request should be captured by Trace app.get('/trace', (req, res) => { const DISCOVERY_URL = 'https://www.googleapis.com/discovery/v1/apis’; // This outgoing HTTP request should be captured by Trace // We use the “got” library to query an external API got(DISCOVERY_URL, { json: true }) .then((response) => { //…Send responses }).catch((err) => { //…Handle errors }); });
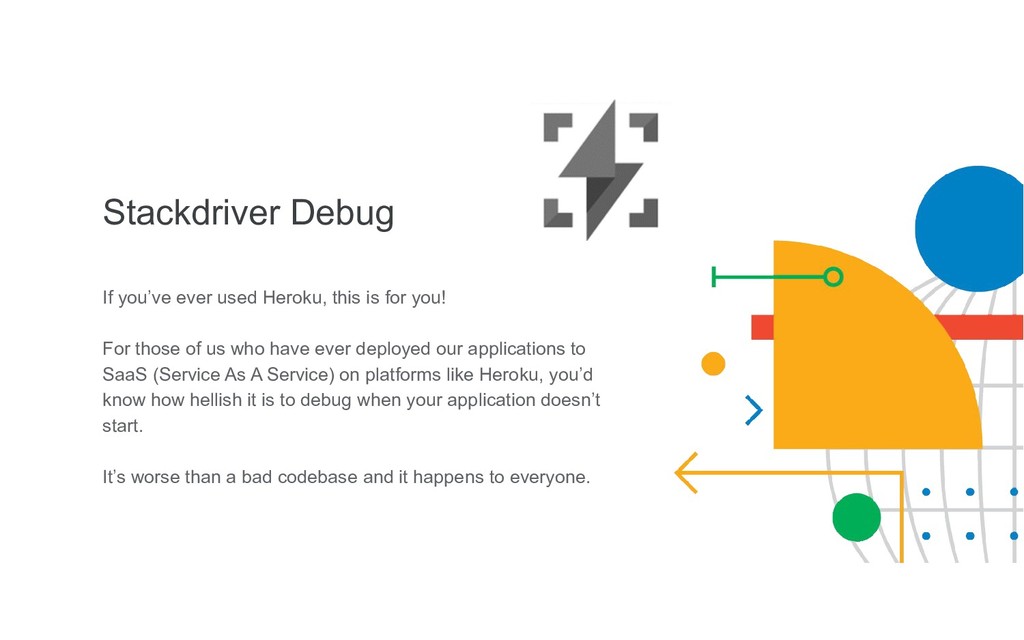
you! For those of us who have ever deployed our applications to SaaS (Service As A Service) on platforms like Heroku, you’d know how hellish it is to debug when your application doesn’t start. It’s worse than a bad codebase and it happens to everyone.
as any debugger, you set a breakpoint and it takes a snapshot of the current stack trace at that point (variable values, errors, object definitions) and allows you move onto other points you define. Like all stackdriver features, we can use the SDK to make our lives easier
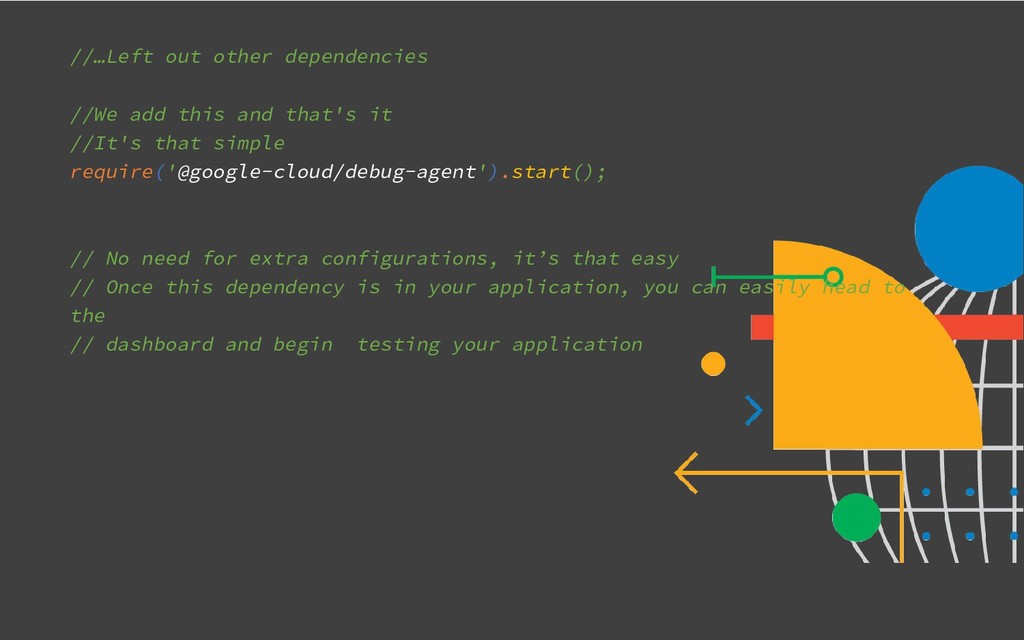
//It's that simple require('@google-cloud/debug-agent').start(); // No need for extra configurations, it’s that easy // Once this dependency is in your application, you can easily head to the // dashboard and begin testing your application
server instances (App Engine, Compute Engine, Kubernetes Engine etc) and stores them in its logging ingestion system. Sometimes, we might have applications that don’t necessarily run on Google Cloud, so how we fix that? So we use the SDK as before!
down to logging, there’s a format to logging that’s very acceptable and this is always implemented by a library for consistency. Never take your print lines to standard output / console as logs, it’s very wrong and makes it hard to know what is an error versus an info. Always use a logging library, for this one I’m using Bunyan.
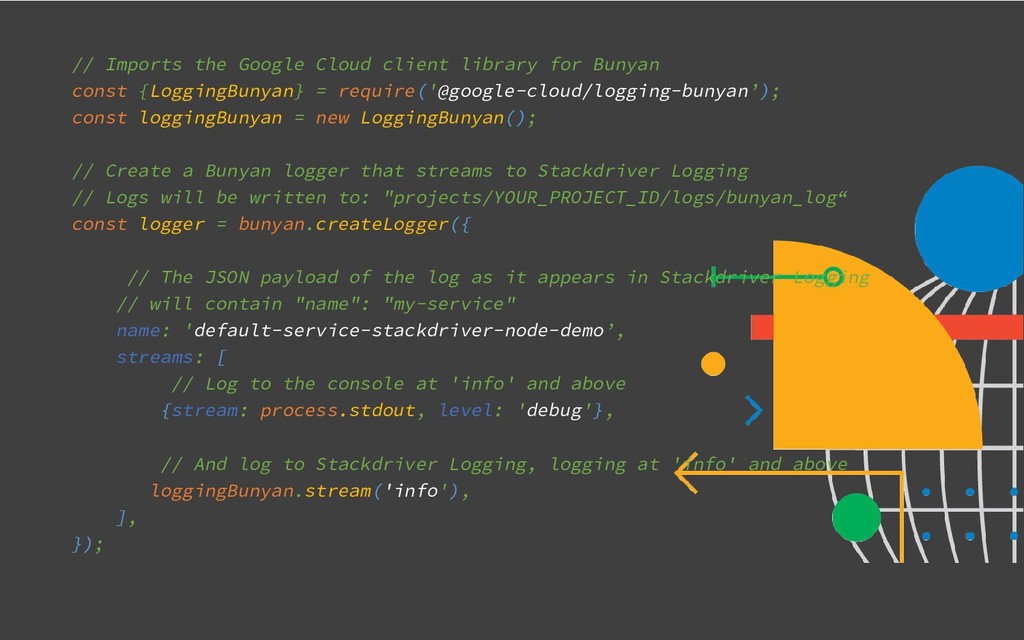
{LoggingBunyan} = require('@google-cloud/logging-bunyan’); const loggingBunyan = new LoggingBunyan(); // Create a Bunyan logger that streams to Stackdriver Logging // Logs will be written to: "projects/YOUR_PROJECT_ID/logs/bunyan_log“ const logger = bunyan.createLogger({ // The JSON payload of the log as it appears in Stackdriver Logging // will contain "name": "my-service" name: 'default-service-stackdriver-node-demo’, streams: [ // Log to the console at 'info' and above {stream: process.stdout, level: 'debug'}, // And log to Stackdriver Logging, logging at 'info' and above loggingBunyan.stream('info'), ], });
https://app.google.stackdriver.com Stackdriver Logging https://cloud.google.com/logging/docs Stackdriver Error Reporting https://cloud.google.com/error-reporting/ docs Stackdriver Debugger https://cloud.google.com/debugger/docs Stackdriver Tracer https://cloud.google.com/trace/docs Stackdriver Profiler [Couldn’t cover this due to time but it’s worth a check] https://cloud.google.com/profiler/docs
![References and Documentation 40 Stackdriver Dashboard [Requires a gCloud account]](https://files.speakerdeck.com/presentations/14933647819f44028889335ba8835c89/slide_39.jpg)