Upgrade to Pro — share decks privately, control downloads, hide ads and more …

DataTalk #41 Deep Learning on 3D Data - Nicola Luminari

DataTalk #41 Deep Learning on 3D Data - Nicola Luminari

Sujet: DEEP LEARNING ON 3D DATA

Speaker: Nicola Luminari, Computer Vision Engineeer chez Delair

Les cameras et la data basées sur l'image ont forcés le développement de réseaux de neurones conventionnels pour résoudre des tâches de vision par ordinateur (détection d'objet etc..).
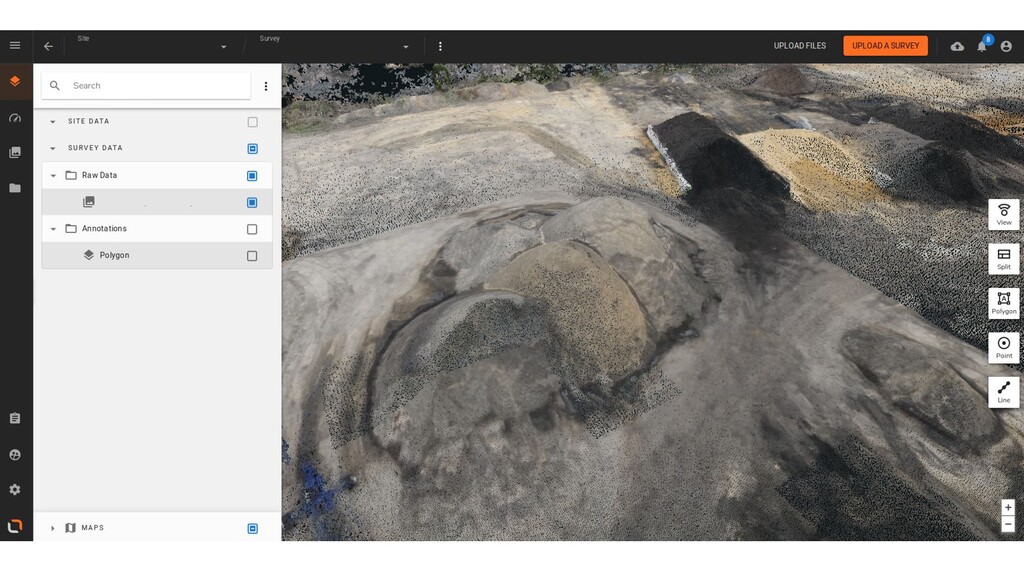
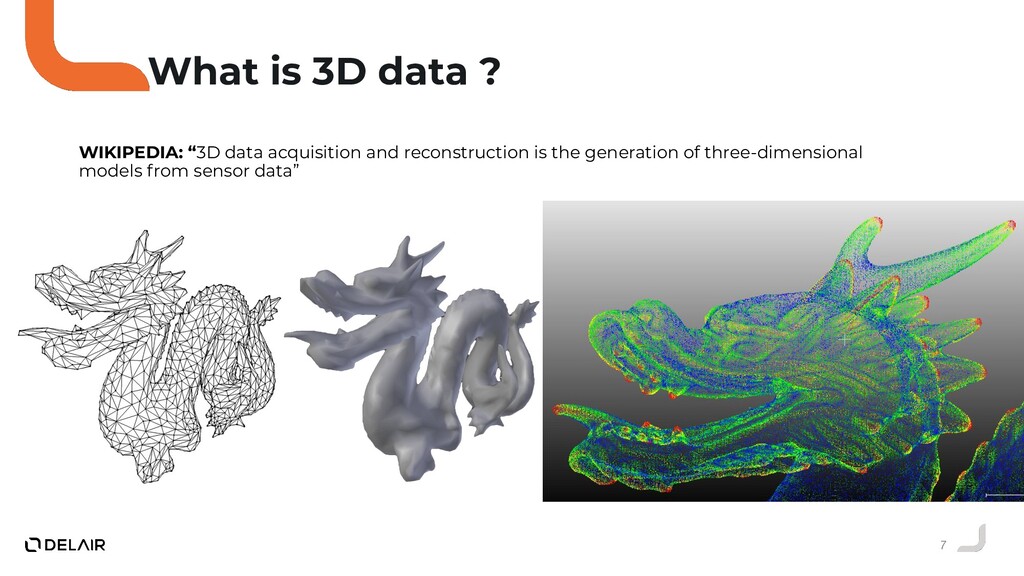
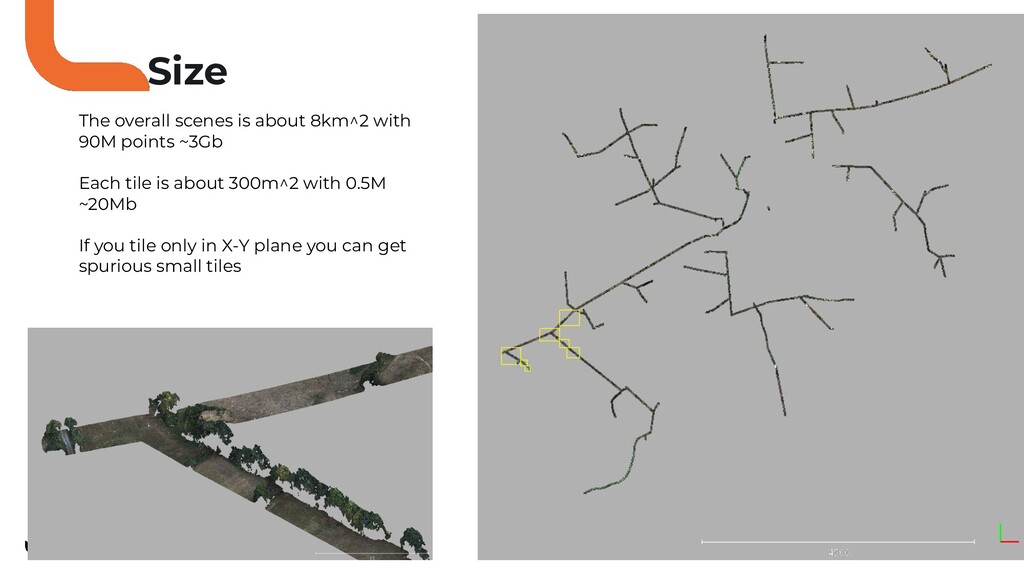
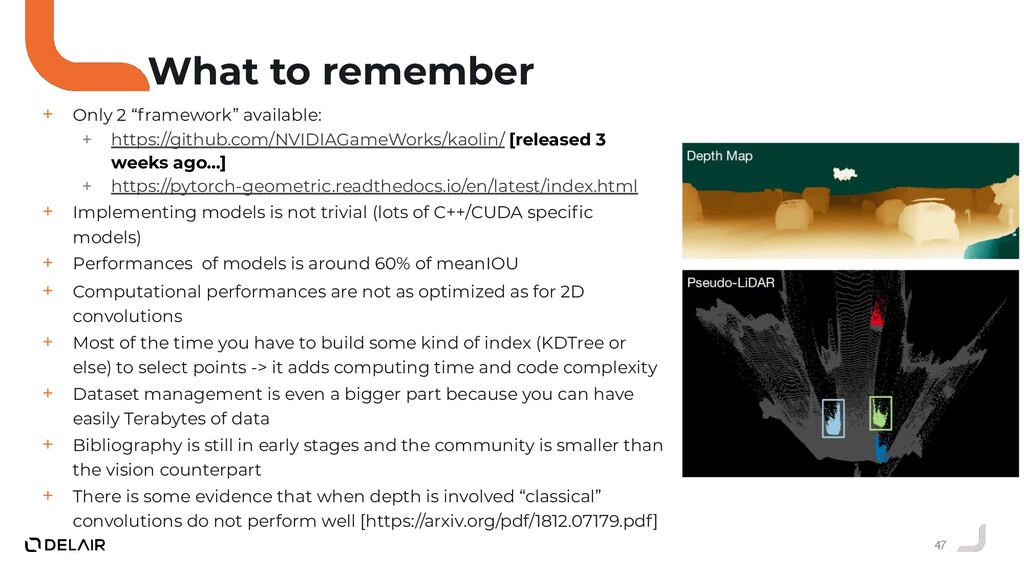
Cependant, aujourd’hui diverses applications comme le mapping par drone et la conduite automatique, utilisent des capteurs différents (comme le LIDAR) qui permettent de produire une représentation 3D de la scène autour du capteur (maillages et/ou nuages de points).

Cette nouvelle typologie de données 3D ne peut pas être traité naïvement avec des réseaux CNN “modernes” à cause de problématique diverses et variés.
De ce fait, de nouvelles CNN spécialisées pour la 3D viennent d'être proposées en littérature.

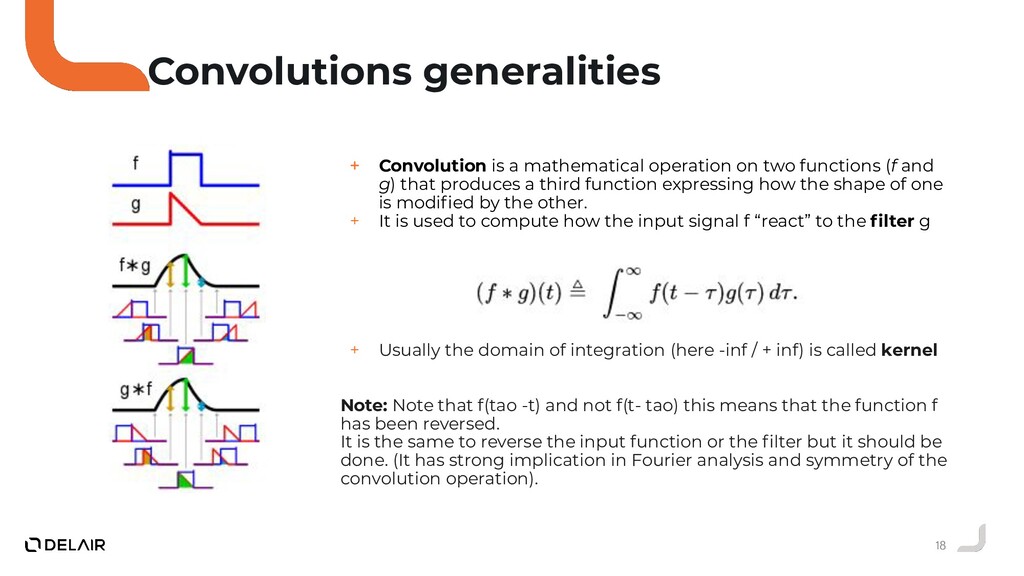
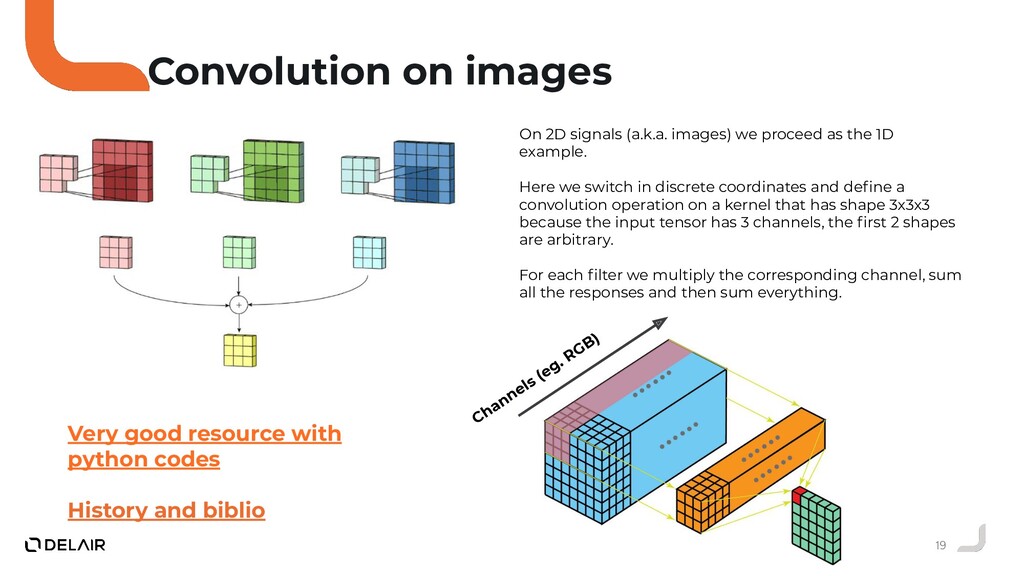
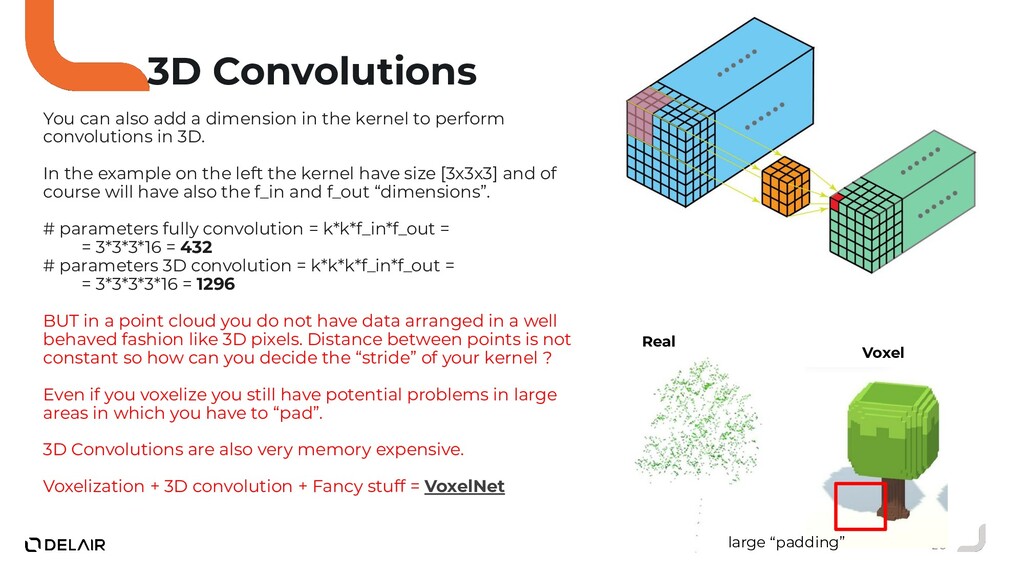
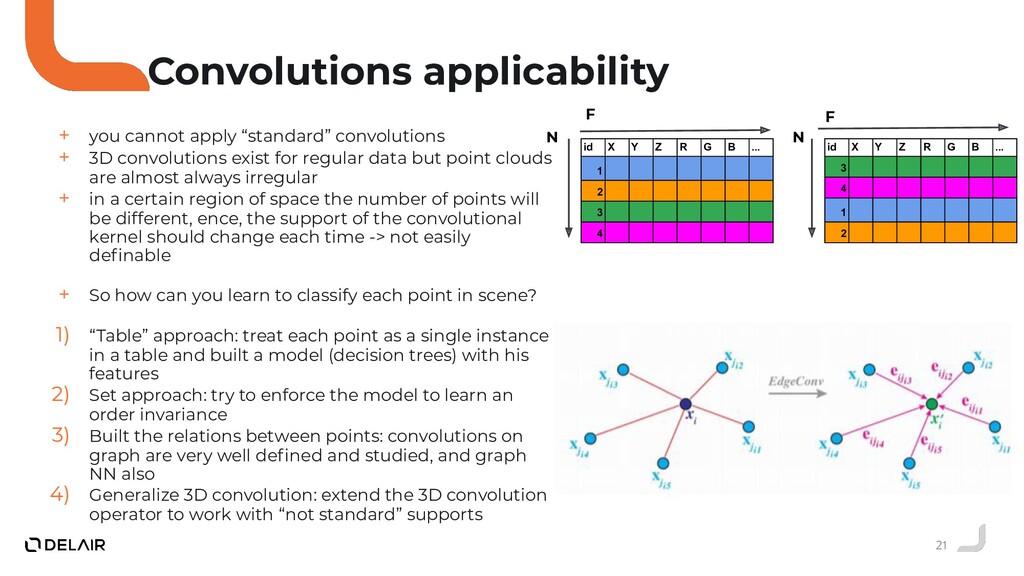
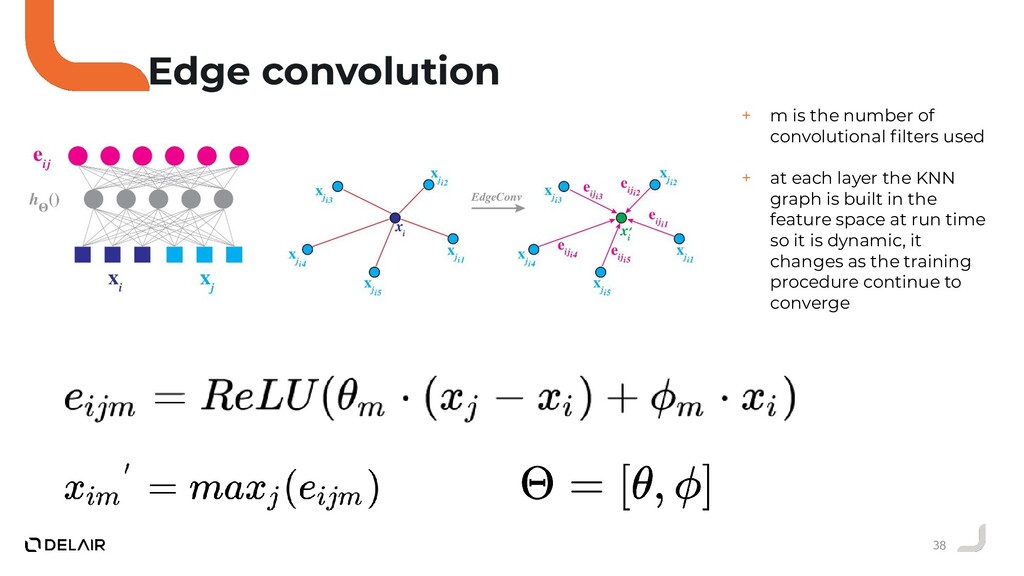
Durant ce talk nous allons voir pourquoi l'opérateur de convolution classique ne peut pas être utilisé directement sur des nuages de points.
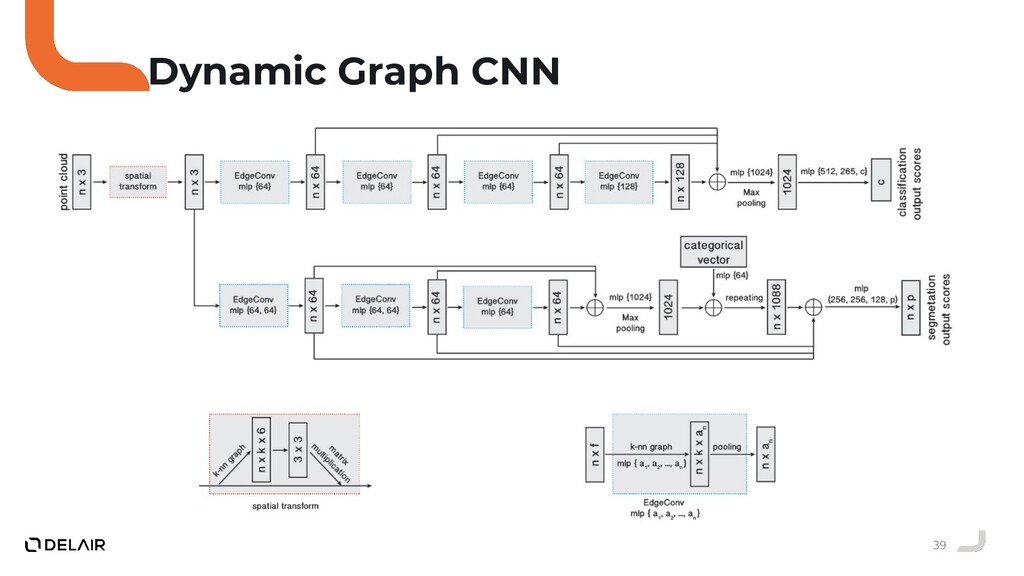
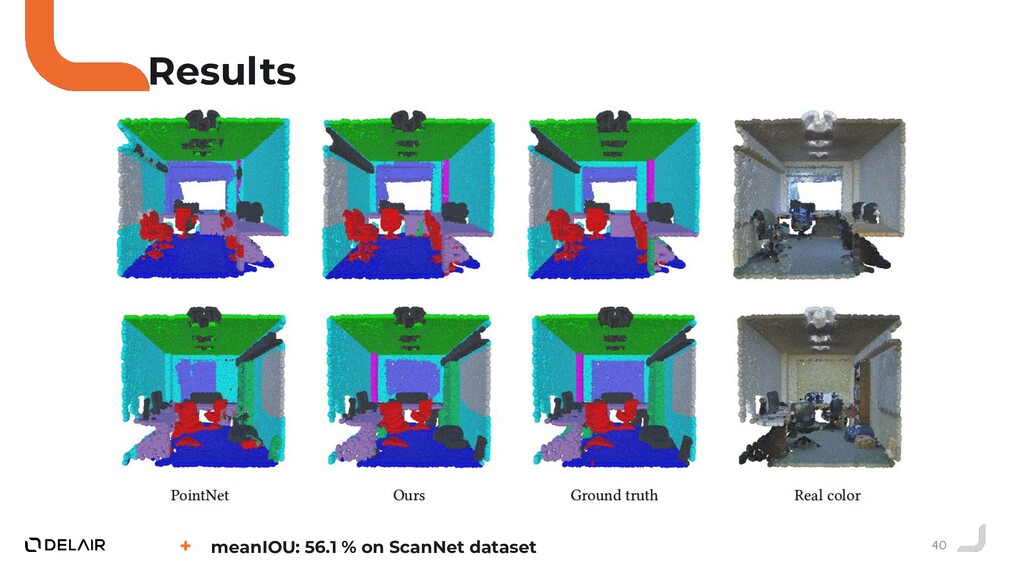
Puis, nous allons faire le tour des solutions proposées par la communauté deep learning sur ce sujet.
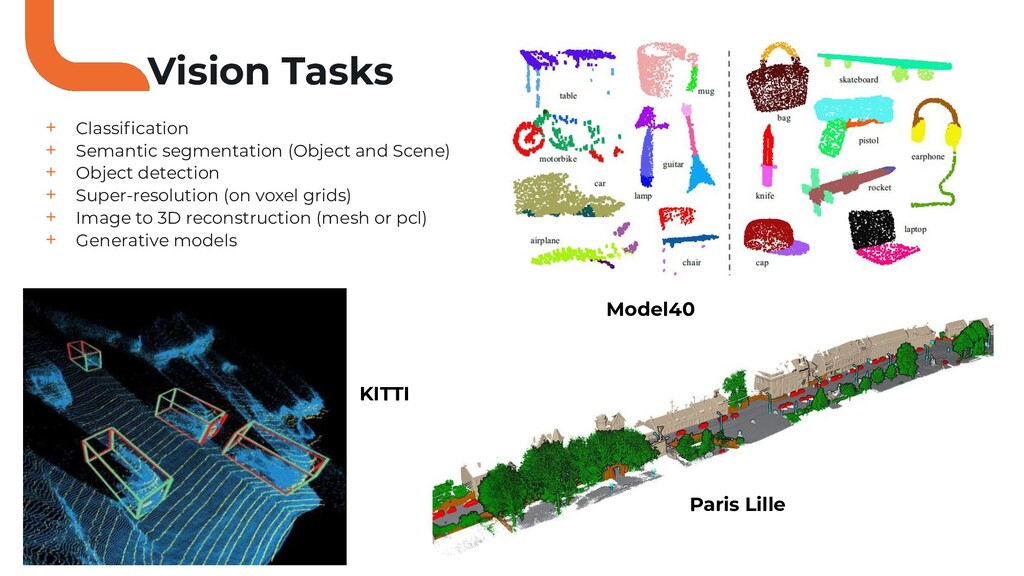
Toulouse Data Science

December 10, 2019
Tweet

More Decks by Toulouse Data Science

Other Decks in Technology

Transcript

  1. View Slide

  2. Deep* Learning
    on 3D data
    * tree-based models may pop-out

    View Slide

  3. View Slide

  4. View Slide

  5. Table of contents
    1. Intro to 3D data and sensors
    2. Point cloud data features
    3. Vision tasks and datasets
    4. “Classical” ML models
    5. “Modern” DL models
    6. Conclusions
    5

    View Slide

  6. Intro to 3D data and sensors

    View Slide

  7. 7
    What is 3D data ?
    WIKIPEDIA: “3D data acquisition and reconstruction is the generation of three-dimensional
    models from sensor data”

    View Slide

  8. 8
    Use cases
    + Autonomous driving
    + Drones measure
    + Navigation (SLAM)
    + Games
    + Any case where the depth perception and
    estimation is needed

    View Slide

  9. 9
    Sensors
    Sensors:
    + CAMERA (Photogrammetry)
    + LIDAR
    Photogrammétrie
    + Use multiple images of the same
    object from multiple position to
    reconstruct the depth
    (aerotriangulation)
    + 3D point cloud and mesh is
    available, with colours !
    LIDAR
    + time of flight sensors use an emitter
    receiver principle to measure the
    depth
    + can pass through vegetation
    + can work at night

    View Slide

  10. Point clouds data features and
    problems

    View Slide

  11. 11
    Data associated problems
    + Density can be non uniform
    + de-densification needed !?
    + Occlusion
    + depending on the applications large zones of
    objects can just not be present
    + Size
    + tiles
    + Connectivity
    + unknown interaction between points
    + points are sparse and unordered
    + Software ecosystem
    + not so many softwares to read/write/manipulate
    files
    + Python is almost unsupported
    + .las file specification is complex to extend

    View Slide

  12. 12
    Size
    The overall scenes is about 8km^2 with
    90M points ~3Gb
    Each tile is about 300m^2 with 0.5M
    ~20Mb
    If you tile only in X-Y plane you can get
    spurious small tiles

    View Slide

  13. 13
    File format/library hell
    + Formats
    + .las is the most common one in
    remote sensing
    + .ply is probably the most spread one
    and easy to use in the ML context but
    does not have GIS capabilities
    + Libraries
    + pdal project goes to a good direction
    but python and GIS integration should
    be improved
    + pylas (and not laspy) works well in
    python but you should know .las spec
    very well to use it

    View Slide

  14. Vision tasks and datasets

    View Slide

  15. 15
    Vision Tasks
    + Classification
    + Semantic segmentation (Object and Scene)
    + Object detection
    + Super-resolution (on voxel grids)
    + Image to 3D reconstruction (mesh or pcl)
    + Generative models
    Paris Lille
    Model40
    KITTI

    View Slide

  16. 16
    Datasets
    + https://modelnet.cs.princeton.edu/ [Classification
    93.6% accuracy]
    + http://www.cvlibs.net/datasets/kitti/ [3D Object
    detection 77.2% mAP]
    + http://www.semantic3d.net/ [Semantic
    segmentation 76.5% averageIOU]
    + http://kaldir.vc.in.tum.de/scannet_benchmark/
    [Semantic segmentation 73.6% averageIOU]
    + http://npm3d.fr/paris-lille-3d [Semantic
    segmentation 82% averageIOU]
    ScanNet
    KITTI

    View Slide

  17. Learning on point clouds

    View Slide

  18. 18
    Convolutions generalities
    + Convolution is a mathematical operation on two functions (f and
    g) that produces a third function expressing how the shape of one
    is modified by the other.
    + It is used to compute how the input signal f “react” to the filter g
    + Usually the domain of integration (here -inf / + inf) is called kernel
    Note: Note that f(tao -t) and not f(t- tao) this means that the function f
    has been reversed.
    It is the same to reverse the input function or the filter but it should be
    done. (It has strong implication in Fourier analysis and symmetry of the
    convolution operation).

    View Slide

  19. 19
    Convolution on images
    On 2D signals (a.k.a. images) we proceed as the 1D
    example.
    Here we switch in discrete coordinates and define a
    convolution operation on a kernel that has shape 3x3x3
    because the input tensor has 3 channels, the first 2 shapes
    are arbitrary.
    For each filter we multiply the corresponding channel, sum
    all the responses and then sum everything.
    Very good resource with
    python codes
    History and biblio
    Channels (eg. RGB)

    View Slide

  20. 20
    3D Convolutions
    You can also add a dimension in the kernel to perform
    convolutions in 3D.
    In the example on the left the kernel have size [3x3x3] and of
    course will have also the f_in and f_out “dimensions”.
    # parameters fully convolution = k*k*f_in*f_out =
    = 3*3*3*16 = 432
    # parameters 3D convolution = k*k*k*f_in*f_out =
    = 3*3*3*3*16 = 1296
    BUT in a point cloud you do not have data arranged in a well
    behaved fashion like 3D pixels. Distance between points is not
    constant so how can you decide the “stride” of your kernel ?
    Even if you voxelize you still have potential problems in large
    areas in which you have to “pad”.
    3D Convolutions are also very memory expensive.
    Voxelization + 3D convolution + Fancy stuff = VoxelNet
    Real
    Voxel
    large “padding”

    View Slide

  21. 21
    Convolutions applicability
    + you cannot apply “standard” convolutions
    + 3D convolutions exist for regular data but point clouds
    are almost always irregular
    + in a certain region of space the number of points will
    be different, ence, the support of the convolutional
    kernel should change each time -> not easily
    definable
    + So how can you learn to classify each point in scene?
    1) “Table” approach: treat each point as a single instance
    in a table and built a model (decision trees) with his
    features
    2) Set approach: try to enforce the model to learn an
    order invariance
    3) Built the relations between points: convolutions on
    graph are very well defined and studied, and graph
    NN also
    4) Generalize 3D convolution: extend the 3D convolution
    operator to work with “not standard” supports
    id X Y Z R G B ...
    1
    2
    3
    4
    id X Y Z R G B ...
    3
    4
    1
    2
    N
    F F
    N

    View Slide

  22. “Classical” machine learning
    models

    View Slide

  23. Point cloud as a Table
    id X Y Z R G B ...
    1
    2
    3
    4

    View Slide

  24. 24
    Tabular data
    + Tabular data is probably the most common
    data structure “in the wild”
    + Many tree based approaches works very well
    (XGBoost, LigthGBM, Random Forest… you
    name it)
    + However the basic feature space in a point
    cloud is limited (XYZ, RGB sometimes)
    + XYZ coordinates also is not a good
    representative feature (2 points can be
    completely far apart and have the same label)
    id X Y Z R G B ...
    1
    2
    3
    4

    View Slide

  25. 25
    Feature engineering in point cloud
    + The problem with a tabular vision of point clouds is that
    the 3D coordinates does not represent a good way of
    define spatial relations
    + We need a way to aggregate information of the
    neighbourhood of a point
    + Define a set of spatial scales (eg. 0.25m, 0.5m, 1m,
    2m)
    + for each scale:
    + for each point:
    + select the neighbor points group [knn vs ball
    query]
    + compute covariance matrix using XYZ
    coordinates of the points in the neighborhood
    + compute eigenvalues
    + compute features (eigen*, colour, purely
    geometric)
    + add these features to the one already
    present to the point

    View Slide

  26. 26
    Feature examples

    View Slide

  27. 27
    Pipeline
    FEATURES
    TILE PREDICTIONS
    MERGE

    View Slide

  28. 28
    Problems
    + Pipeline of feature engineering can be long
    + Tree based models are not well adapted to ingest billions of
    points and still train
    + Using neighbours is an hack (a clever one) to bypass the
    spatial coherence problem
    + How to choose the value and number of scales ?
    + How to choose the query mode (KNN or ball query ?)
    + How to choose the features ?
    + How about non uniform density features ?

    View Slide

  29. “Modern” deep learning models

    View Slide

  30. Point cloud as a Set

    View Slide

  31. 31
    Point clouds as a set
    + Consider the point cloud as a whole
    (mathematically is a set). A collection of points
    + NN on sets has already been studied for problems
    like set anomaly detection and image labelling.
    + Which properties should the network have to
    translate to point cloud?
    + permutation invariance
    + translation invariance
    + take into account local context (in euclidean
    and feature space)

    View Slide

  32. 32
    DeepSets
    is a neural
    network
    is a neural
    network
    latent
    space
    sum //
    element-wise
    max
    set
    representation
    as a whole

    View Slide

  33. 33
    PointNet

    View Slide

  34. 34
    Results
    + meanIOU: 47.71 % on ScanNet
    dataset

    View Slide

  35. 35
    Problems
    + how to batch ? In this case a “batch”
    cannot be a group of points because
    the set is unordered. So the “atomic”
    data of a pcl is a tile. It means that the
    input tensor has size: [B, N, F]
    + But from tile to tile N can change !!!!!!!
    + Random (or intelligent sampling) is
    needed to keep N constant ->
    destroying part of the local
    neighbours informations. [PointNet
    fix tile size as 1x1m and 4096
    random points per tile ]
    Batch
    [B, N, F] = [4, ?, 6]
    Input tensor

    View Slide

  36. Point cloud as a Graph

    View Slide

  37. 37
    Graphs
    + Graph representation of a pcl have the potential to solve some problems:
    + once the graph is built we know exactly the local neighbours for each point
    + convolutions are well defined on graph -> we can mimic classic CNN architecture to solve the
    same problem
    + permutation / translation invariance in no long a problem because of the connections that are
    now defined
    + But how to build the graph ?
    + k nearest neighbour
    k=2 k=5

    View Slide

  38. 38
    Edge convolution
    + m is the number of
    convolutional filters used
    + at each layer the KNN
    graph is built in the
    feature space at run time
    so it is dynamic, it
    changes as the training
    procedure continue to
    converge

    View Slide

  39. 39
    Dynamic Graph CNN

    View Slide

  40. 40
    Results
    + meanIOU: 56.1 % on ScanNet dataset

    View Slide

  41. Point cloud as a Point Cloud

    View Slide

  42. 42
    Kernel Point Convolutions
    + is the set of points contained in a sphere
    + k is the number of convolutional filters in the layer
    + are called kernel points and they fix the spatial
    position of the weights in this type of convolution
    + The size of select the size of the receptive field
    + You do not need to perform any
    pre-processing of the input data
    + Topology of the kernel points is
    differentiable so it can be learned
    + SOTA (state of the art) in most of 3D
    vision datasets
    + It came from french research

    View Slide

  43. 43
    Convolution comparison

    View Slide

  44. 44
    Segmentation architecture

    View Slide

  45. 45
    Results
    + meanIOU: 67.1 % on
    ScanNet dataset

    View Slide

  46. Conclusions

    View Slide

  47. 47
    What to remember
    + Only 2 “framework” available:
    + https://github.com/NVIDIAGameWorks/kaolin/ [released 3
    weeks ago...]
    + https://pytorch-geometric.readthedocs.io/en/latest/index.html
    + Implementing models is not trivial (lots of C++/CUDA specific
    models)
    + Performances of models is around 60% of meanIOU
    + Computational performances are not as optimized as for 2D
    convolutions
    + Most of the time you have to build some kind of index (KDTree or
    else) to select points -> it adds computing time and code complexity
    + Dataset management is even a bigger part because you can have
    easily Terabytes of data
    + Bibliography is still in early stages and the community is smaller than
    the vision counterpart
    + There is some evidence that when depth is involved “classical”
    convolutions do not perform well [https://arxiv.org/pdf/1812.07179.pdf]

    View Slide

  48. 48
    Honorable mentions of network
    architectures
    + Superpoint Graph (another french research ): it introduce an
    unsupervised graph segmentation and a RNN like layer
    + SnapNet (another french research ): uses artificial camera locations to
    project the 3D point cloud to 2D images and perform the segmentation in
    2D and then it reproject the label back to the 3D.
    + PointNet++: expand the pointNet architecture to a multiple scale analysis to
    mimic what convolutions do in CNN

    View Slide

  49. 49
    Bibliography
    Machine Learning
    + https://arxiv.org/abs/1808.00495
    + https://ethz.ch/content/dam/ethz/special-interest/baug/igp/photogrammetry-remote-
    sensing-dam/documents/pdf/timo-jan-isprs2016.pdf
    + https://hal.archives-ouvertes.fr/hal-01497548/document
    Deep Learning
    + https://arxiv.org/pdf/1908.08854.pdf
    + https://arxiv.org/abs/1703.06114
    + https://arxiv.org/abs/1901.09006
    + https://arxiv.org/abs/1612.00593
    + https://arxiv.org/abs/1706.02413
    + https://arxiv.org/abs/1711.06396
    + https://blesaux.github.io/files/2017-11-10-aboulch-snapnet-CAG17.pdf
    + http://openaccess.thecvf.com/content_cvpr_2018/papers/Landrieu_Large-Scale_Point_
    Cloud_CVPR_2018_paper.pdf
    + https://arxiv.org/abs/1904.08889

    View Slide

  50. 50
    Interesting links
    + https://github.com/Yochengliu/awesome-point-cloud-analysis
    + https://www.inference.vc/deepsets-modeling-permutation-invariance/
    + https://pdal.io/
    + https://pylas.readthedocs.io/en/latest/
    + https://www.cgal.org/
    + https://github.com/NVIDIAGameWorks/kaolin
    + https://pytorch-geometric.readthedocs.io/en/latest/
    + http://geometricdeeplearning.com/
    + https://networkx.github.io/
    + https://www.cse.wustl.edu/~muhan/papers/AAAI_2018_DGCNN.pdf
    + https://github.com/muhanzhang/pytorch_DGCNN

    View Slide

  51. Thank you.
    Follow us
    Contact us
    [email protected]
    www.delair.aero

    View Slide

  52. View Slide